. 2017 Jul 6;547(7661):109-113.
doi: 10.1038/nature22964. Epub 2017 Jun 28.

mTORC1-dependent AMD1 regulation sustains polyamine metabolism in prostate cancer

Amaia Zabala-Letona #  1   2 Amaia Arruabarrena-Aristorena #  1 Natalia Martín-Martín  1   2 Sonia Fernandez-Ruiz  1   2 James D Sutherland  1 Michelle Clasquin  3 Julen Tomas-Cortazar  1 Jose Jimenez  4 Ines Torres  5 Phong Quang  3 Pilar Ximenez-Embun  6 Ruzica Bago  7 Aitziber Ugalde-Olano  8 Ana Loizaga-Iriarte  9 Isabel Lacasa-Viscasillas  9 Miguel Unda  9 Verónica Torrano  1   2 Diana Cabrera  1 Sebastiaan M van Liempd  1 Ylenia Cendon  6   10 Elena Castro  6 Stuart Murray  3 Ajinkya Revandkar  11   12 Andrea Alimonti  11   12 Yinan Zhang  13 Amelia Barnett  3 Gina Lein  3 David Pirman  3 Ana R Cortazar  1 Leire Arreal  1 Ludmila Prudkin  4 Ianire Astobiza  1 Lorea Valcarcel-Jimenez  1 Patricia Zuñiga-García  1 Itziar Fernandez-Dominguez  1 Marco Piva  1 Alfredo Caro-Maldonado  1 Pilar Sánchez-Mosquera  1 Mireia Castillo-Martín  14   15 Violeta Serra  2   4 Naiara Beraza  1 Antonio Gentilella  16 George Thomas  16 Mikel Azkargorta  1   17 Felix Elortza  1   17   18 Rosa Farràs  19 David Olmos  6   20 Alejo Efeyan  6 Juan Anguita  1   21 Javier Muñoz  6   17 Juan M Falcón-Pérez  1   18   21 Rosa Barrio  1 Teresa Macarulla  2   4 Jose M Mato  1   18 Maria L Martinez-Chantar  1   18 Carlos Cordon-Cardo  14 Ana M Aransay  1   18 Kevin Marks  3 José Baselga  22 Josep Tabernero  2   4 Paolo Nuciforo  4 Brendan D Manning  13 Katya Marjon  3 Arkaitz Carracedo  1   2   21   23
Affiliations

mTORC1-dependent AMD1 regulation sustains polyamine metabolism in prostate cancer

Amaia Zabala-Letona et al. Nature. .

Erratum in

  • Corrigendum: mTORC1-dependent AMD1 regulation sustains polyamine metabolism in prostate cancer.
    Zabala-Letona A, Arruabarrena-Aristorena A, Martín-Martín N, Fernandez-Ruiz S, Sutherland JD, Clasquin M, Tomas-Cortazar J, Jimenez J, Torres I, Quang P, Ximenez-Embun P, Bago R, Ugalde-Olano A, Loizaga-Iriarte A, Lacasa-Viscasillas I, Unda M, Torrano V, Cabrera D, van Liempd SM, Cendon Y, Castro E, Murray S, Revandkar A, Alimonti A, Zhang Y, Barnett A, Lein G, Pirman D, Cortazar AR, Arreal L, Prudkin L, Astobiza I, Valcarcel-Jimenez L, Zuñiga-García P, Fernandez-Dominguez I, Piva M, Caro-Maldonado A, Sánchez-Mosquera P, Castillo-Martín M, Serra V, Beraza N, Gentilella A, Thomas G, Azkargorta M, Elortza F, Farràs R, Olmos D, Efeyan A, Anguita J, Muñoz J, Falcón-Pérez JM, Barrio R, Macarulla T, Mato JM, Martinez-Chantar ML, Cordon-Cardo C, Aransay AM, Marks K, Baselga J, Tabernero J, Nuciforo P, Manning BD, Marjon K, Carracedo A. Zabala-Letona A, et al. Nature. 2018 Feb 22;554(7693):554. doi: 10.1038/nature25470. Epub 2018 Jan 17. Nature. 2018. PMID: 29342137

Abstract

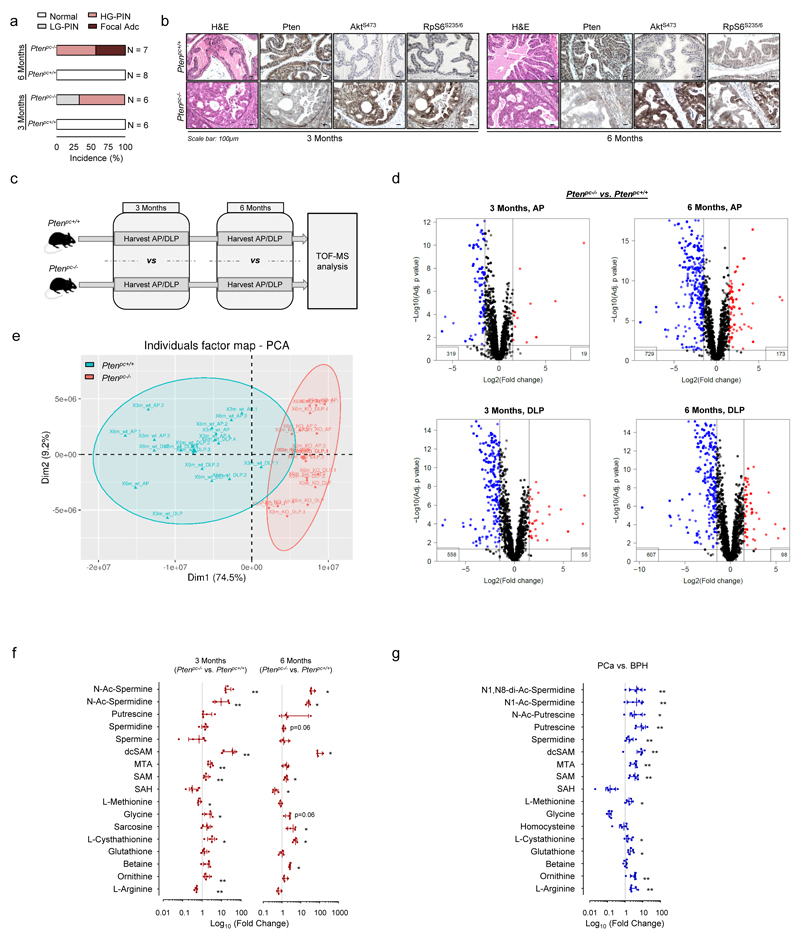
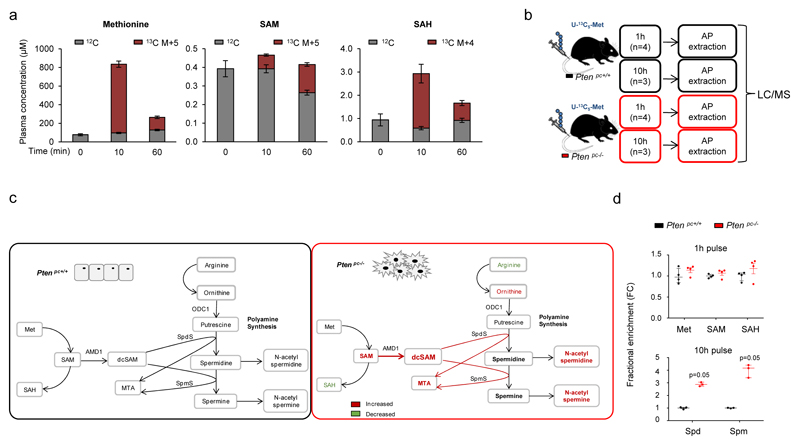
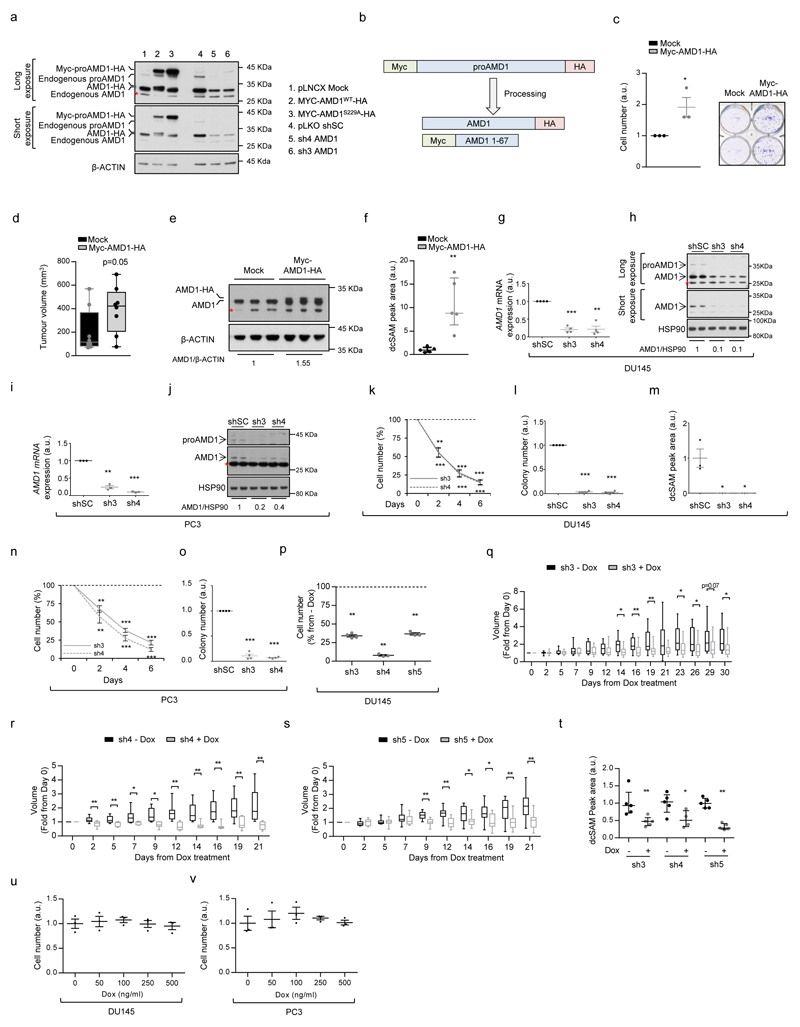
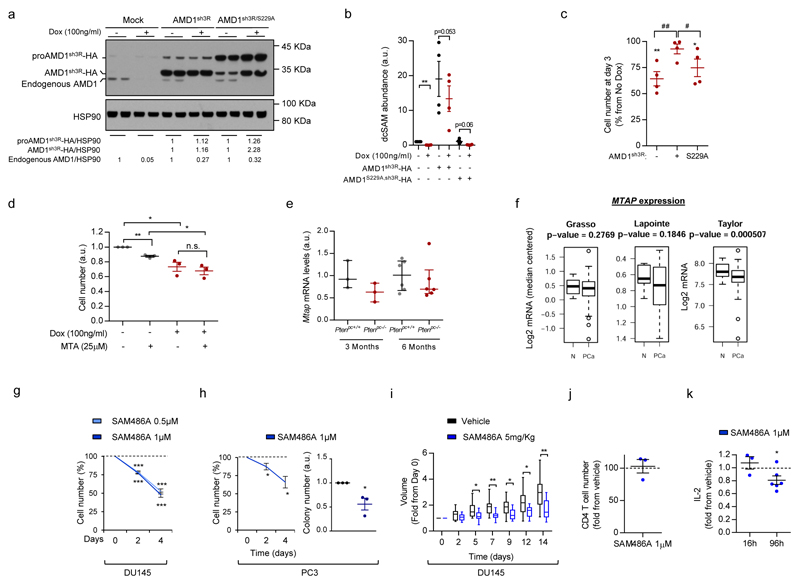
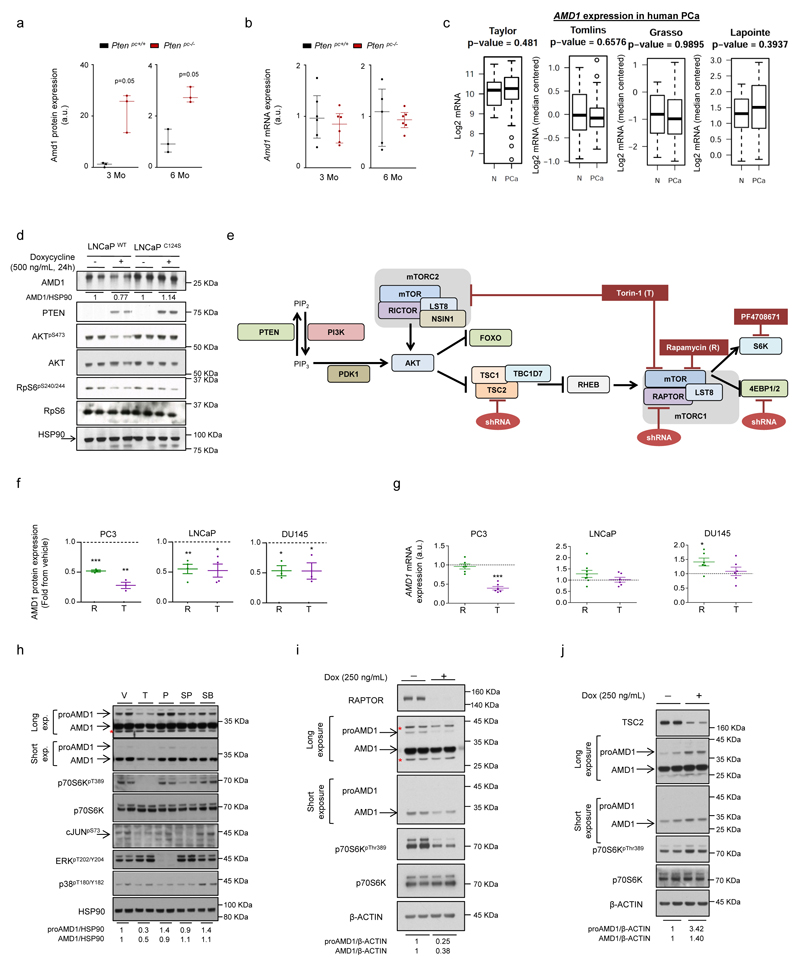
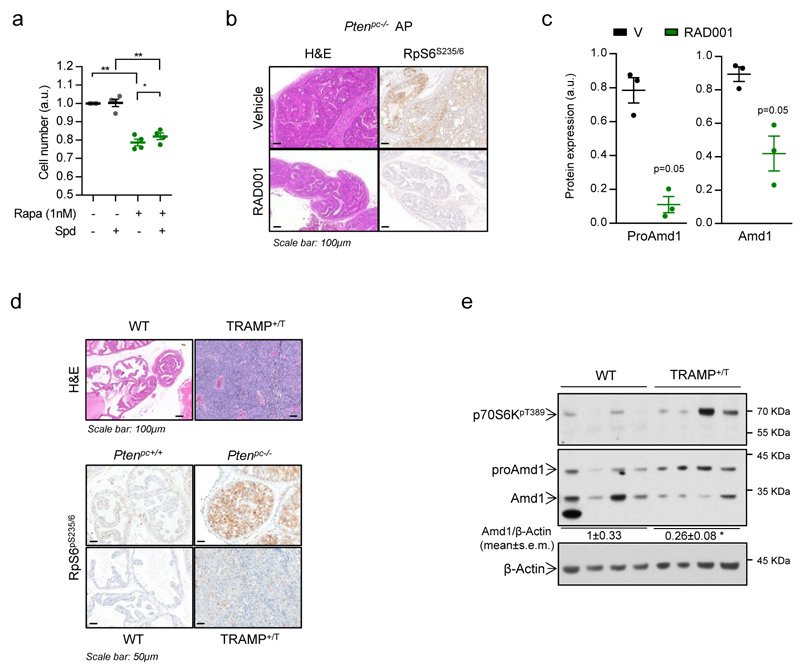
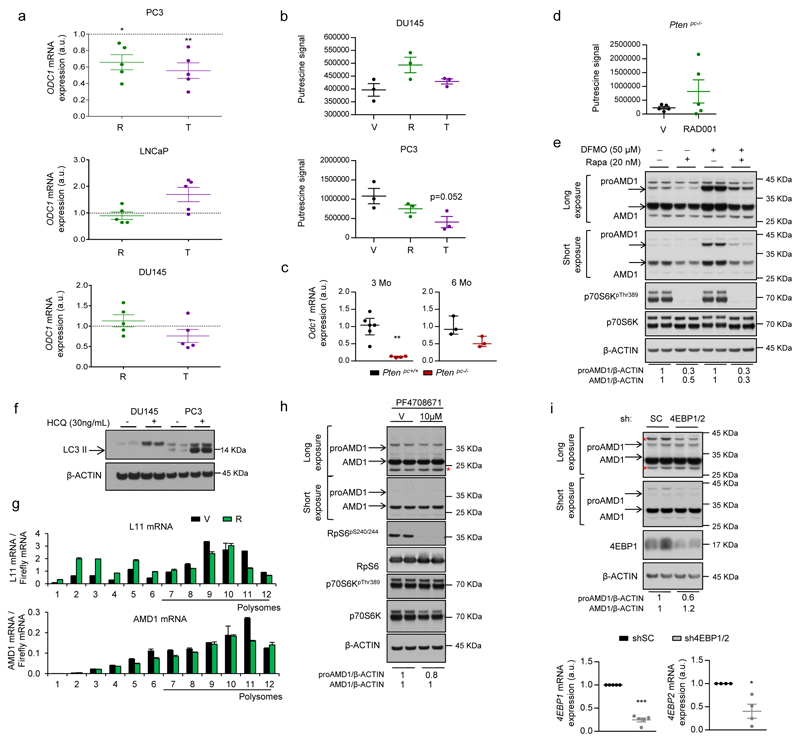
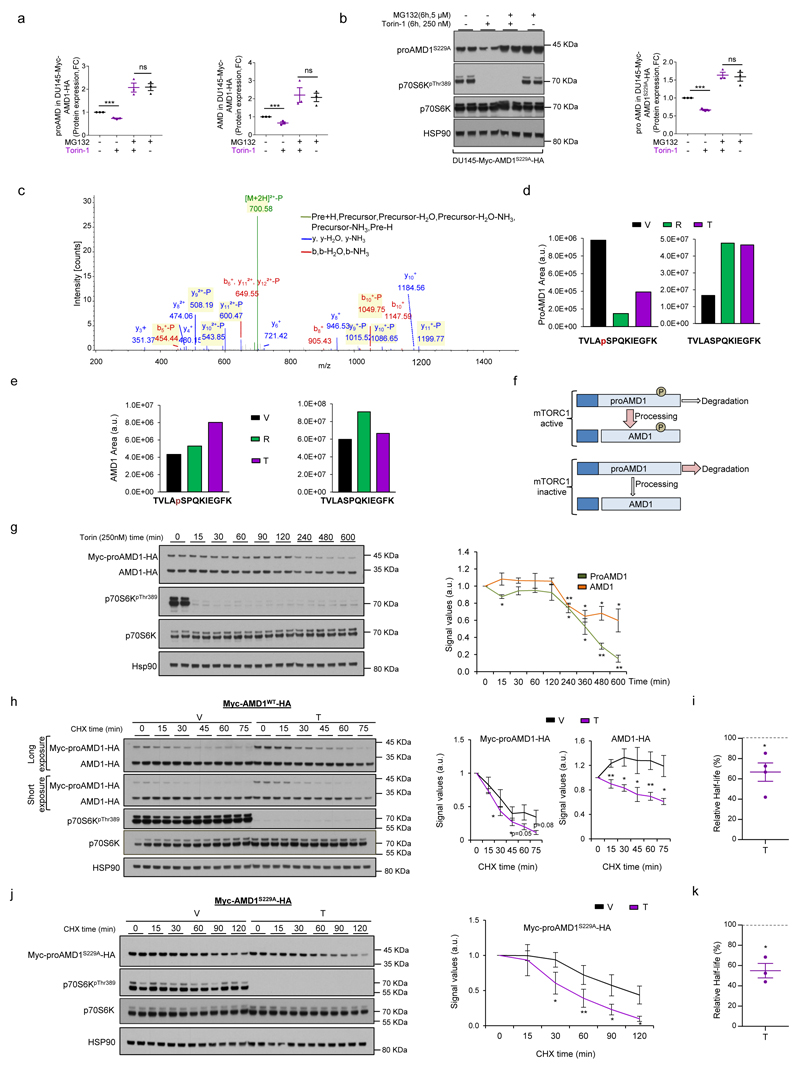
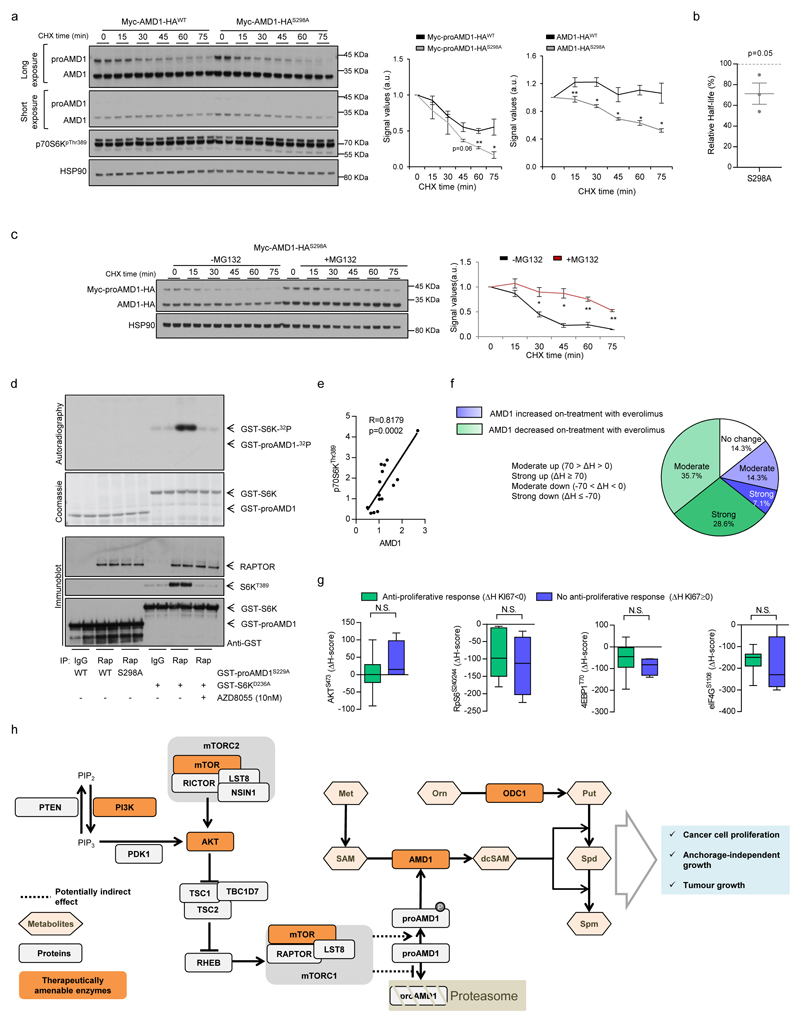
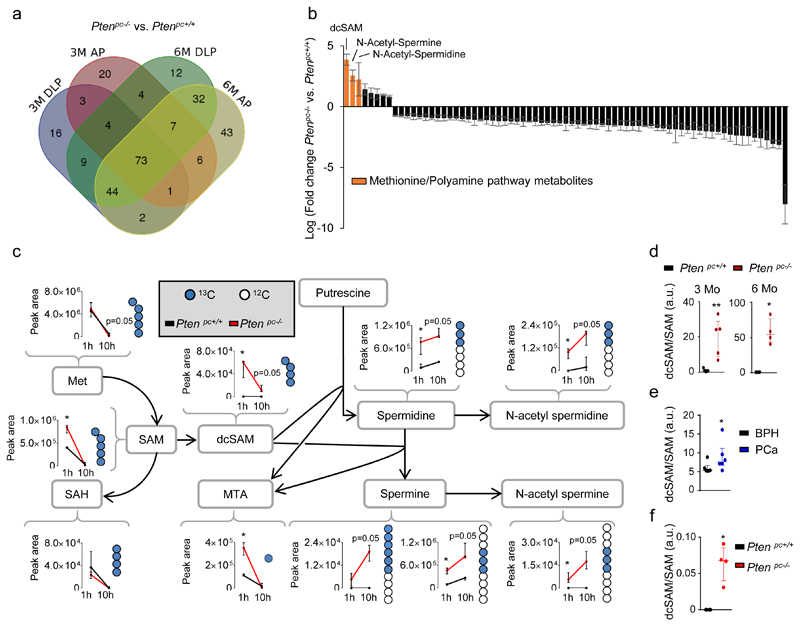
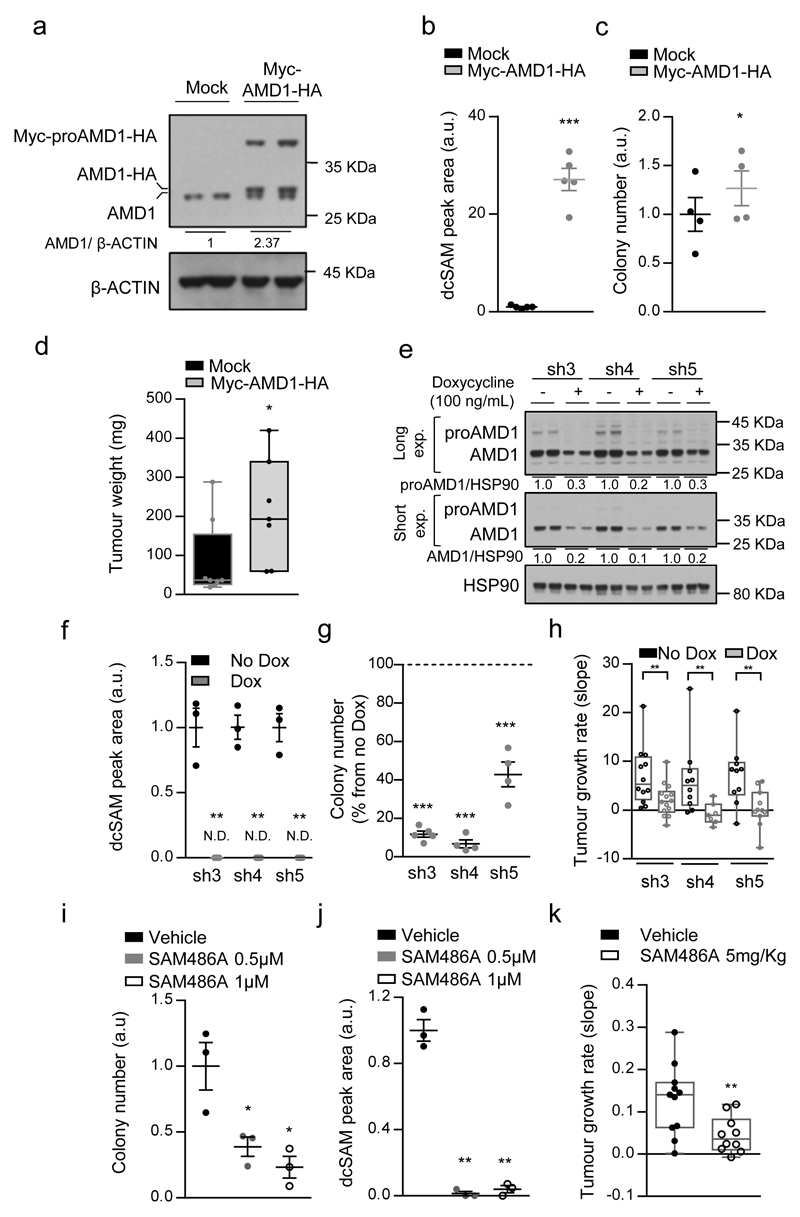
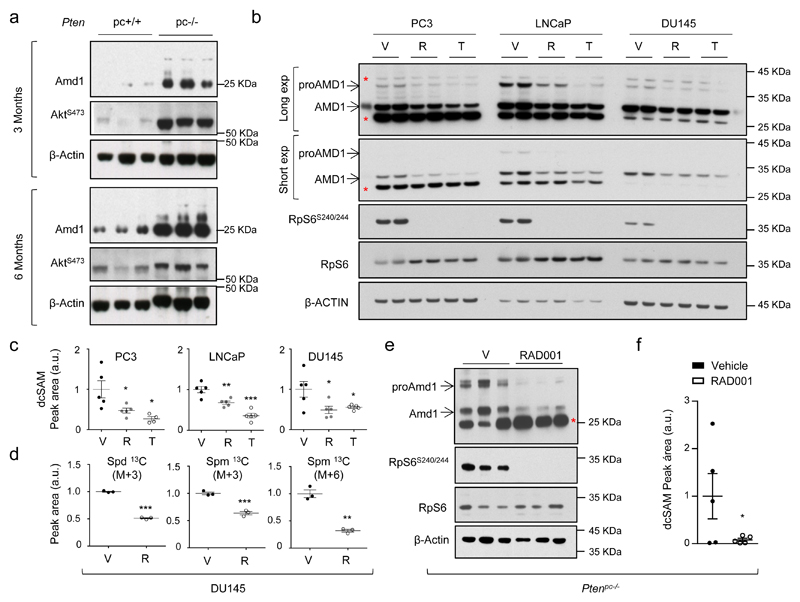
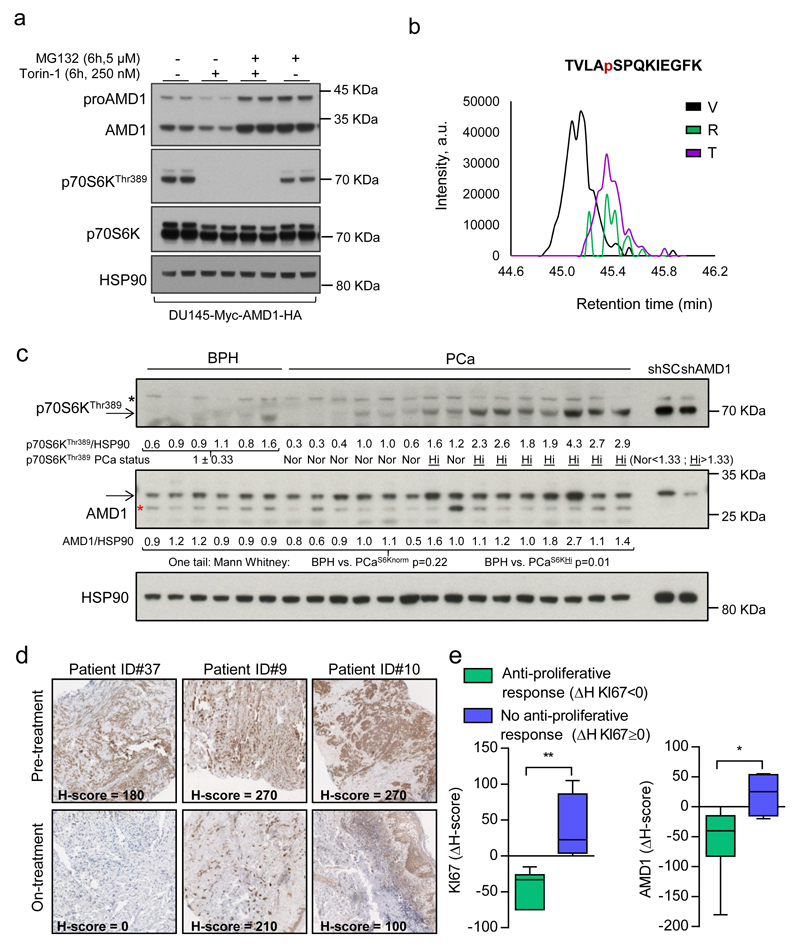
Activation of the PTEN-PI3K-mTORC1 pathway consolidates metabolic programs that sustain cancer cell growth and proliferation. Here we show that mechanistic target of rapamycin complex 1 (mTORC1) regulates polyamine dynamics, a metabolic route that is essential for oncogenicity. By using integrative metabolomics in a mouse model and human biopsies of prostate cancer, we identify alterations in tumours affecting the production of decarboxylated S-adenosylmethionine (dcSAM) and polyamine synthesis. Mechanistically, this metabolic rewiring stems from mTORC1-dependent regulation of S-adenosylmethionine decarboxylase 1 (AMD1) stability. This novel molecular regulation is validated in mouse and human cancer specimens. AMD1 is upregulated in human prostate cancer with activated mTORC1. Conversely, samples from a clinical trial with the mTORC1 inhibitor everolimus exhibit a predominant decrease in AMD1 immunoreactivity that is associated with a decrease in proliferation, in line with the requirement of dcSAM production for oncogenicity. These findings provide fundamental information about the complex regulatory landscape controlled by mTORC1 to integrate and translate growth signals into an oncogenic metabolic program.


Conflict of interest statement

The authors declare no competing financial interest

Figures

Extended data Figure 1
Extended data Figure 1. Metabolomics characterization of murine and human prostate cancer.
a, Incidence of pathological alterations observed in Ptenpc+/+ and Ptenpc-/- mice. Number of mice as indicated. b, Representative immunohistochemical images of prostate tissue stained with Haematoxylin-Eosin (H&E), Pten, AktS473 and RpS6S235/6 from mice at three and six months of age (representative from 3 mice per condition). c, Experimental design of the Time-of-flight mass spectrometry (TOF-MS) metabolomics analysis. AP, anterior prostate; DLP, dorsolateral prostate. d-e, Volcano plot (d) and principal component analysis (PCA, e) from altered metabolites in TOF-MS metabolomic analysis carried out in Ptenpc-/- and Ptenpc+/+ mouse prostate samples at the indicated age (6 months Ptenpc+/+ AP n=4 mice; rest of conditions n=5 mice). Grey dots: not significantly altered; red dots: significantly increased in Ptenpc-/- prostate extracts; blue dots: significantly decreased in Ptenpc-/- prostate extracts. f, Liquid chromatography/mass spectrometry (LC/MS) analysis of methionine cycle and polyamine pathway metabolites from Ptenpc-/- vs. Ptenpc+/+ mouse prostate samples at the indicated age (AP, 3 months n=5 mice; 6 months n=4 mice). Data are represented as median with interquartile range. g, LC/MS analysis of methionine cycle and polyamine pathway metabolites from PCa vs. BPH human specimens (6 prostate specimens per condition). Data are represented as median with interquartile range. p, p-value; *, p<0.05; **, p<0.01; ***; PIN: Prostatic Intraepithelial Neoplasia; LG-PIN: Low Grade PIN; HG-PIN: High Grade PIN; Focal Adc: Focal adenocarcinoma; BPH, benign prostate hyperplasia; PCa: Prostate Cancer; dcSAM: decarboxylated S-adenosylmethionine; SAM: S-adenosylmethionine; SAH: S-adenosylhomocysteine; MTA: 5´ Methylthioadenosine. Statistical analysis: One tail Mann-Whitney U test (f, g) was used for data analysis.
Extended data Figure 2
Extended data Figure 2. Metabolic tracing of 13C-Methionine in Pten-prostate specific knockout mice.
a, Plasma liquid chromatography/mass spectrometry (LC/MS) analysis of the indicated metabolite concentration after intravenous injection of U-13C5-L-Methionine (100mg/Kg) in C57BL/6 mice at 3 months of age (Time 0 min n=7 mice; Time 10 min/60 min n=6 mice). The unlabelled (M+0, 12C) and major labelled (13C, M+4 or M+5) metabolite concentration is presented in the histogram. Error values depict s.e.m. b, Experimental design of the U-13C5-L-Methionine (100mg/Kg) in vivo. c, Summary schematic of the alterations observed in the metabolomic analysis in Ptenpc-/-. d, Fractional labeling of the indicated metabolites from Fig. 1e. Values are represented as median with interquartile range (1 hour –upper panel - n=4; 10 hour – lower panel - n=3). p, p-value; Spm: Spermine; dcSAM: decarboxylated S-Adenosylmethionine; Spd: Spermidine; Met: Methionine; SAM: S-Adenosylmethionine; SAH: S-Adenosylhomocysteine; MTA: 5´ Methylthioadenosine; ODC1: Ornithine Decarboxylase 1; SpdS: Spermidine Synthase; SpmS: Spermine Synthase; U-13C5-Met: L-Methionine labeled with13C in five carbons; 1h: prostate samples extracted after 1h pulse with U-13C5-L-Methionine; 10h: prostate samples extracted after 10 hour pulse with U-13C5-L-Methionine; FC: fold change; a.u.: arbitrary units.One tail Mann-Whitney U test (d) was used for data analysis.
Extended data Figure 3
Extended data Figure 3. Genetic modulation of AMD1 in prostate cancer cells.
a, Technical setup of anti-AMD1 antibody using the indicated constructs or shRNAs in DU145 cells. AMD1S229A mutant lacks processing ability and is expressed exclusively as a pro-enzyme (representative western blot out of 3 independent experiments). b, Schematic representation of tagged ectopic AMD1 processing. c, Impact of ectopic Myc-AMD1-HA expression on foci number in DU145 cells in vitro (n=3 independent experiments). d-f, Impact of ectopic Myc-AMD1-HA expression on tumour volume (d, n=8 tumours per condition), AMD1 protein levels (e, n=3 tumours per condition) and dcSAM abundance (f, n=5 tumours per condition) in DU145 xenografts grown for 43 days. Data in d is represented as box and whisker plot. Panel f shows a dot plot with the median and the interquartile range. g-o, Effect of constitutive silencing of AMD1 (g, i, mRNA levels in g-i and protein expression in h-j) on cell number (k, n), anchorage-independent growth (l, o) and dcSAM abundance (m) with two different hairpins in DU145 (g, h, k, l, m) and PC3 (i, j, n, o) cells (n=3-4 independent experiments as indicated by dots). Values are represented as mean with s.e.m. p, Effect of doxycycline-inducible (100 ng/mL) AMD1 silencing on cell number in DU145 cells (sh3 n=3; sh4-5 n=4 independent experiments as indicated by dots). q-s, Impact of AMD1 inducible silencing in tumor volume from DU145 xenografts (Tumours analysed: sh3 No Dox, n=12; sh3 Dox, n=14; sh4 No Dox, n=10; sh4 Dox, n=7; sh5 No Dox, n=10; sh5 Dox, n=11). Values are represented as box and whisker plot. t, Impact of AMD1 inducible silencing in dcSAM abundance in DU145 xenografts from panels q-s (n=5 tumours). Values are represented as median with interquartile range. u-v, Dose-dependent effect of doxycycline on cell number in DU145 (u) and PC3 (v) cells (cell number measured at day 6) (n=3 independent experiments as indicated by dots). shSC: scramble short hairpin; sh3 and sh4: two different short-hairpins targeting AMD1; dox: doxycycline; p, p-value; *, p<0.05; **, p<0.01; ***, p<0.001. Red asterisk in western blot indicates non-specific band. Dashed line indicates cell number in shC-transduced cells. Statistic test: one tail T-test (c, g, i, k-p, u-v), and one-tail Mann Whitney U test (d, f, q-t).
Extended data Figure 4
Extended data Figure 4. Genetic and pharmacological manipulation of AMD1 in prostate cancer cells.
a-c, DU145 cells carrying doxycycline-inducible shRNA against AMD1 (sh3) were transduced with empty (Mock), sh3-resistant wildtype (AMD1sh3R) or processing-deficient (AMD1S229A,sh3R) AMD1 constructs. AMD1 protein (a, representative experiment out of 4), dcSAM abundance (b) and cell number expression (c) in the aforementioned cells (n=4 independent experiments as indicated by dots). Asterisks indicate significant differences compared to the corresponding DU145 cells in the absence of doxycycline, and hash indicates significant differences in the indicated comparison. Values are represented as mean with s.e.m. d, Effect of 5´ Methylthioadenosine (MTA, 25 µM) on AMD1 silencing (sh3)-elicited antiproliferative activity. MTA was administered at day 0 and cells were analyzed at day 3 (n=3 independent experiments as indicated by dots). e, Mtap gene expression levels in Ptenpc+/+and Ptenpc-/- mice at the indicated time points (see Extended data Fig. 1a) (3 months n=3 mice; 6 months n=6 mice). Values are represented as median with interquartile range. f, MTAP gene expression analysis in publicly available datasets (see methods; N: Normal, PCa: Prostate cancer; Number of patients analised: Taylor et al., Normal n=29, PCa n=150; Grasso et al., Normal n=12, PCa n=76; Lapointe et al., Normal n=9, PCa n=17). g-h, Effect of pharmacological AMD1 inhibition with SAM486A on cell number (g and left h panels ; DU145 n=5; PC3 n=4 independent experiments as indicated by dots), and anchorage-independent growth (righ h panel, n=3 independent experiments as indicated by dots) in PC3 or DU145 cells as indicated. Data is represented as mean with s.e.m. i, Effect of pharmacological AMD1 inhibition with SAM486A in established DU145 xenograft tumor volume (Vehicle n=11 tumours, SAM486A n=10 tumours). Values are represented as box and whisker plot. j-k, Effect of pharmacological AMD1 inhibition with SAM486A in activated T CD4 cell number (96h, j, n=3 independent experiments as indicated by dots) or IL-2 production (k, n=3-6 independent experiments as indicated by dots). a.u.: arbitrary units, Dox: doxycycline,p, p-value; */#, p<0.05; **/##, p<0.01; ***, p<0.001. Dashed line indicates cell number (g, h) or IL-2 abundance (k) in vehicle-treated cells. Statistic test:Student T-test (b, c, d, f,g, h, j, k) and one tail Mann Whitney test (e, i).
Extended data Figure 5
Extended data Figure 5. PTEN-PI3K-mTORC1-dependent regulation of AMD1 in prostate cancer.
a-b, Amd1 protein quantification from Fig. 3a (a, n=3 mice) and mRNA expression (b, n=5-6 mice as indicated by dots) in Ptenpc-/- and Ptenpc+/+ mice of the indicated age. Data are represented as median with interquartile range. c, AMD1 gene expression analysis in publicly available datasets (see methods; N: Normal, PCa: Prostate cancer; Number of patients analysed: Taylor et al., Normal n=29, PCa n=150; Grasso et al., Normal n=12, PCa n=76; Lapointe et al., Normal n=9, PCa n=17). d, Representative western blot showing the expression of the indicated proteins upon doxycycline-inducible expression (24h) of YFP-PTENWT or catallitically inactive YFP-PTENC124S in PTEN-deficient LNCaP prostate cancer cells (n=3 independent experiments). e, Schematic representation of the PI3K signaling pathway and the pharmacological/genetic tools employed in this study. f, ProAMD1 and AMD1 protein quantification from Fig. 3b (sample number as indicated by dots). g, AMD1 gene expression upon treatment (24h) with vehicle (V, DMSO), Rapamycin (R, 20nM) and Torin-1 (T, 250nM for PC3 and DU145, 125nM for LNCaP) (LNCaP n=8 for T; R and n=6 for PC3 and DU145 n=6 independent experiments as indicated by dots). Values are represented as mean with s.e.m. h, Representative western blot analysis of AMD1 levels upon 24-hour treatment of DU145 cells with vehicle (V), Torin-1 (mTORC1/2 inhibitor, T; 250 nM), PD032901 (ERK-MAPK inhibitor, PD; 100 nM), SP600125 (JNK-SAPK inhibitor, SP; 10 µM) and SB203580 (p38-MAPK inhibitor, SB; 5 µM) (n=3 independent experiments). i, Impact of inducible RAPTOR silencing in DU145 cells on proAMD1 protein levels (doxycycline-induced, 250 ng/mL) (Representative experiment out of n=6). j, Impact of inducible TSC2 silencing in DU145 cells on proAMD1 protein levels (doxycycline-induced, 250 ng/mL) (Representative experiment out of n=6). a.u.: arbitrary units, Dox: doxycycline, N: Normal, PCa: Prostate cancer; p, p-value; *, p<0.05; **, p<0.01; ***, p<0.001. Red asterisk in western blot indicates non-specific band. Arrows indicate specific immunoreactive bands. Statistic test: Student T-test (c, f, g) and Mann Whitney test (a, b).
Extended data Figure 6
Extended data Figure 6. mTORC1-dependent AMD1 regulation in vivo.
a, Effect of spermidine (Spd, 0.75 µM) on PC3 cell number upon rapamycin treatment (1 nM, outcome measured 72h after treatment). Drugs were administered at day 0 and only Spd was additionally administered at day 1 (n=4 independent experiments as indicated by dots). b,Effect of RAD001 treatment on prostate pathological features and mTORC1 activity (Haematoxylin-Eosin - H&E - and RpS6S235/6 staining by IHC) (n=3 mice). c, ProAmd1 and Amd1 protein abundance quantification from Fig. 3e (right panel; number of mice as indicated by dots). d, Representative immunohistochemical images of prostate tissue from wildtype or TRAMP mice (+/T, 28-32 weeks old) stained with H&E (top panels) and RpS6S235/6 (lower panels, Ptenpc+/+ and Ptenpc-/- prostate tissues are presented as comparison of the RpS6 phosphorylation levels) (n=3 mice). e, Evaluation of AMD1 expression by western blot in prostate tissues from wildtype or TRAMP mice (+/T, 28-32 weeks old) (n=4 mice). a.u.: arbitrary units, p, p-value; *, p<0.05; **, p<0.01. Arrows indicate specific immunoreactive bands. Statistic test: Student T-test (a) and Mann Whitney test (c, e).
Extended data Figure 7
Extended data Figure 7. Contribution of mTORC1 effector pathways and targets on the regulation of AMD1.
a, ODC1 gene expression upon treatment (24h) of Vehicle (V, DMSO), Rapamycin (R, 20 nM) and Torin-1 (T, 250 nM for PC3 and DU145, 125 nM for LNCaP) in PC3, LNCaP and DU145 cells (n=5 independent experiments as indicated by dots).Values are represented as mean with s.e.m. b, Putrescine abundance upon treatment (24h) of Vehicle (V, DMSO), Rapamycin (R, 20 nM) and Torin-1 (T, 250 nM) in DU145 and PC3 cells (n=3 independent experiments as indicated by dots). Values are represented as mean with s.e.m. c, Odc1 gene expression in 3-month and 6-month old Ptenpc+/+ and Ptenpc-/- mice (n=3-6 as indicated by dots). Values are represented as median with interquartile range. d, Putrescine abundance in 12 week-old Ptenpc-/- mice upon treatment with vehicle (V) or RAD001 (10 mg/kg, 6-days per week) for four weeks (n=5 mice). Values are represented as mean with s.e.m. e, Representative western blot (n=3 independent experiments) depicting the changes in expression of the indicated proteins upon 24 hour treatment of DU145 cells with Rapamycin (R, 20 nM) and/or DFMO (an inhibitor of ODC1, 50 µM) with the corresponding vehicles. f, Representative westenblot showing LC3 lipidation in Hydroxycloroquine (HCQ)-treated (6h) DU145 and PC3 cells, as a readout of macro-autophagy (n=3 independent experiments). Arrow indicates LC3-II. g, For the analysis of translation initiation, polysome profiling analysis of AMD1 and L11 as positive control in DU145 cells treated with vehicle or Rapamycin (20 nM, 8h) is shown. Error bars depicts standard deviation from technical replicates. h, Effect of pharmacological p70S6K inhibition with PF4708671 (10 µM) in DU145 cells on AMD1 protein expression (Representative experiment out of 5). i, Effect of 4EBP1/2 silencing on proAMD1 and AMD1 protein expression (upper panel) (Representative experiment out of 3). Lower panels show 4EBP1 (n=5 independent experiments) and 4EBP2 (n=4 independent experiments) gene expression in shRNA-transduced DU145 cells. a.u.: arbitrary units; DFMO, Difluoromethylornithine; Rapa, Rapamycin; HCQ, Hydroxychloroquine; p, p-value; *, p<0.05; **, p<0.01; ***, p<0.001. Red asterisk in western blot indicates non-specific band. Arrows indicate specific immunoreactive bands. Statistic test: Student T-test (a, b, i) and Mann Whitney U test (c, d).
Extended data Figure 8
Extended data Figure 8. Regulation of proAMD1 stability by mTORC1.
a, ProAmd1 (left) and Amd1 (right) protein abundance quantification from Fig. 4a (n=3 independent experiments as indicated by dots). b, Representative western blot of DU145 cells expressing Ser-229-Ala (S229A) mutant Myc-AMD1-HA treated with vehicle or Torin-1 (250 nM, 6h) in the presence or absence of MG132 (5 µM, 6h) (n=3 independent experiments). Quantification is provided in right panel. c, Representative MS/MS spectrum of the TVLASPQKIEGFK peptide in proAMD1 and AMD1, in which phosphorylation was unambiguously assigned to S298 residue. d, Calculated areas under the curves from extracted ion chromatogram (XIC) of the TVLASPQKIEGFK peptide for phosphorylated (highlighted in red in the sequence, left panel) and total (right panel) proAMD1. e, Calculated areas under the curves from extracted ion chromatogram (XIC) of the TVLASPQKIEGFK peptide for phosphorylated (highlighted in red in the sequence, middle panel) and total (right panel) AMD1. f, Schematic representation of the working hypothesis of proAMD1 regulation by mTORC1-dependent phosphorylation. g, Effect of Torin (250 nM) on proAMD1 and AMD1 protein at different time points in Myc-AMD1-HA-expressing DU145 cells (representative western blot out of 3 independent experiments, right panel presents the densitometric quantification). Error bars depict s.e.m. h-i, Representative western blot depicting the stability of ectopic proAMD1 and AMD1 in DU145 cells challenged with vehicle (V) or Torin-1 (T, 250 nM, 2h) upon CHX treatment (densitometry of proAMD1 and AMD1 levels is represented in right panels, h) and half-life reduction in proAMD1 (i) (n=4 independent experiments). j-k, Representative western blot depicting the stability of S229A mutant AMD1 construct in DU145 cells challenged with vehicle (V) or Torin-1 (T, 250 nM, 2h) upon CHX treatment (densitometry of proAMD1 is represented in right panels, j) and half-life reduction in proAMD1 (k) (n=3 independent experiments). Data are represented as mean with s.e.m. a.u.: arbitrary units; CHX, Cycloheximide; n.s.: not significant p, p-value; *, p<0.05; **, p<0.01; ***, p<0.001. Statistic test: Student T-test.
Extended data Figure 9
Extended data Figure 9. Contribution of proAMD1 phosphorylation downstream mTORC1 to the stability of the enzyme.
a-b, Representative western blot depicting the stability of WT and S298A phospho-mutant AMD1 constructs in DU145 cells upon cycloheximide treatment (densitometry of proAMD1 and AMD1 is represented in right panels, a) and half-life reduction in proAMD1 (b) (n=3 independent experiments). Data are represented as mean with s.e.m. c, Representative western blot depicting the stability of S298A mutant AMD1 construct in DU145 cells challenged with vehicle (V) or MG132 (5 µM) upon CHX treatment (densitometry of proAMD1 is represented in right panel, n=3 independent experiments). Data are represented as mean with s.e.m. d, mTORC1 kinase activity (by means of RAPTOR immunoprecipitation from HEK293 cells) on GST-proAMD1S229A or GST-proAMD1S229A/S298A, using bacteria-purified proteins. GST-p70S6K is presented as positive control. AZD8055 is employed as control of mTORC1 inhibition. e, Correlation analysis between p70S6KThr389 and AMD1 densitometry values in PCa specimens from Fig. 4c (n=15 patient specimens). f, Quantification of AMD1 immunoreactivity in response to everolimus in tumor biopsies, based on the ΔH score (n=14 specimen pairs). g, Box and whisker plot of the immunoreactivity of mTOR downstream effectors (AKTS473, RpS6S240/244, 4EBP1/2T70, eIF4GS1108) in cancer patients with (ΔH score for KI67 < 0; n=6 specimen pairs) or without (ΔH score for KI67 ≥ 0; n=4 specimen pairs) anti-proliferative tumour response upon everolimus treatment. h, Schematic representation of the main findings of this study. Met, methionine; SAM, S-Adenosylmethionine; dcSAM, decarboxylated S-Adenosylmethionine; Orn, ornithine; Put, putrescine; Spd, spermidine; Spm, spermine; AMD1, S-Adenosylmethionine decarboxylase 1; ODC1, ornithine decarboxylase 1; PIP2, Phosphatidyl Inositol biphospate; PIP3, Phosphatidyl Inositol triphospate; a.u.: arbitrary units; ΔH: Differential H-Score (ΔH = H[on treatment] – H[pre-treatment]); p, p-value; CHX, Cycloheximide; *, p<0.05; **, p<0.01; n.s.: not significant. Arrows indicate specific immunoreactive/autoradiographic bands. Statistic test: one tail Student T-test (a, b, c), two-tail Mann Whitney test (g) and Spearman correlation analysis (e).
Figure 1
Figure 1. Integrative metabolomics in prostate cancer reveals a rewiring from methionine metabolism towards polyamine synthesis.
a-b, VENN diagram (anterior prostate - AP - and dorsolateral prostate - DLP, a), and Waterfall plot (b) from the analysis of altered metabolites in TOF-MS metabolomic analysis carried out in Ptenpc-/- and Ptenpc+/+ (6 months Ptenpc+/+ AP n=4 mice; rest of conditions n=5 mice) mouse prostate samples at the indicated age. Values in (b) represent the average of the Log (Fold change) with the s.e.m. of the two lobes and two time points (3 and 6 months of age) per metabolite. c, Incorporation of 13C from intravenously injected U-13C5-L-Methionine (100 mg/Kg) into the indicated metabolites at 3 months of age (AP). Peak area refers to natural abundance-corrected values (n=4 mice at 1 hour; n=3 mice at 10 hours). Data are represented as median with interquartile range. Blue dots: 13C; white dots: 12C; 1h: prostate samples extracted after 1-hour pulse with U-13C5-Methionine; 10h: prostate samples extracted after 10-hour pulse with U-13C5-Methionine. d, dcSAM/SAM ratios from Extended data Fig. 1f (n=4 as indicated by dots). e, dcSAM/SAM ratio from Extended data Fig. 1g (n=6 as indicated by dots). f, dcSAM/SAM ratio from Fig. 1c at 1 hour (n=4 as indicated by dots). a.u.: arbitrary units; 3M/6M: 3 Months / 6 Months; dcSAM: decarboxylated S-Adenosylmethionine; MTA: 5´ methylthioadenosine; SAM: S-Adenosylmethionine; SAH: S-Adenosylhomocysteine; Met: methionine; p, p-value; *, p<0.05; **, p<0.01. One tail (c-f) Mann-Whitney U test was used for data analysis.
Figure 2
Figure 2. Genetic and pharmacological AMD1 modulation affects prostate cancer oncogenicity.
a-c, Impact of ectopic Myc-AMD1-HA expression (a, representative from 3 independent experiments) on dcSAM abundance (b, n=5 independent experiments) and anchorage-independent growth (c, n=4 independent experiments) in DU145 cells in vitro. Data are represented as mean with s.e.m. d, Impact of ectopic Myc-AMD1-HA expression on tumor weight in DU145 xenografts grown for 43 days (Mock n=8 tumours; Myc-AMD1-HA n=7 tumours). Data in is represented as box and whisker plot. e-g, Effect of doxycycline-inducible (100 ng/mL) AMD1 silencing (sh3-5) on AMD1 protein expression (e, representative from 3 independent experiments), dcSAM abundance (f, n=3 independent experiments) and anchorage-independent growth (g, n=4 independent experiments) in DU145 cells. Dash line indicates relative cell number of non-induced cells. Data are represented as mean with s.e.m. h, Impact of inducible AMD1 silencing on tumor growth rate of established DU145 xenografts (Tumour number: sh3 No Dox, n=12; sh3 Dox, n=14; sh4 No Dox, n=10; sh4 Dox, n=7; sh5 No Dox, n=10; sh5 Dox, n=11). Growth rate was inferred from the linear regression calculated for the progressive change in tumor volume of each individual tumor during the period depicted in Extended data Fig. 3q-s. Data is represented as box and whisker plot. i-j, Effect of pharmacological AMD1 inhibition with SAM486A on anchorage-independent growth (i, n=3 independent experiments) and dcSAM abundance (j, n=3 independent experiments) in DU145 cells. Dash line indicates relative cell number of vehicle-treated cells. Data is represented as mean with s.e.m. k, Impact of SAM486A treatment for 14 days (5mg/Kg/day, 5 days per week) on tumor growth rate of established DU145 xenografts (Vehicle, n=11 tumours; SAM4856A, n=10 tumours). Growth rate was inferred from the linear regression calculated for the progressive change in tumor volume of each individual tumor during the period depicted in Extended data Fig. 4i. Data is represented as box and whisker plot. a.u.: arbitrary units; dcSAM: decarboxylated S-adenosylmethionine; - Dox: non-induced condition; + Dox: doxycycline-induced (100 ng/mL) condition; Mock: Empty vector; Myc-AMD1-HA: Myc and HA-tagged AMD1 ectopic expression, sh: short hairpin RNA. p, p-value; *, p<0.05; **, p<0.01, ***, p<0.001. Statistic test: one tail Student T-test was used for cell line data analysis (b, c, f, g, i, j) and one tail Mann-Whitney U test for xenografts (d, h, k).
Figure 3
Figure 3. mTORC1 regulates AMD1 expression, dcSAM production and polyamine dynamics.
a, Amd1 protein abundance in Ptenpc-/- and Ptenpc+/+ of the indicated age (n=3 mice). AKTS473 is shown as control of PI3K pathway over-activation. b, Representative western blot (out of 3) depicting the changes in expression of the indicated proteins upon 24 hour treatment of PC3, DU145 and LNCaP cells with vehicle (V, DMSO), rapamycin (R, 20 nM) and Torin-1 (T, 250 nM for PC3 and DU145, 125 nM for LNCaP). c, dcSAM abundance in PC3 (n=4-5 independent experiments as indicated by dots), LNCaP (n=5 independent experiments) and DU145 (n=5 independent experiments), upon 24 hour treatment with vehicle (V, DMSO), rapamycin (R, 20 nM) and Torin-1 (T, 250 nM for PC3 and DU145, 125 nM for LNCaP). Data are represented as mean with s.e.m. d, Incorporation of 13C from U-13C5-L-Methionine (2h pulse) into the indicated metabolites after 30 hour treatment with vehicle (V, DMSO) or rapamycin (R, 20 nM) in DU145 cells (n=3 independent experiments). Data are represented as mean with s.e.m. e-f, Effect of 4-week RAD001 treatment on mTORC1 activity (RpS6S240/4) and Amd1 protein expression (e, n=3 mice), and dcSAM abundance (f, n=5 mice) in prostate tissue extracts from Ptenpc-/- mice. Data in (f) are represented as mean with s.e.m. a.u.: arbitrary units; 3Mo: 3 month-old mouse prostate analysis; 6Mo: 6 month-old prostate analysis; V: Vehicle; dcSAM: decarboxylated S-adenosylmethionine; Spd 13C (M+3): Spermidine labeled in three carbons; Spm 13C (M+3): Spermine labeled in three carbons; Spm 13C (M+6): Spermine labeled in six carbons; p, p-value; *, p<0.05; **, p<0.01; ***, p<0.001. Red asterisk in western blot indicates non-specific band; arrow: specific band. Statistic test: one tail Student T-test (c, d, f) was used.
Figure 4
Figure 4. mTORC1 regulates AMD1 stability and this molecular regulation is recapitulated in vivo.
a, Representative western blot (out of 3) of DU145 cells expressing Myc-AMD1-HA treated with vehicle or Torin-1 (250 nM, 6h) in the presence or absence of MG132 (5 µM, 6h). b, Extracted ion chromatogram (XIC) of the TVLASPQKIEGFK phosphorylated proAMD1 peptide. c, Western blot analysis (individual tissue specimens are presented) of AMD1 and p70S6KThr389 in prostate tissue samples of BPH and PCa. Densitometry values of AMD1 and p70S6KThr389 are provided below the scans (corrected by HSP90 immunoreactivity). p70S6KThr389 PCa status was defined as normal (Nor; PCaS6K Nor) when the densitometry values of the PCa sample were lower than [mean + standard deviation] of the BPH specimens, and high (Hi, PCaS6K Hi) when the densitometry values of the PCa samples were greater than [mean + standard deviation] of the BPH specimens. The statistical analysis related to differential AMD1 immunoreactivity was performed analysing separately PCaS6K Nor (n=7 specimens) and PCaS6K Hi (n=8 specimens) vs. the BPH specimens (n=6 specimens). d, Representative AMD1 immunoreactivity images of three patient specimens before (pre-treatment) or after (on treatment) therapy with everolimus (n=14 specimen pairs). e, Box and whisker plot of the immunoreactivity of KI67 and AMD1 in cancer patients with (ΔH score for KI67 < 0) or without (ΔH score for KI67 ≥ 0) anti-proliferative tumour response upon everolimus treatment. a.u.: arbitrary units; ΔH: Differential H-Score (ΔH=[H score on-therapy] - [H score pre-therapy]); p, p-value; BPH, benign prostate hyperplasia; PCa, prostate cancer; *, p<0.05; **, p<0.01. Arrows indictate specific immunoreactive bands. Red asterisk in western blot indicates non-specific band. Statistic test: Mann Whitney test (c, e).

Comment in

References

    1. Efeyan A, Comb WC, Sabatini DM. Nutrient-sensing mechanisms and pathways. Nature. 2015;517:302–310. doi: 10.1038/nature14190. - DOI - PMC - PubMed
    1. Zoncu R, Efeyan A, Sabatini DM. mTOR: from growth signal integration to cancer, diabetes and ageing. Nat Rev Mol Cell Biol. 2011;12:21–35. doi: 10.1038/nrm3025. - DOI - PMC - PubMed
    1. Chen Z, et al. Crucial role of p53-dependent cellular senescence in suppression of Pten-deficient tumorigenesis. Nature. 2005;436:725–730. doi: 10.1038/nature03918. doi:nature03918 [pii] - DOI - PMC - PubMed
    1. Ugalde-Olano A, et al. Methodological aspects of the molecular and histological study of prostate cancer: focus on PTEN. Methods. 2015;77–78:25–30. doi: 10.1016/j.ymeth.2015.02.005. - DOI - PMC - PubMed
    1. Tabernero J, et al. Dose- and schedule-dependent inhibition of the mammalian target of rapamycin pathway with everolimus: a phase I tumor pharmacodynamic study in patients with advanced solid tumors. J Clin Oncol. 2008;26:1603–1610. doi: 10.1200/JCO.2007.14.5482. - DOI - PubMed

Publication types

MeSH terms