. 2017 Jul 6;547(7661):55-60.
doi: 10.1038/nature22992. Epub 2017 Jun 28.

Recurrent and functional regulatory mutations in breast cancer

Affiliations

Recurrent and functional regulatory mutations in breast cancer

Esther Rheinbay et al. Nature. .

Abstract

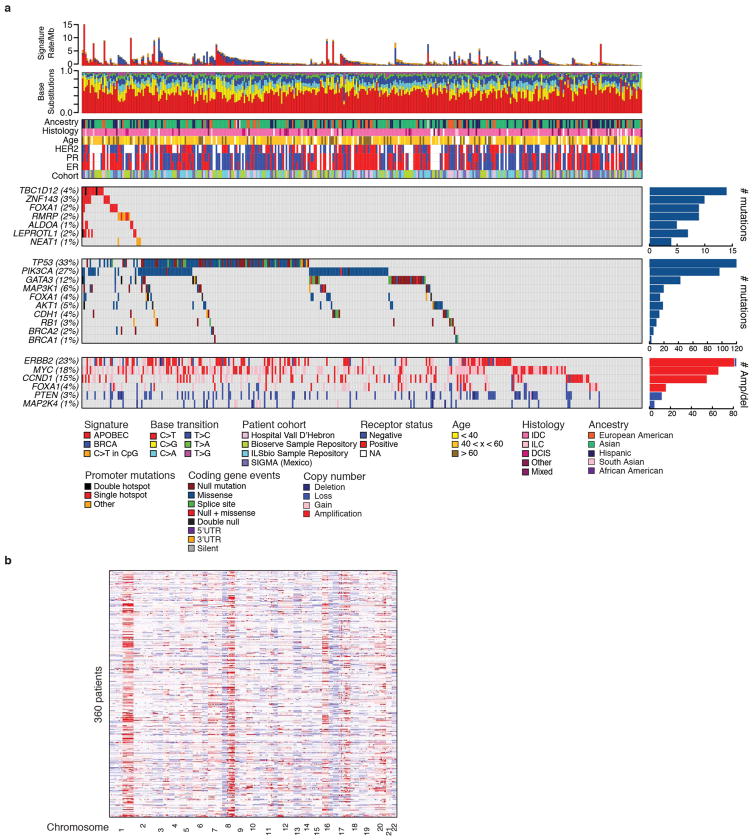
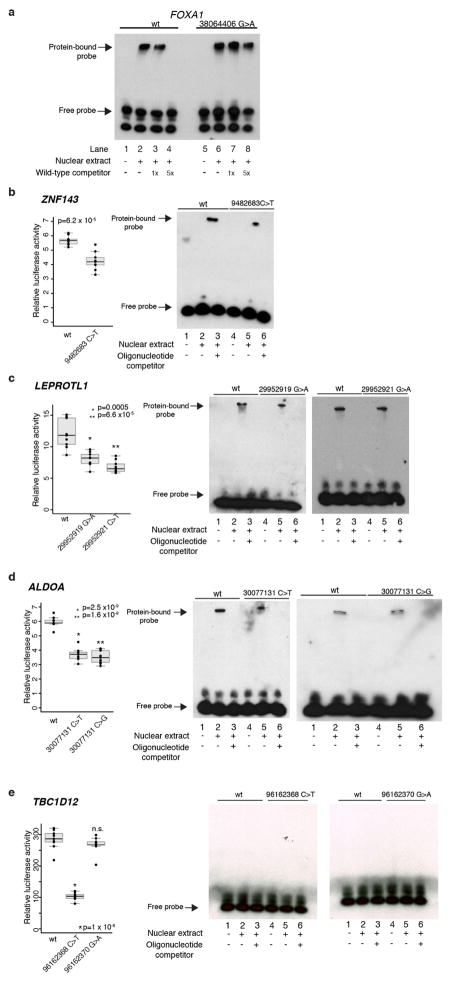
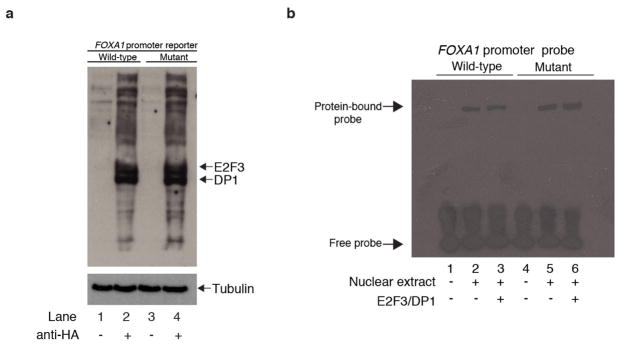
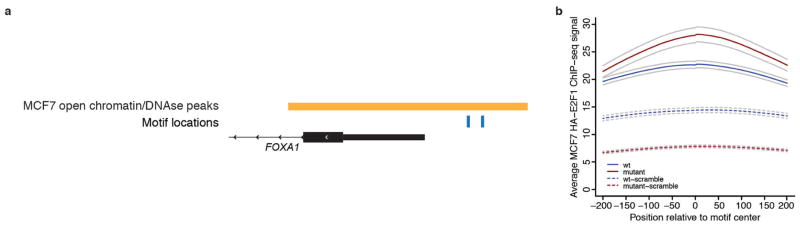
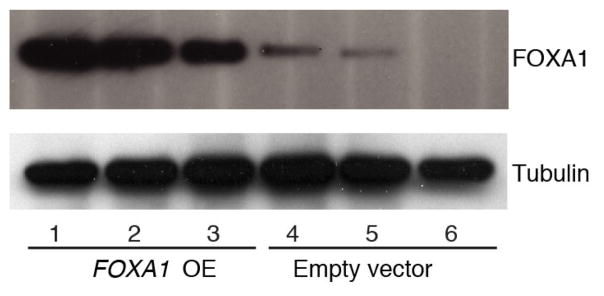
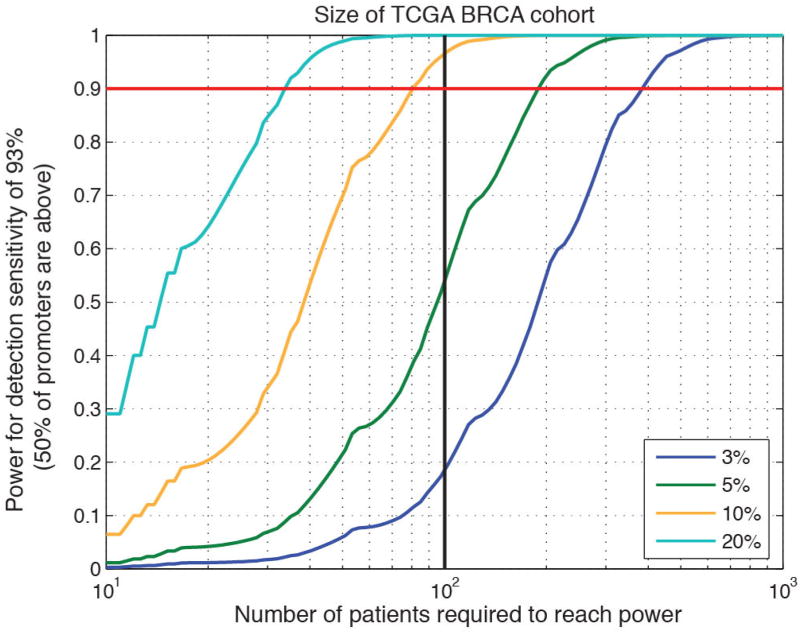
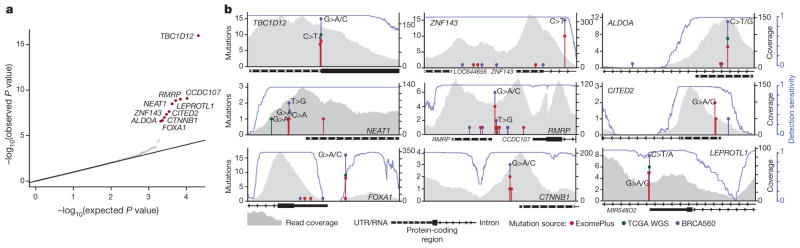
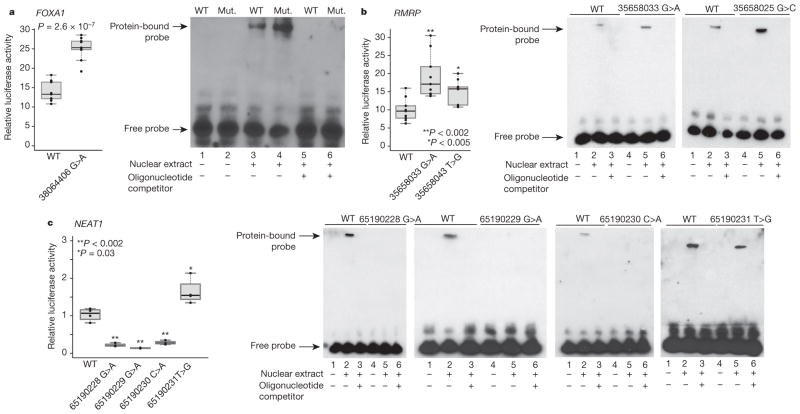
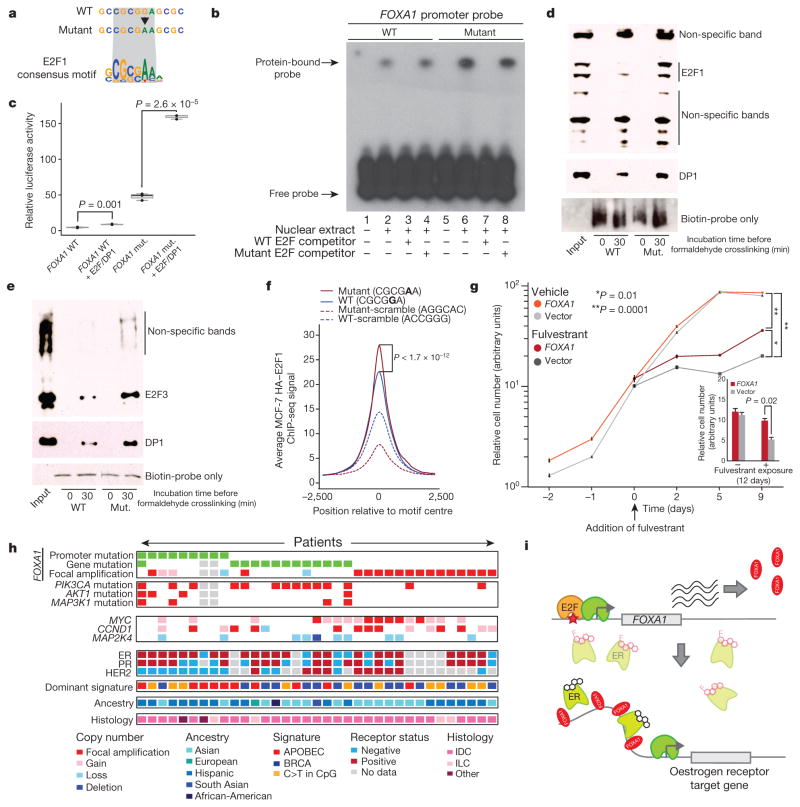
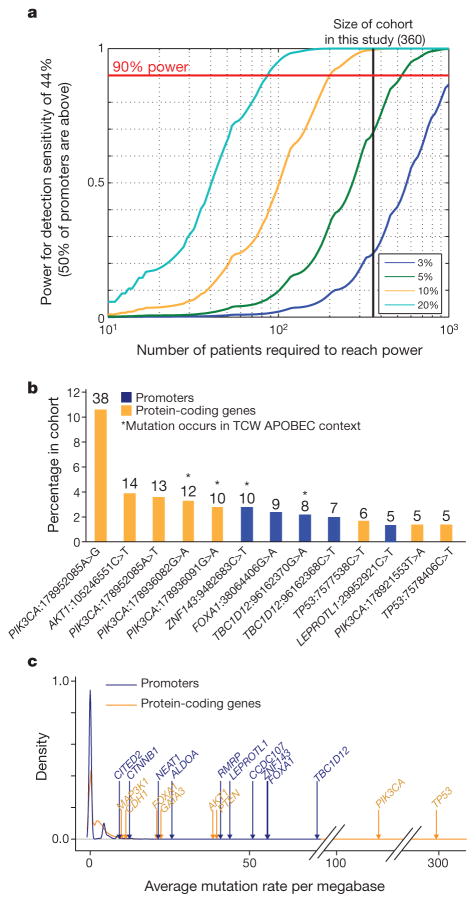
Genomic analysis of tumours has led to the identification of hundreds of cancer genes on the basis of the presence of mutations in protein-coding regions. By contrast, much less is known about cancer-causing mutations in non-coding regions. Here we perform deep sequencing in 360 primary breast cancers and develop computational methods to identify significantly mutated promoters. Clear signals are found in the promoters of three genes. FOXA1, a known driver of hormone-receptor positive breast cancer, harbours a mutational hotspot in its promoter leading to overexpression through increased E2F binding. RMRP and NEAT1, two non-coding RNA genes, carry mutations that affect protein binding to their promoters and alter expression levels. Our study shows that promoter regions harbour recurrent mutations in cancer with functional consequences and that the mutations occur at similar frequencies as in coding regions. Power analyses indicate that more such regions remain to be discovered through deep sequencing of adequately sized cohorts of patients.


Figures

Extended Data Figure 1
Extended Data Figure 1. Patient cohort characteristics
a, Comprehensive overview of coding and non-coding mutations in 360 breast cancer samples assayed on the ExomePlus platform. Samples are ordered on the basis of the promoter mutation events, then by known breast cancer coding drivers. b, Copy number profiles for 360 breast cancers.
Extended Data Figure 2
Extended Data Figure 2. Targeted validation of promoter mutations
a, Targeted sequencing validation of selected promoter mutations in 47 patients from the ExomePlus cohort with Illumina TruSeq Custom Amplicon panel (TSCA)-targeted sequencing technology. b, Validation rate of promoter mutations calculated as validated mutations over all sequenced and powered mutations. c, Median detection sensitivity at mutated sites for significantly mutated promoters. Each point indicates a single mutated position. d, PCR-MiSeq for the FOXA1 promoter locus for 126 patients with sufficient coverage for mutation calling from the original ExomePlus cohort. Three out of four mutations validated in experiment (green and red bars). PCR-MiSeq for 140 patients included but not covered in original ExomePlus experiment and 64 additional tumours yielded three novel mutations in each set (light and dark blue bars). No germline mutations at this site were detected in normal samples.
Extended Data Figure 3
Extended Data Figure 3. Bi-allelic hits for TBC1D12 and LEPROTL1 promoter mutations
a, Sequencing read alignment for tumour BDD-162 shows location of TBC1D12 hotspot mutations on mutually exclusive alleles. b, Location of hotspot mutations near the LEPROTL1 transcription start on mutually exclusive sequencing reads in patient BDD-MEX-BR-116. Reference bases are indicated in grey, mismatched bases in their respective colours (A, green; C, blue; G, orange; T, red). Hotspot mutation sites are outlined with black boxes. Images generated with the Integrative Genomics Viewer.
Extended Data Figure 4
Extended Data Figure 4. Characterization of TBC1D12 mutations
a, TBC1D12 hotspot mutations are present in patients from TCGA (exome sequencing; numbers in parentheses indicate total number of patients). b, Exome hybrid capture alignment confirms mutual exclusivity of TBC1D12 mutations in a patient with bladder cancer (TCGA-C4-ACF1). Image generated with the Integrative Genomics Viewer. c, TBC1D12 genomic locus (hg19) depicting location of promoter region and overlap with MCF-7 breast cancer cell line DNase signal. Red bar indicates native promoter region and TBC1D12 5′ UTR included in the promoter mutation reporter assay construct. Zoomed-in region shows two upstream putative alternative translation start sites (methionine, highlighted in green) potentially giving rise to larger luciferase protein products. Multiple sequence alignment of amino-acid sequence in primates illustrates evolutionary conservation of upstream translation start sites and downstream protein sequence in most species. Image generated with the Integrative Genomics Viewer. d, Western blot of luciferase expressed from TBC1D12 and control reporter assay construct. Note that luciferase expressed from TBC1D12 construct is approximately 80 kDa larger than the control.
Extended Data Figure 5
Extended Data Figure 5. Luciferase reporter assay and EMSA for additional promoter mutations
a, EMSA shows gel shift for FOXA1 WT (lanes 1 and 2) and mutant (lanes 5 and 6) probes when incubated with HEK293T nuclear cell extract. WT FOXA1 competitor competes off protein from WT probes in a concentration-dependent manner (1 and 5 molar excess), but fails to do so for the mutant FOXA1 probe. Luciferase reporter assay and EMSA for WT and mutated probes in ZNF143 (b), LEPROTL1 (c), ALDOA (d), and TBC1D12 (e) show significantly decreased expression activity and a trend for loss of binding in promoter mutants (except for TBC1D12, where there is no binding). Individual data points in reporter assays (black) overlap summary statistic boxplots (grey) with median indicated by black horizontal line. P values calculated with two-sided Student’s t-test. Lanes 1 and 4 in each EMSA show biotinylated probes only. Lanes 2 and 5 show that addition of HEK293T nuclear extract induces a mobility shift of the biotinylated WT and mutant probes, indicating protein binding to the probe. Gel shift is prevented by the addition of excess matched unlabelled probes (lanes 3 and 6). No binding occurs for either WT or mutant probes in the TBC1D12 promoter (e), suggesting that these mutations do not affect transcriptional regulation from DNA.
Extended Data Figure 6
Extended Data Figure 6. Increased binding of E2F/DP1 to the mutant FOXA1 promoter
a, Immunoblot for haemagglutinin (HA)-tagged E2F3 and DP1 shows binding of both proteins in HEK293T cells transfected with either WT or mutant FOXA1 promoter luciferase construct. Immunoblot against tubulin serves as loading control. b, EMSA for HEK239T cells transfected with E2F3/DP1 expression constructs. EMSA was then performed for FOXA1 WT (lanes 1–3) and mutant (lanes 4–6) promoter probes. Ectopic expression of E2F3/DP1 increases nuclear protein binding signal to the mutant promoter compared with WT (compare lane 6 with lane 3), suggesting that increase in binding observed in mutant over WT is at least in part because of increased recruitment of the E2F/DP1 complex.
Extended Data Figure 7
Extended Data Figure 7. IGR analysis
a, Motif instances overlapping open chromatin in MCF-7 cells were considered for analysis (example of FOXA1 is shown). b, E2F1 average ChIP-seq signal from MCF-7 cells at WT, mutant, and control scramble motif locations measured in a 400 bp region surrounding motifs. Grey lines, 95% confidence interval.
Extended Data Figure 8
Extended Data Figure 8. Stable overexpression of FOXA1 in MCF-7 cells
MCF-7 cells stably transfected with FOXA1 show strong FOXA1 overexpression compared with MCF-7 cells transfected with empty vector.
Extended Data Figure 9
Extended Data Figure 9. Discovery power in TCGA data set
Discovery power of TCGA breast cancer whole genomes (100 patients) with median detection sensitivity of 93%. Black vertical line indicates power values for 100 patients. Horizontal red line demarcates 90% power.
Extended Data Figure 10
Extended Data Figure 10. Lack of association between promoter mutation rate in ExomePlus cohort and covariates shown to correlate with mutation rate in coding genes
Each bin represents a covariate quintile, and mutation rates are aggregates over all promoters in each bin. Error bars, s.d. of 1,000 bootstrap simulations. H3K4me1 signal from ENCODE breast luminal epithelial cells.
Figure 1
Figure 1. Identification of significantly mutated promoters
a, Quantile–quantile plot for gene promoter P values. Red dots indicate significantly mutated promoters (Benjamini–Hochberg FDR q <0.1). b, Detailed view of analysed gene loci for significantly mutated promoters including stacked lollipops representing mutations from this study (red), 98 TCGA whole-genome sequencing (WGS) (green), and 560 breast cancer genomes from BRCA560 (ref. , purple). Base changes at mutation sites are indicated above mutation count. Grey profiles indicate read coverage from a representative patient. Blue lines depict mutation detection sensitivity at base-level resolution in each promoter region.
Figure 2
Figure 2. Functional characterization of promoter mutations
Luciferase reporter assays show functional impact of mutations on gene expression. Individual data points (black) overlap summary statistic boxplots (grey) with the median indicated by black horizontal bar. P values calculated with two-sided Student’s t-test. EMSA with WT and mutant (Mut.) promoter oligonucleotides. Reporter assay and EMSA for FOXA1 (a) and RMRP (b) promoter mutations show increase in reporter expression and increased protein binding in mutant versus WT sequences. c, Reporter assay and EMSA for NEAT1 promoter mutations depict decrease in expression and loss of protein binding for three (of four) mutations.
Figure 3
Figure 3. FOXA1 mutations act through E2F and increase tolerance to anti-oestrogen receptor treatment
a, FOXA1 promoter around the hotspot mutation matches consensus motif for E2F1. b, Excess unlabelled E2F-binding, but not non-binding, oligonucleotides abolish the gel shift observed with both WT and mutant FOXA1 probes. c, Reporter assay for FOXA1 WT and mutant (mut.) promoter constructs in HEK293T cells co-transfected with E2F3/DP1. Individual data points (black) overlap boxplots (grey) with the median indicated by black horizontal bar. P value calculated with one-sided Student’s t-test. d, e, Pull-down of nuclear protein extract with biotin-labelled FOXA1 WT and mutant (Mut.) promoter probes followed by immunoblot with E2F1 (d) or E2F3 (e) and DP1 antibody. Input lane contains nuclear protein extract without addition of promoter probes. f, IGR analysis for 6-bp sequences from the FOXA1 promoter and controls. g, MCF-7 breast cancer cells transfected with either empty vector or FOXA1-expression construct were exposed to vehicle or fulvestrant starting on the third day of cell culture (defined as treatment day 0). Inset shows significant difference in cell number after 12 days of exposure compared with control. Error bars, s.e.m. h, Summary of FOXA1 promoter mutations, copy number gains, and coding mutations observed in our patient cohort, and status of different genomic and patient characteristics (only FOXA1-altered cases are shown). Grey cells, missing data. i, Proposed model for mechanism of action of the FOXA1 hotspot promoter mutation. Black molecular structure, oestrogen; pink molecular structure, fulvestrant. Pale oestrogen receptor complexes represent fulvestrant-mediated oestrogen receptor degradation.
Figure 4
Figure 4. Power analysis of ExomePlus patient cohort
a, Discovery power in promoter regions. This study is well-powered (>90%) to discover promoters mutated in 10% and 20% but not 5% of patients. b, Percentage of mutational hotspots in coding genes and promoters in our cohort. The total number of hotspot mutations is indicated above the bars (only sites with at least five mutations are shown). c, Distribution of patient-average functional mutation rates for coding genes and promoters.

Comment in

References

    1. Fredriksson NJ, Ny L, Nilsson JA, Larsson E. Systematic analysis of noncoding somatic mutations and gene expression alterations across 14 tumor types. Nat Genet. 2014;46:1258–1263. - PubMed
    1. Weinhold N, Jacobsen A, Schultz N, Sander C, Lee W. Genome-wide analysis of noncoding regulatory mutations in cancer. Nat Genet. 2014;46:1160–1165. - PMC - PubMed
    1. Araya CL, et al. Identification of significantly mutated regions across cancer types highlights a rich landscape of functional molecular alterations. Nat Genet. 2016;48:117–125. - PMC - PubMed
    1. Melton C, Reuter JA, Spacek DV, Snyder M. Recurrent somatic mutations in regulatory regions of human cancer genomes. Nat Genet. 2015;47:710–716. - PMC - PubMed
    1. Nik-Zainal S, et al. Landscape of somatic mutations in 560 breast cancer whole-genome sequences. Nature. 2016;534:47–54. - PMC - PubMed

Publication types

MeSH terms