. 2017 Jun 28;13(6):e1006839.
doi: 10.1371/journal.pgen.1006839. eCollection 2017 Jun.

One ligand, two regulators and three binding sites: How KDPG controls primary carbon metabolism in Pseudomonas

Affiliations

One ligand, two regulators and three binding sites: How KDPG controls primary carbon metabolism in Pseudomonas

Rosaria Campilongo et al. PLoS Genet. .

Abstract

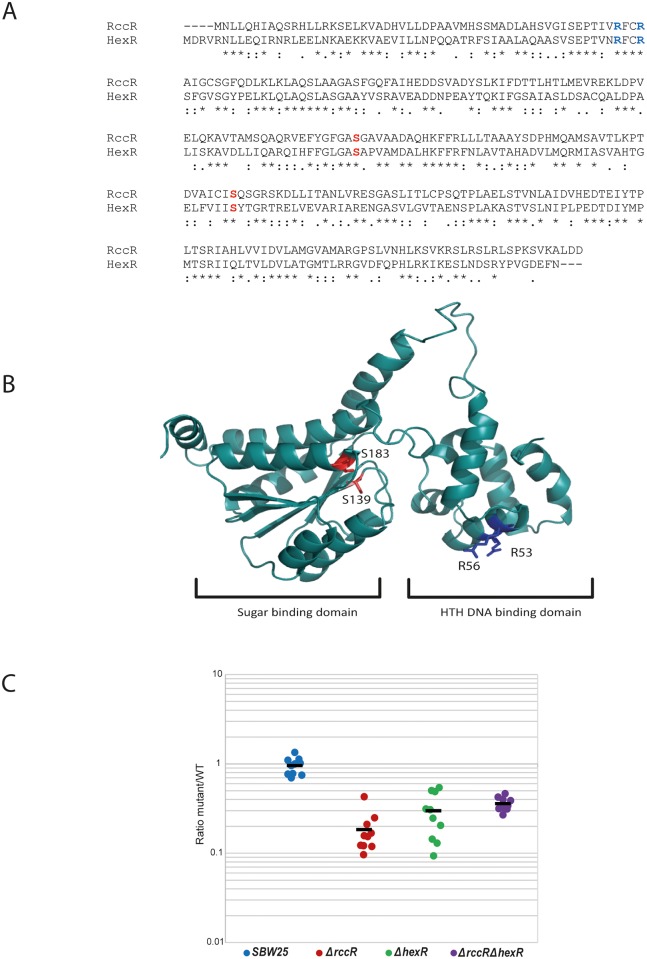
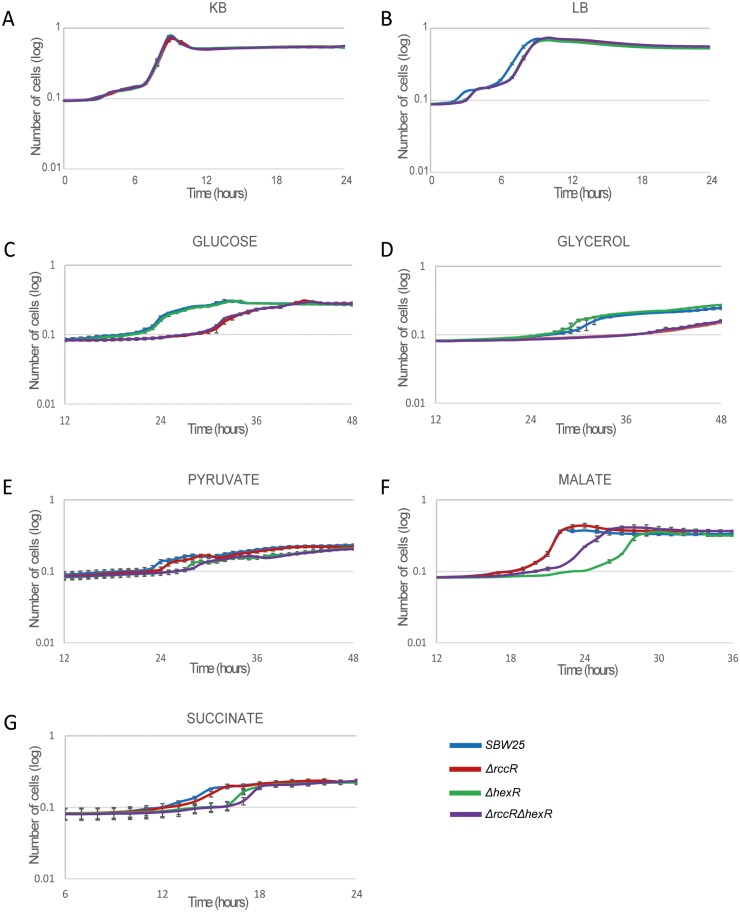
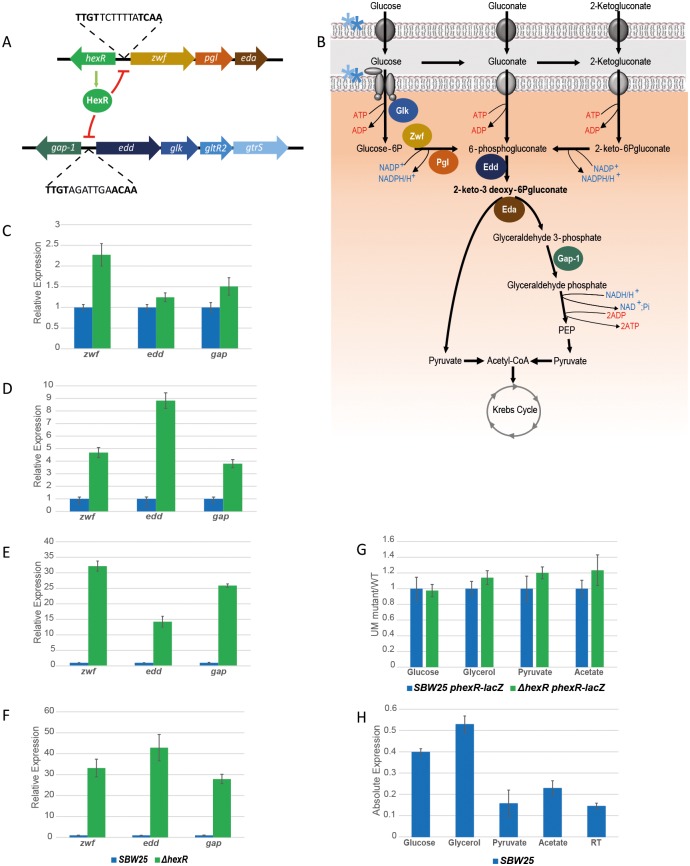
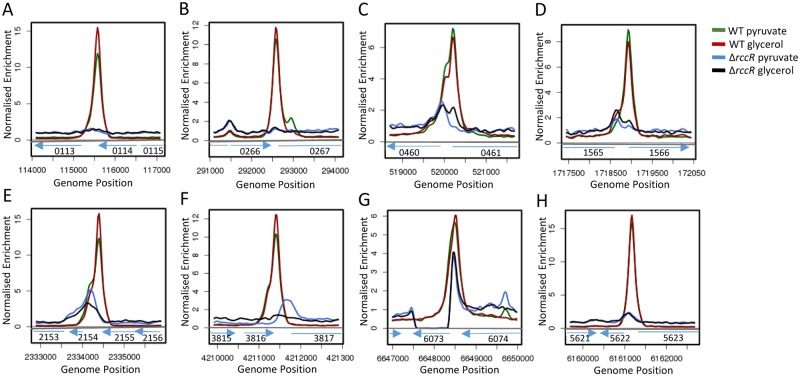
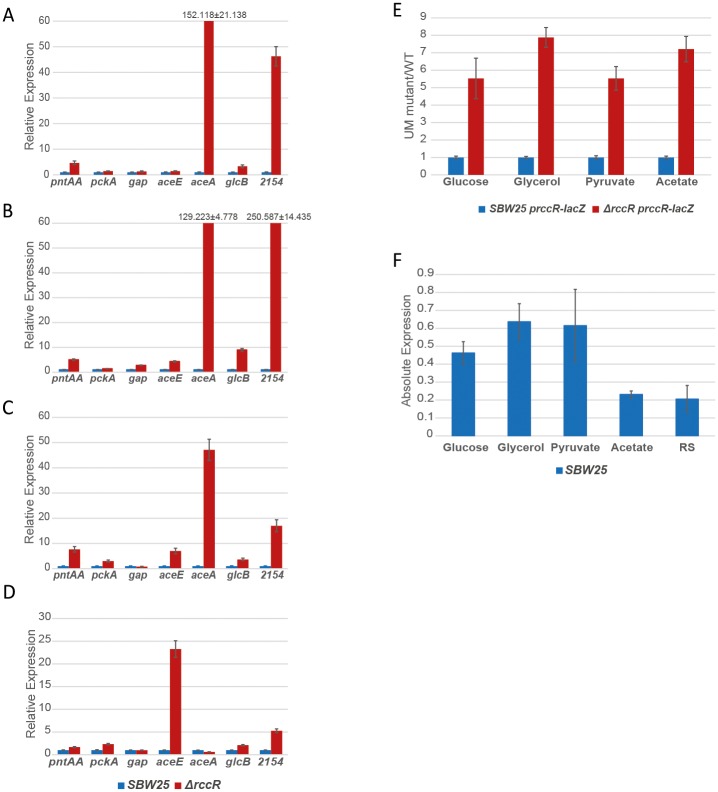
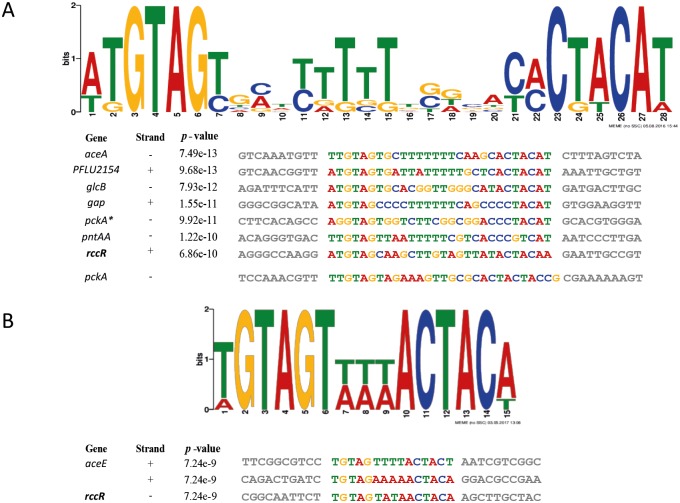
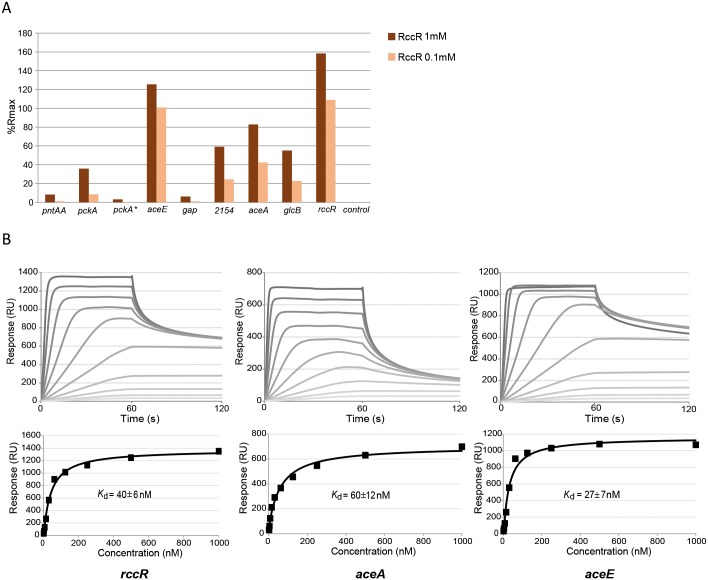
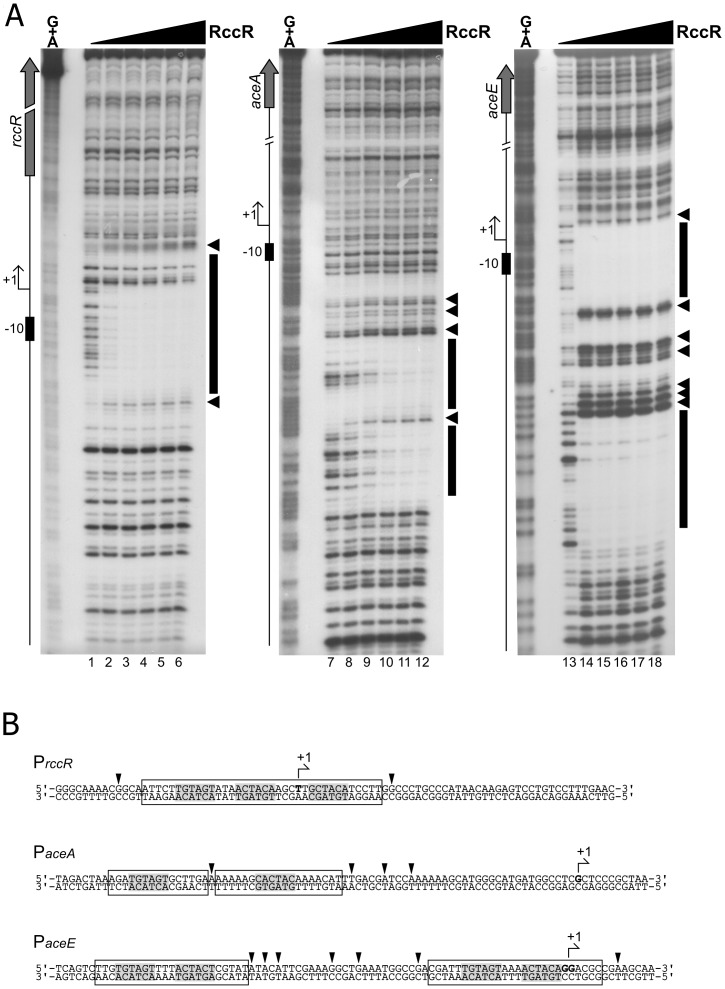
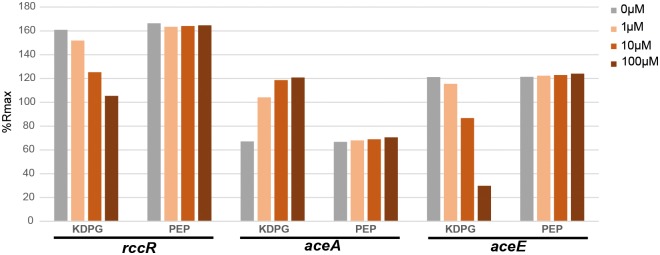
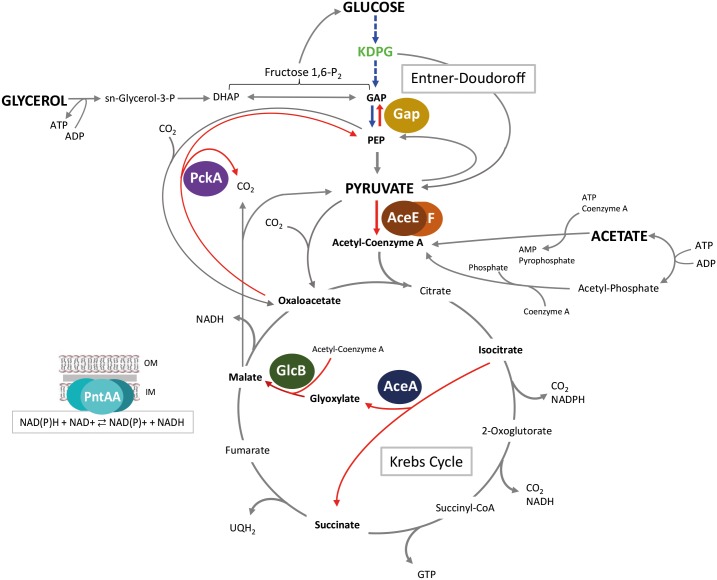
Effective regulation of primary carbon metabolism is critically important for bacteria to successfully adapt to different environments. We have identified an uncharacterised transcriptional regulator; RccR, that controls this process in response to carbon source availability. Disruption of rccR in the plant-associated microbe Pseudomonas fluorescens inhibits growth in defined media, and compromises its ability to colonise the wheat rhizosphere. Structurally, RccR is almost identical to the Entner-Doudoroff (ED) pathway regulator HexR, and both proteins are controlled by the same ED-intermediate; 2-keto-3-deoxy-6-phosphogluconate (KDPG). Despite these similarities, HexR and RccR control entirely different aspects of primary metabolism, with RccR regulating pyruvate metabolism (aceEF), the glyoxylate shunt (aceA, glcB, pntAA) and gluconeogenesis (pckA, gap). RccR displays complex and unusual regulatory behaviour; switching repression between the pyruvate metabolism and glyoxylate shunt/gluconeogenesis loci depending on the available carbon source. This regulatory complexity is enabled by two distinct pseudo-palindromic binding sites, differing only in the length of their linker regions, with KDPG binding increasing affinity for the 28 bp aceA binding site but decreasing affinity for the 15 bp aceE site. Thus, RccR is able to simultaneously suppress and activate gene expression in response to carbon source availability. Together, the RccR and HexR regulators enable the rapid coordination of multiple aspects of primary carbon metabolism, in response to levels of a single key intermediate.


Conflict of interest statement

The authors have declared that no competing interests exist.

Figures

Fig 1
Fig 1. RccR and HexR are highly similar and important for wheat rhizosphere colonisation.
1A: Sequence alignment for rccR and hexR from P. fluorescens SBW25. Important amino acid residues for DNA and ligand interactions are marked in blue and red respectively. 1B: 3D homology model of the RccR protein structure. Arg-53 and -56 (blue) are the predicted DNA interaction partners in the helix-turn-helix domain. Ser-139 and -183 (red) are located in the predicted effector binding site. 1C: Rhizosphere colonisation competition assays. The graph shows the ratio of SBW25 WT or ΔrccR/ΔhexR mutants to WT-lacZ colony forming units (CFU) recovered from the rhizospheres of wheat plants seven days post-inoculation. Each dot represents the ratio of CFUs recovered from an individual plant. In each case, differences between SBW25 and ΔrccR or ΔhexR strains are statistically significant (p < 0.05, Mann-Whitney U test).
Fig 2
Fig 2. Growth curves for SBW25 WT and ΔrccR, ΔhexR, and ΔrccRΔhexR mutants.
2A: Growth was measured in KB and 2B: LB rich media as well as in 2C: M9 0.4% glucose, 2D: M9 0.4% glycerol, 2E: M9 0.4% pyruvate, 2F: M9 0.4% acetate and 2G: M9 0.4% succinate. Marked differences in growth rate were seen between WT and ΔrccR in glucose (C) and glycerol (D), and between WT and ΔhexR mutants in pyruvate (E), acetate (F), and succinate (G). Experiments were repeated at least three times independently and a representative plot is shown in each case.
Fig 3
Fig 3. HexR controls the Entner-Doudoroff pathway in P. fluorescens.
3A: Schematic organisation of the HexR gene targets. HexR binds to a DNA consensus sequence in the intergenic regions between the zwf/pgl/eda operon and hexR genes, and between the edd/glk/gltR2/gltS operon and the gap-1 gene. HexR negatively regulates expression of these gene targets, but not of itself. 3B: The HexR regulon. HexR gene targets are involved in the glucose phosphorylative and Entner-Doudoroff pathways in P. fluorescens. Glk: glucokinase; Zwf: glucose 6-P dehydrogenase; Pgl: 6-phosphogluconolactonase; Edd: 6-phosphogluconate dehydratase; Gap-1: glyceraldehyde 3-phosphate dehydrogenase; the blue and light blue stars indicate activation of the glucose transport system, which is positively regulated by the transcriptional regulators GltR2 and GltS. 3C: zwf, edd, and gap gene expression in glucose, 3D: in glycerol, 3E: in pyruvate and 3F: in acetate in the hexR mutant background relative to WT (qRT-PCR data). 3G: hexR promoter activity in SBW25 ΔhexR relative to WT, determined by β-gal assays tested in glucose, glycerol, pyruvate and acetate conditions. 3H: SBW25 hexR gene expression determined by qRT-PCR after media exchange and 30 min growth in glucose, pyruvate or Root Solution (RS; media without carbon sources, used as a negative control).
Fig 4
Fig 4. Mapped reads from the RccR ChIP-seq experiment.
4A-H: Locations of genes and operons of interest are shown below each peak. Blue arrows indicate the direction of gene transcription and PFLU gene numbers are indicated in each case. Relative scales are indicated for each panel as well as the gene position in the SBW25 genome. Green and red peaks denote the SBW25 WT datasets, while blue and black show data for the ΔrccR mutant strain. Green and black lines indicate bacterial growth in glycerol, while red and blue indicate bacterial growth in pyruvate.
Fig 5
Fig 5. RccR controls expression of pyruvate metabolism, gluconeogenesis and the glyoxylate shunt.
5A-C: RccR gene target expression determined by qRT-PCR. Data are shown for SBW25 ΔrccR relative to WT in 5A: glucose media, 5B: glycerol media, 5C: pyruvate media, and 5D: acetate media. 5E: rccR promoter activity determined by β-gal assay in glucose, glycerol, pyruvate and acetate media conditions. Data are shown for the SBW25 ΔrccR background relative to WT. 5F: SBW25 rccR gene expression determined by qRT-PCR after media exchange and 30 min growth in glucose, glycerol, pyruvate, acetate or Root Solution (RS; media without carbon sources, used as a negative control).
Fig 6
Fig 6. RccR has two related, pseudo-palindromic binding sequences.
6A: The predicted 28 bp RccR DNA-binding site identified by MEME analysis. This consensus is generated from the sequences identified in each RccR binding region, including the binding site located 292 bp after the pckA start codon (indicated with an *). The relative p- values of each RccR binding sites is indicated alongside the name of the RccR gene target in each case. The manually-identified 29 bp site upstream of pckA is also shown. 6B: The predicted 15 bp RccR DNA-binding site identified by MEME analysis. The sequences found in the upstream regions of aceE and rccR are indicated with the relative p-values of each. The aceE upstream region contains two slightly different RccR binding sites 68 bp apart (TGTAGTTTTACTACT and TGTAGTAAAACTACA), both of which were used to generate the consensus sequence.
Fig 7
Fig 7. RccR binds the DNA consensus binding site of its targets.
7A: SPR experiments measuring the biomolecular interactions between the RccR protein and indicated DNA consensus sequences. Percentage of normalized response (%Rmax) of RccR (1μM and 0.1 μM concentrations) binding the consensus sequences found by MEME and manual sequence analysis alongside a random sequence DNA control. %Rmax indicates the experimental RccR binding values (Response registered from the SPR machine) normalized on the maximal response (Rmax) that can be potentially reached when all ligand binding sites (DNA) are occupied by the analyte (RccR protein). 7B: Sensorgrams (up) and fitting (down) curves showing RccR affinity to aceE, aceA and rccR consensus sequences.
Fig 8
Fig 8. RccR binds the 28bp and the 15bp binding sites.
8A: DNaseI footprinting panel of RccR on rccR, aceA, aceE promoters. Radiolabelled promoter probes were incubated with increasing concentrations of purified RccR-His (0, 10, 20, 40, 80, 160 nM of RccR-His from left to right in each panel) before DNaseI digestion and DNA purification. Recovered DNA fragments were subjected to electrophoretic separation along with a Maxam and Gilbert G+A sequence reaction ladder (leftmost lane of each autoradiograph). On the left of each autoradiograph, a schematic representation of the genomic region is reported, with symbols as follows: block arrow represents the coding sequence, bent arrow represents the transcriptional start site identified in this study (S3 Fig), while black box indicates the -10 promoter element. Protected regions are highlighted by a black box on the right of each autoradiograph, while DNaseI hypersensitive sites are evidenced by black arrowheads. 8B: mapping of the RccR binding sites on the rccR, aceA and aceE promoter regions. Arrowheads denote hypersensitive sites, protected regions are included in open boxes, and conserved pseudopalindromic sequences are highlighted in light grey. Bent arrow indicates the transcriptional start site identified in this study (S3 Fig) and the first transcribed nucleotide is in bold.
Fig 9
Fig 9. Screening for the RccR effector.
9A: Percentage of normalized response (%Rmax) for RccR binding to the rccR, 9B: aceA and 9C: aceE consensus sequences in the presence of KDPG (effector) and PEP (negative control) at different concentrations (1-10-100 μM).
Fig 10
Fig 10. A model for RccR regulation of primary carbon metabolism.
The figure shows a schematic representation of the metabolic pathways of glucose, glycerol, pyruvate and acetate through the Krebs cycle and the glyoxylate shunt. The protein products of the RccR gene targets are shown: PntAA/PFLU0112/B are subunits of the NAD(P) transhydrogenase membrane protein complex; PckA: phosphoenolpyruvate carboxykinase; AceE/F: pyruvate dehydrogenase subunits; Gap: glyceraldehyde-3-phosphate dehydrogenase; AceA: isocitrate lyase; GlcB: malate synthase G. RccR-regulated carbon transitions are marked in red. HexR-regulated carbon transitions are marked in blue.

References

    1. Shimizu K. Metabolic Regulation and Coordination of the Metabolism in Bacteria in Response to a Variety of Growth Conditions. Adv Biochem Eng Biotechnol. 2016;155:1–54. doi: 10.1007/10_2015_320 . - DOI - PubMed
    1. Groisman EA, Mouslim C. Sensing by bacterial regulatory systems in host and non-host environments. Nat Rev Microbiol. 2006;4(9):705–9. doi: 10.1038/nrmicro1478 . - DOI - PubMed
    1. Silby MW, Winstanley C, Godfrey SA, Levy SB, Jackson RW. Pseudomonas genomes: diverse and adaptable. FEMS Microbiol Rev. 2011;35(4):652–80. . - PubMed
    1. Little RH, Grenga L, Saalbach G, Howat AM, Pfeilmeier S, Trampari E, et al. Adaptive Remodeling of the Bacterial Proteome by Specific Ribosomal Modification Regulates Pseudomonas Infection and Niche Colonisation. PLoS Genet. 2016;12(2):e1005837 doi: 10.1371/journal.pgen.1005837 . - DOI - PMC - PubMed
    1. Barahona E, Navazo A, Yousef-Coronado F, Aguirre de Carcer D, Martinez-Granero F, Espinosa-Urgel M, et al. Efficient rhizosphere colonization by Pseudomonas fluorescens f113 mutants unable to form biofilms on abiotic surfaces. Environ Microbiol. 2010;12(12):3185–95. Epub 2010/07/16. doi: 10.1111/j.1462-2920.2010.02291.x . - DOI - PubMed

MeSH terms