

Fragility and Strength in Nanoparticle Glasses
- PMID: 28658568
- PMCID: PMC5530325
- DOI: 10.1021/acsnano.7b01359
Fragility and Strength in Nanoparticle Glasses
Abstract
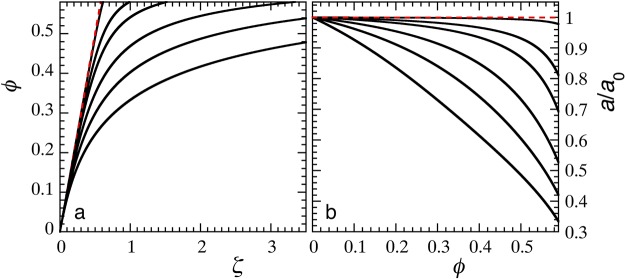
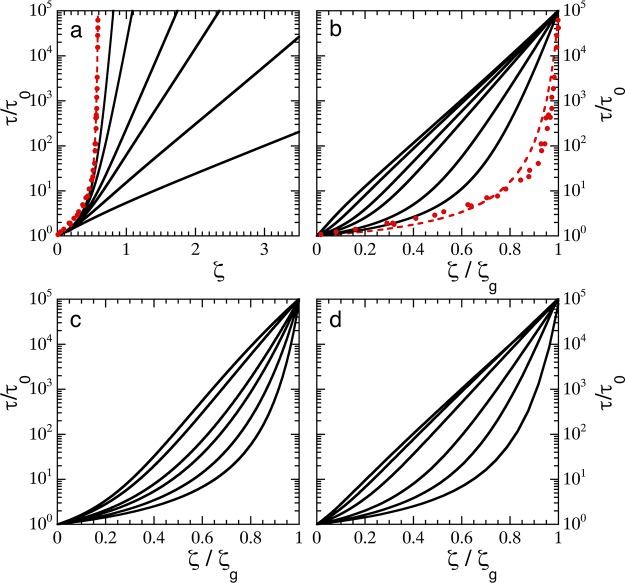
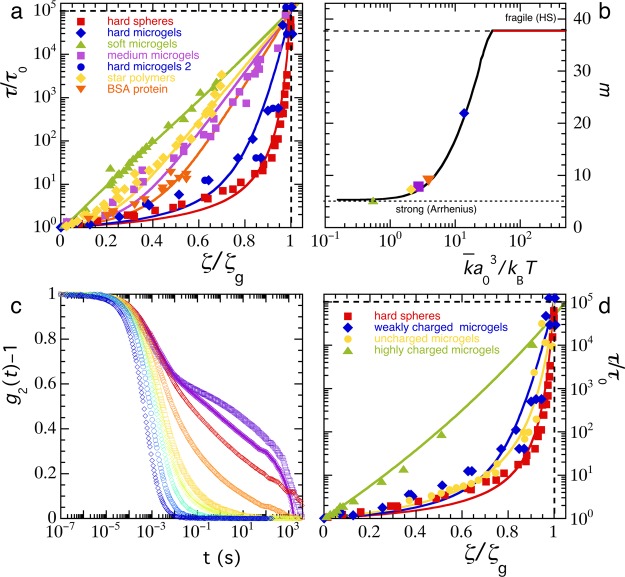
Glasses formed from nano- and microparticles form a fascinating testing ground to explore and understand the origins of vitrification. For atomic and molecular glasses, a wide range of fragilities have been observed; in colloidal systems, these effects can be emulated by adjusting the particle softness. The colloidal glass transition can range from a superexponential, fragile increase in viscosity with increasing density for hard spheres to a strong, Arrhenius-like transition for compressible particles. However, the microscopic origin of fragility and strength remains elusive, both in the colloidal and in the atomic domains. Here, we propose a simple model that explains fragility changes in colloidal glasses by describing the volume regulation of compressible colloids in order to maintain osmotic equilibrium. Our simple model provides a microscopic explanation for fragility, and we show that it can describe experimental data for a variety of soft colloidal systems, ranging from microgels to star polymers and proteins. Our results highlight that the elastic energy per particle acts as an effective fragility order parameter, leading to a universal description of the colloidal glass transition.
Keywords: colloids; fragility; glasses; microgels; nanoparticles.
Conflict of interest statement
The authors declare no competing financial interest.
Figures
Similar articles
-
Apparent strength versus universality in glasses of soft compressible colloids.Sci Rep. 2018 Nov 14;8(1):16817. doi: 10.1038/s41598-018-35187-9. Sci Rep. 2018. PMID: 30429509 Free PMC article.
-
Soft colloids make strong glasses.Nature. 2009 Nov 5;462(7269):83-6. doi: 10.1038/nature08457. Nature. 2009. PMID: 19890327
-
Fragile-to-strong crossover, growing length scales, and dynamic heterogeneity in Wigner glasses.Phys Rev E. 2020 Mar;101(3-1):032605. doi: 10.1103/PhysRevE.101.032605. Phys Rev E. 2020. PMID: 32290023
-
The physics of the colloidal glass transition.Rep Prog Phys. 2012 Jun;75(6):066501. doi: 10.1088/0034-4885/75/6/066501. Epub 2012 May 16. Rep Prog Phys. 2012. PMID: 22790649 Review.
-
Review on the dynamics and micro-structure of pH-responsive nano-colloidal systems.Adv Colloid Interface Sci. 2008 Jan 15;136(1-2):25-44. doi: 10.1016/j.cis.2007.07.002. Epub 2007 Jul 13. Adv Colloid Interface Sci. 2008. PMID: 17707760 Review.
Cited by
-
Resolving the different bulk moduli within individual soft nanogels using small-angle neutron scattering.Sci Adv. 2022 Jul;8(26):eabn6129. doi: 10.1126/sciadv.abn6129. Epub 2022 Jul 1. Sci Adv. 2022. PMID: 35776796 Free PMC article.
-
Deswelling and deformation of microgels in concentrated packings.Sci Rep. 2017 Aug 31;7(1):10223. doi: 10.1038/s41598-017-10788-y. Sci Rep. 2017. PMID: 28860537 Free PMC article.
-
Rheology of Poly(glycidyl methacrylate) Macromolecular Nano Assemblies.Polymers (Basel). 2022 Jan 23;14(3):455. doi: 10.3390/polym14030455. Polymers (Basel). 2022. PMID: 35160445 Free PMC article.
-
A new look at effective interactions between microgel particles.Nat Commun. 2018 Nov 28;9(1):5039. doi: 10.1038/s41467-018-07332-5. Nat Commun. 2018. PMID: 30487527 Free PMC article.
-
Surface Fluctuations Dominate the Slow Glassy Dynamics of Polymer-Grafted Colloid Assemblies.ACS Cent Sci. 2018 Sep 26;4(9):1179-1184. doi: 10.1021/acscentsci.8b00352. Epub 2018 Aug 27. ACS Cent Sci. 2018. PMID: 30276251 Free PMC article.
References
-
- Pusey P. N. In Liquids, Freezing and the Glass Transition; Hansen J. P., Levesque D., Zinn-Justin J., Eds.; Elsevier: Amsterdam, 1991; pp 765–942.
Publication types
LinkOut - more resources
Full Text Sources
Other Literature Sources
