. 2017 Jun 27;19(13):2681-2693.
doi: 10.1016/j.celrep.2017.05.090.

Reliable and Elastic Propagation of Cortical Seizures In Vivo

Affiliations

Reliable and Elastic Propagation of Cortical Seizures In Vivo

Michael Wenzel et al. Cell Rep. .

Abstract

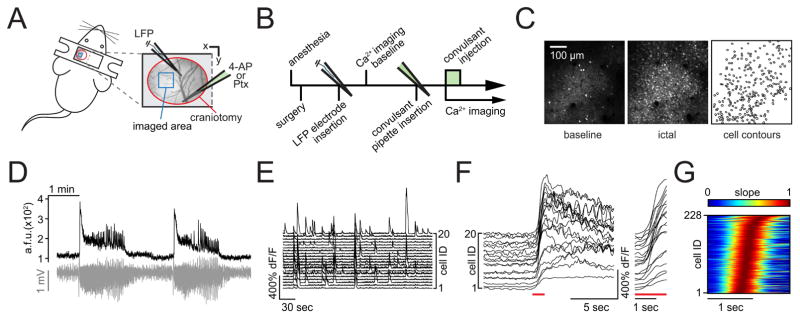
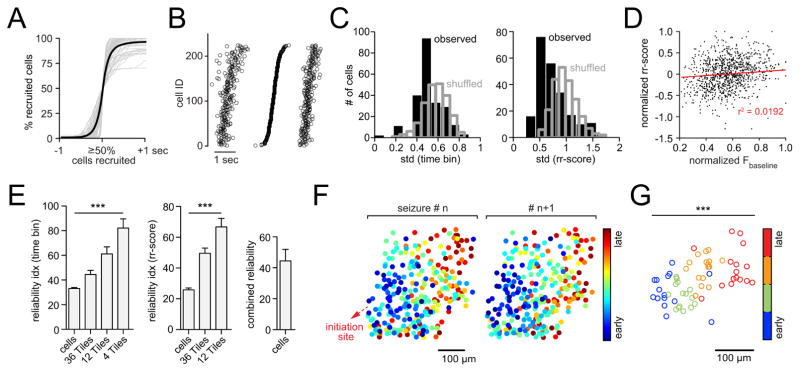
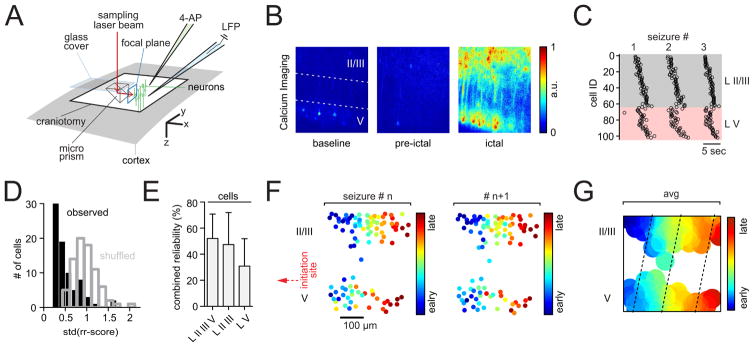
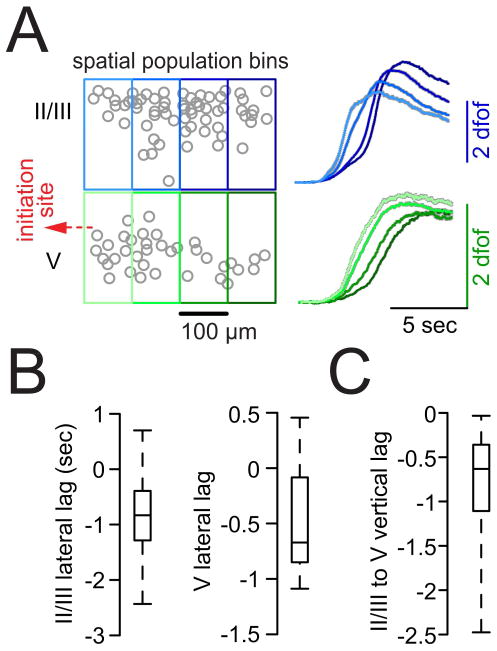
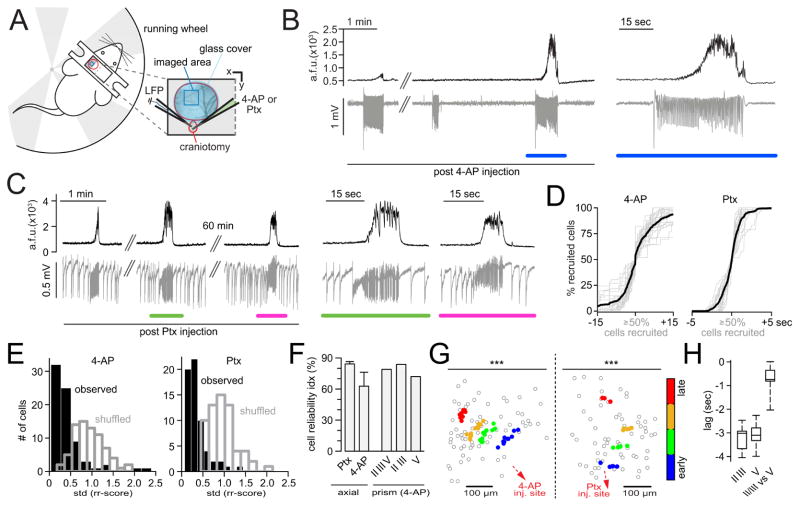
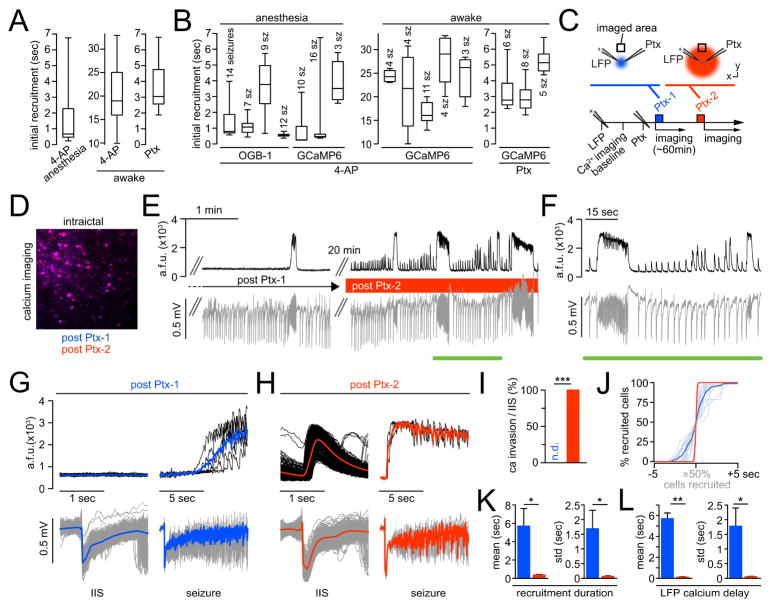
Mapping the fine-scale neural activity that underlies epilepsy is key to identifying potential control targets of this frequently intractable disease. Yet, the detailed in vivo dynamics of seizure progression in cortical microcircuits remain poorly understood. We combine fast (30-Hz) two-photon calcium imaging with local field potential (LFP) recordings to map, cell by cell, the spread of locally induced (4-AP or picrotoxin) seizures in anesthetized and awake mice. Using single-layer and microprism-assisted multilayer imaging in different cortical areas, we uncover reliable recruitment of local neural populations within and across cortical layers, and we find layer-specific temporal delays, suggesting an initial supra-granular invasion followed by deep-layer recruitment during lateral seizure spread. Intriguingly, despite consistent progression pathways, successive seizures show pronounced temporal variability that critically depends on GABAergic inhibition. We propose an epilepsy circuit model resembling an elastic meshwork, wherein ictal progression faithfully follows preexistent pathways but varies flexibly in time, depending on the local inhibitory restraint.

Keywords: 4-AP; GABA; calcium; epilepsy; picrotoxin; seizure; two-photon.


Conflict of interest statement

Conflict of Interest: The authors declare no competing financial interests

Figures

Figure 1
Figure 1. In vivo two-photon calcium imaging of seizure spread with single cell resolution
(A) Experimental setup with surgical approach over left somatosensory cortex; craniotomy encircled in red, imaged field of view (FOV) within the seizure propagation area in blue; each experiment (‘exp.’) involved the insertion of two glass micropipettes, one (blue) containing a silver chloride electrode for LFP (local field potential) recording, the other (green) containing 4-AP (15 mM, injection vol. 500 nl [total amount delivered = 7.5 nmol]) or Ptx (10 mM, injection vol. 500 nl, [total amound delivered = 5 nmol]). (B) Typical experimental workflow. (C) Propagation area in left somatosensory cortex, representative 3 sec average (avg) fluorescence images of neural activity (GCaMP6s) during baseline (left) and full ictal event (middle, see also movie S 1.1); contour plot of registered cells (right). (D) Avg calcium transient of FOV (black trace, GCaMP6s, imaging depth ~150μm beneath the pial surface) and corresponding LFP (gray trace) post 4-AP. (E) Calcium transients of 20 representative cells within FOV during baseline. (F) The same 20 cells post 4-AP, optical seizure break-in (underlined in red) magnified on the right. (G) Representative example of the optical break-in of the ictal wave. Normalized first derivative of ΔF/F. Cell recruitment to ictal activity ordered in time by maximum slope.
Figure 2
Figure 2. Stereotypical micro-progression of seizures
(A) Superposition of all analyzed optical seizure break-ins (gray) centered around the 50% recruitment frame; black graph represents mean temporal recruitment (n = 7 exp., total # of seizures = 71 [11.3 ± 1.358 s.e.m.], total # of cells analyzed = 1402 [201 ± 25 s.e.m.], cell number in % for comparability across exp.). (B) Representative example of 3 consecutive optical seizure break-ins plotted next to each other. The 1st and 3rd event are sorted by the temporal ordering of the 2nd event. Each circle represents an individual cell recruitment time point. (C) Representative exp. with observed (black) versus shuffled (gray) time bin or rr-score standard deviation (std) distributions. (D) Correlogram of cellular baseline fluorescence versus rr-scores. Values are max-normalized for comparability across exp.. The relationship between the two parameters is negligible: 4 exp., 42 seizures, 952 cells. r = 0.1386, r2 = 0.0192. The effect accounts for 1.9% of the variance in the data. (E) Reliability indices displaying the % of cells or spatial sub-regions (tiles) whose temporal recruitment variability (time bin or rr-score std) are < 5 % of all shuffled values of analyzed cells or tiles (p<0.05). Recruitment reliability increased with spatial coarseness (one-way ANOVA, n = 7 exp., total # of cells = 1402, time bin and rr-score classification: p<0.0001). Right: Combined (“reliable” in time bin and/or rr-score classification) cell-wise reliability index. (F) Spatiotemporal maps of cell recruitment in two consecutive seizures indicating grossly preserved relative recruitment. Each dot represents an individual cell. 4-AP injection site (red arrow) is located ~1.5mm posterior to FOV (somatosensory cortex). (G) Same exp., spatial avg coordinates of temporally defined population quartiles (25% earliest recruited cells, 25–50%, 50–75%, 75–100%) across 16 seizures show consistent spatiotemporal propagation (bivariate ANOVA: n=16 seizures, F[3,60] = 11.64, p = 0.000004, all 7 axial exp. under anesthesia p<0.001). Each circle represents the avg coordinate of all cells belonging to the respective quartile.
Figure 3
Figure 3. Stereotypical and seizure propagation across cortical layers
(A) Experimental setup involving cortical microprism implant; brain surface in gray, craniotomy encircled in black, 90° laser beam (red) deflection results in a vertical FOV; neurons in green; again, each exp. involved the insertion of two glass pipettes (LFP [blue], 4-AP [green]). (B) Representative 3 sec avg fluorescence images of multilayer neural activity, recorded under anesthesia in somatosensory cortex during baseline (left, II/III or V = layer II/III or V), directly prior to the seizure break-in (middle), and full ictal event (right, see also movies S3, S4, S5). The injection site of 4-AP was located ~2 mm anterolateral to the prism (in LV), aligned to the edge of the prism face. (C) Representative example of 3 consecutive optical seizure break-ins plotted next to each other, indicating consistent recruitment across cortical layers. Each circle represents an individual cell recruitment time point. (D) Representative exp., observed (black) versus shuffled (blue) rr-score std distribution. (E) Combined reliability index displaying the percentage of cells whose recruitment std are < 5 % of all shuffled std of all analyzed cells (p<0.05, n = 4 exp., total # of seizures = 32 [8 ± 3.6 s.e.m.], total # of cells analyzed = 334 [84 ± 13 s.e.m.]). (F) Spatiotemporal maps of multilayer cell recruitment in two consecutive seizures, indicating preserved cell recruitment. 4-AP injection site (red arrow) is located ~1.5 mm away from FOV. (G) Same exp., avg contour plot of 8 seizures. Note how LII/III appears to be recruited ahead of corresponding LV (dotted lines).
Figure 4
Figure 4. Supragranular layers are systematically recruited ahead of deep layers
(A) Left: Paradigmatic multilayer contour plot (LII/III and LV, circles represent individual cells). Small local cell populations were grouped together in spatial bins (tiles) of 100 μm width to assess lateral delays of adjacent tiles and vertical delays of tiles situated above each other. Right: Population avg calcium transients of individual tiles within LII/III or LV across all seizures in one exp. (right, gray shades represent s.e.m., # of seizures = 11, # of analyzed cells = 102, # of spatial tiles = 8). Note that lateral but also vertical tile delays can be appreciated by eye. (BC) Box plots of lateral (tile[prox]-tile[dist]) or vertical (tile[LII/III]-tile[LV]) recrutiment time lags of adjacent tiles (see also Figure S3 D and SI); boxes represent 25%ile to 75%ile, bands inside boxes display the median recruitment time lag (n = 4 exp., total # of seizures = 32 [8 ± 3.6 s.e.m.]). In nearly all seizures proximal tiles (lateral lag) were recruited prior to their adjacent distal tiles (for lateral lags LII/III and LV: Chi-Square test X2(1) = 12.7, p<0.001); in all seizures LII/III tiles were recruited prior to their corresponding LV tiles (X2(1) = 21.3, p<0.001).
Figure 5
Figure 5. Stereotypical and elastic seizure propagation in awake mice
(A) Adapted experimental setup; craniotomy outlined in red, FOV in dark blue; glass cover slip in light blue. Two inserted glass pipettes (LFP [blue], 4-AP or Ptx [green, 4-AP: 500 nl, total amount delivered = 7.5 nmol; Ptx: 10mM, 500 nl, total amount delivered = 5 nmol]) (B) Avg population calcium transient (black trace, Thy-1::GCaMP6f, LII/III) and corresponding LFP (gray trace) post 4-AP (~2mm posterior to FOV in somatosensory cortex). Blue underscore marks magnified inset on the right (C) Avg population calcium transient (black trace, Thy-1::GCaMP6f, LII/III) and corresponding LFP (gray trace) post Ptx (~1.5mm posterior to FOV in somatosensory cortex). Green and magenta mark magnified insets on the right. Note the stable lack of calcium responses to IIS in the LFP and slow seizure invasion of the FOV post Ptx. (D) Superposition of all axially imaged seizures (gray) in awake mice, post 4-AP or Ptx, centered around the 50% recruitment frame; black graphs represent mean temporal recruitment (4-AP: n = 5 exp., total # of seizures = 26, total # of cells analyzed = 359 [72 ± 8 s.e.m.], Ptx: n = 3 exp., total # of seizures = 19, total # of cells analyzed = 182 [61 ± 1 s.e.m.]); cell number in % for comparability across exp.. (E) Representative exp. (4-AP or Ptx) with observed (black) versus shuffled (gray) rr-score std distributions. Both seizure models show left-ward shifts of the observed versus shuffled data. (F) Cellular reliability indices (rr-score) across seizure models. Ptx (n = 3 exp., axial imaging), 4-AP (n = 5 exp. axial imaging, 1 exp. multilayer imaging). (G) Representative exp. (4-AP or Ptx): spatial avg coordinates of temporally defined population quartiles (colored dots), plotted within the imaged population (gray circles represent individual cells). Left: 4-AP (bivariate ANOVA: n=11 seizures, F[3,40] = 18.44, p = 1×10⁻⁷, all 5 exp. in awake mice with 4-AP p<0.001). Right: Ptx (bivariate ANOVA: n=4 seizures, F[3,12] = 52.87, p = 1.5×10⁻⁸, all 3 exp. in awake mice with Ptx p<0.001) (H) Multilayer imaging. Box plots of lateral or vertical onset time lags of adjacent tiles (please see also Figure S3 D); boxes represent 25%ile to 75%ile, bands inside boxes display the median recruitment time lag (1 exp., 4-AP, total # of seizures = 7).
Figure 6
Figure 6. Elastic recruitment is regulated by local inhibitory neurons
(A) Absolute ictal recruitment durations vary across seizures. Box plots displaying population recruitment durations analyzed for each condition. Left: 4-AP under isoflurane (7 exp., 71 seizures). Middle: 4-AP during wakefulness (5 exp., 26 seizures). Right: Ptx during wakefulness (3 exp., 19 seizures). (B) Ictal recruitment durations vary within individual exp.. Box plots of 15 exp. (7 anesthesia, 8 wakefulness): Boxes represent 25%ile to 75%ile of cellular recruitment, bands inside boxes display median cell recruitment time. (C) Schematic depiction of exp. involving two Ptx injections during wakefulness: LFP and Ptx pipettes are located within the seizure initiation site. After LFP pipette insertion and baseline imaging, the Ptx (10mM) pipette is inserted. The 1st Ptx injection (‘Ptx-1’, blue) is volume controlled, as usual (500 nl, total amount delivered = 5 nmol]), and followed by imaging seizure spread, as described, for ~60min. Then, a 2nd Ptx injection (‘Ptx-2’, red) is performed (pressure controlled, 10 psi, 10min). (D) Merged avg images of ictal FOV post Ptx-1 (blue) and post Ptx-2 (red). Note the complete overlap of the avg images (magenta), that is, the imaged focal plane remains stable beyond Ptx-2. (E) Representative experiment. Left: Post Ptx-1, imaging (black) and LFP recordings (gray) of spreading seizures for >1hr (note: no calcium response to IIS in the LFP). Right: ~20 min post Ptx-2. (F) Magnification of inset in E. Note that post Ptx-2, every IIS in the LFP coincides with a population calcium response within the FOV in the propagation area. (G) Same exp., post Ptx-1. Left: Superimposed 2-sec windows of population calcium activity (top, individual traces in black, mean in blue) centered around 678 IIS recorded by LFP at the distant injection site (bottom, individual events in gray, mean in blue). Right: Superimposed 10-sec windows of 6 seizures recorded by imaging (top, individual seizures in black, mean in blue) and LFP (bottom, individual seizures in gray, mean in blue). Note the delay of several sec between electrographic seizure onset and optical invasion. (H) Same exp., post Ptx-2. Left: Superimposed 2-sec windows of population calcium activity (top, individual traces in black, mean in red) centered around 562 IIS (bottom, individual events in gray, mean in red). Right: Superimposed 10-sec windows of 3 seizures recorded by imaging (top, individual seizures in black, mean in red) and LFP (bottom, individual seizures in gray, mean in red). Note the clear population calcium response to IIS in the LFP and the immediate penetration of the imaged FOV upon electrographic seizure onset. (I) Quantification of optical invasion per IIS (n=4 exp., 1327 IIS post Ptx-1 [n.d. = none detectable], 893 IIS post Ptx-2 [mean invasion rate = 100%], Mann Whitney test: p = 0). (J) Superposition of all optical invasions during electrographic seizures (n=4 exp.; post Ptx-1: 21 seizures, individual events in light blue, mean in dark blue; post Ptx-2: 17 seizures, individual events in light red, mean in dark red) centered around the 50% recruitment frame of the population. Cell number in % for comparability across exp.. Note how the slow, s-curved population recruitment curve upon Ptx-1 changes into a near step-like function post Ptx-2. (K) Quantitative comparison of absolute population recruitment duration and duration standard deviation (std) of the Ptx-1 (blue) versus Ptx-2 (red) condition (n=4 exp., Ptx-1/Ptx-2: 21/17 seizures): mean recruitment duration (5.696 ± 1.915 vs. 0.375 ± 0.052 sec, Mann Whitney test: p = 0.0286), mean recruitment duration std (1.69 ± 0.625 vs. 0.068 ± 0.024 sec, p = 0.0286). (L) Quantitative comparison of absolute time delay and delay std of optical invasion after electrographic seizure onset of the Ptx-1 (blue) versus Ptx-2 (red) condition (n=4 exp., Ptx-1/Ptx-2: 21/17 seizures): mean delay (5.7 ± 0.538 vs. 0.116 ± 0.038 sec, Mann Whitney test: p = 0.002), mean delay std (1.78 ± 0.62 vs. 0.055 ± 0.012 sec, p = 0.0286).

Comment in

Similar articles

Cited by

References

    1. Adams C, Adams NE, Traub RD, Whittington MA. Electrographic waveform structure predicts laminar focus location in a model of temporal lobe seizures in vitro. PLoS One. 2015;10:e0121676. - PMC - PubMed
    1. Adesnik H, Bruns W, Taniguchi H, Huang ZJ, Scanziani M. A neural circuit for spatial summation in visual cortex. Nature. 2012;490:226–231. - PMC - PubMed
    1. Andermann ML, Gilfoy NB, Goldey GJ, Sachdev RN, Wolfel M, McCormick DA, Reid RC, Levene MJ. Chronic cellular imaging of entire cortical columns in awake mice using microprisms. Neuron. 2013;80:900–913. - PMC - PubMed
    1. Avoli M, D’Antuono M, Louvel J, Kohling R, Biagini G, Pumain R, D’Arcangelo G, Tancredi V. Network and pharmacological mechanisms leading to epileptiform synchronization in the limbic system in vitro. Prog Neurobiol. 2002;68:167–207. - PubMed
    1. Avoli M, de Curtis M. GABAergic synchronization in the limbic system and its role in the generation of epileptiform activity. Progress in neurobiology. 2011;95:104–132. - PMC - PubMed

Publication types