. 2017 Jun 27;19(13):2707-2717.
doi: 10.1016/j.celrep.2017.06.018.

Peripheral Sensory Deprivation Restores Critical-Period-like Plasticity to Adult Somatosensory Thalamocortical Inputs

Affiliations

Peripheral Sensory Deprivation Restores Critical-Period-like Plasticity to Adult Somatosensory Thalamocortical Inputs

Seungsoo Chung et al. Cell Rep. .

Abstract

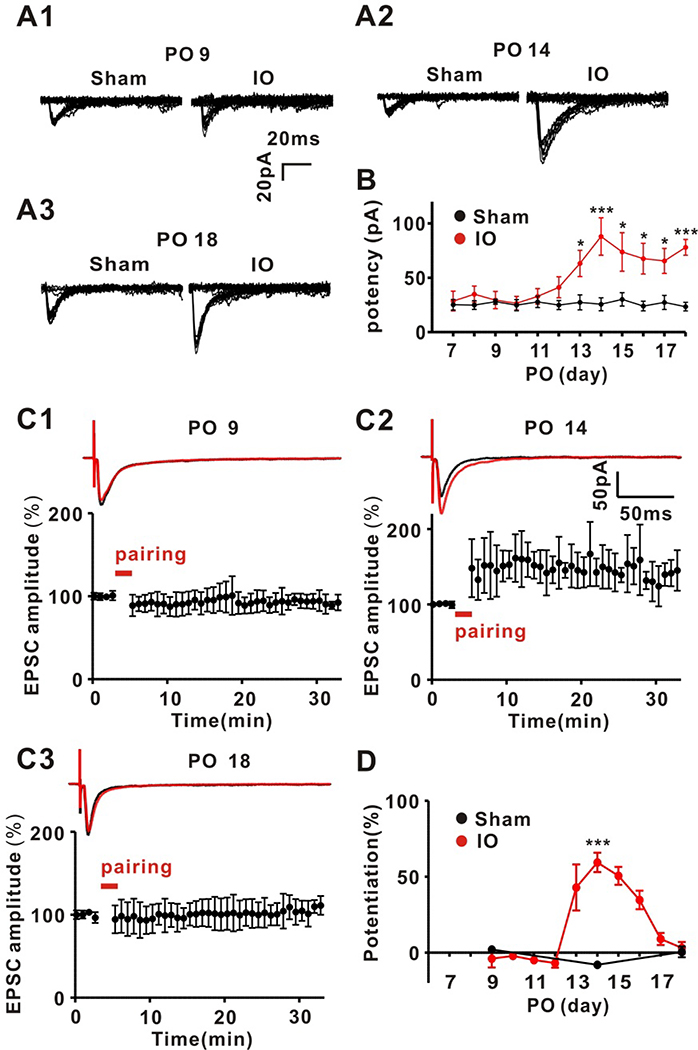
Recent work has shown that thalamocortical (TC) inputs can be plastic after the developmental critical period has closed, but the mechanism that enables re-establishment of plasticity is unclear. Here, we find that long-term potentiation (LTP) at TC inputs is transiently restored in spared barrel cortex following either a unilateral infra-orbital nerve (ION) lesion, unilateral whisker trimming, or unilateral ablation of the rodent barrel cortex. Restoration of LTP is associated with increased potency at TC input and reactivates anatomical map plasticity induced by whisker follicle ablation. The reactivation of TC LTP is accompanied by reappearance of silent synapses. Both LTP and silent synapse formation are preceded by transient re-expression of synaptic GluN2B-containing N-methyl-D-aspartate (NMDA) receptors, which are required for the reappearance of TC plasticity. These results clearly demonstrate that peripheral sensory deprivation reactivates synaptic plasticity in the mature layer 4 barrel cortex with features similar to the developmental critical period.

Keywords: NMDA receptor; adult barrel cortex; experience-dependent plasticity; glutamate; long-term potentiation; silent synapses; synaptic plasticity.


Figures

Figure 1.
Figure 1.
Unilateral infra-orbital nerve (ION) lesion restores LTP capability to adult thalamocortical inputs transiently (A1–3) Representative TC EPSC traces evoked by minimal stimulation at PO 9, 14 and 18 in Sham and ION-lesion (IO) groups. (B) Time courses for potencies of single fiber-activated TC EPSCs in both groups (IO group: n = 6, 6, 5, 6, 7, 6, 10, 8, 7, 7, 9, 8 at each PO from 7 to 18, respectively; Sham group: n = 9, 9, 7, 7, 7, 8, 7, 7, 7, 7, 7, 7 at each PO from 7 to 18, respectively) (Two-way ANOVA with post hoc Bonferroni test: Sham vs IO; *P <0.05, **P <0.01, ***P <0.001). (C1–3) LTP induction at TC inputs induced by pairing in slices from PO 9, 14 and 18 following ION lesion. Upper trace, representative traces showing of EPSCs before (average of 20 traces, black line) and after (average of 180 sweeps, red line). Lower trace, averaged time-courses for EPSC amplitude during LTP induction at PO 9, 14 and 18 following ION in IO group. (D) Summarized time-course of TC LTP in ION lesion or sham (IO group: n = 6, 6, 6, 6, 8, 6, 6, 6, 6, 6 at each POs from 9 to 18 respectively; sham group: n = 6, 6, 7 at PO 9, 14, 18 respectively). The amount of LTP induced in ION at PO14 was compared to the equivalent PO14 time point for sham (two-way ANOVA with post hoc Bonferroni test: Sham vs IO; ***P <0.001).
Figure 2.
Figure 2.
Re-expression of GluN2B at TC synapses following unilateral infra-orbital nerve lesion (A1–3) Representative traces showing NMDA and AMPA TC EPSCs at PO 9, 15, 21 respectively following ION lesion. (B) Time-course for NMDA:AMPA ratios in both groups (IO group: n = 8, 10,12, 6, 15, 10, 12, 6, 12, 6, 12 at each POs from 9 to 18 and 21; sham group: n = 6, 6, 6 at PO 9, 14, 21) (Two-way ANOVA with post hoc Bonferroni test: Sham vs IO; ***P <0.001). (C1–3) Representative traces of NMDA EPSCs recorded in slices from animals at PO 9, 12 and 18 before (black lines) and after application (red lines) of 5 μM ifenprodil. (D) Time-course for ifenprodil sensitivity of TC NMDA EPSCs following ION lesion or for sham (IO group: n = 6, 6, 6, 6, 6, 8, 6, 6, 6, 6, 6, 6 at each PO from 7 to 18 respectively; Sham group: n = 6, 6 and 6 at PO 7, 12, 18 respectively) (Two-way ANOVA with post hoc Bonferroni test: Sham vs IO; ***P <0.001).
Figure 3.
Figure 3.
Reappearance of silent synapses following unilateral infra-orbital nerve lesion (A1, B1, C1) Representative traces for EPSCs evoked by minimal stimulation for 50 trials at holding potentials of −70 mV or +40- mV in slices from animals at PO 9, 14 and 21 for IO and sham groups. (A2, B2, C3) Time course of EPSC amplitudes for examples cells shown in A1, B1 and C1 collected at −70 mV (blue symbols) and +40 mV (red symbols). (A3, B3, C3) Failure rates for EPSCs at −70 mV or +40- mV in slices from animals PO 9, 14 and 21 for IO and sham groups. (D) Time course for percentage silent synapse proportions for IO and sham groups (IO group: n = 8, 10, 12, 6, 15, 10, 12, 6, 12, 6, 12 at each PO 9, 11, 13, 14, 15, 17, 21; Sham group: n = 6, 6, 6 at PO 9, 14, 21) (Two-way ANOVA with post hoc Bonferroni test: Sham vs IO; ***P <0.001).
Figure 4.
Figure 4.
NMDA EPSCs at silent synapses are not primarily mediated by GluN2B-containing NMDA receptors. (A1) Representative traces for EPSCs evoked by minimal stimulation at holding potentials of −70 mV or +40- mV in slices from animals at PO 14 following ION lesion recorded in the absence (left traces) or presence of 5 μM ifenprodil (right traces; these example experiments are from different cells). (A2) Time course of EPSC amplitudes for examples cells shown in A1. (A3) Failure rates for the responses at −70 mV and +40 mV at PO 14 in the absence or presence of 5 μM ifenprodil. (B) Summary of ifenprodil effect on percent silent synapses (n = 10).
Figure 5.
Figure 5.
TC LTP following ION lesion is NMDA receptor-dependent, but GluN2B-independent. (A1) Upper traces, representative traces for the effect of 10 μM D-AP5 on LTP induction at PO 14 following ION lesion. Lower traces, time course of EPSC amplitude for same experiment. (A2) Averaged time-course of EPSC amplitude for LTP experiments in the presence of AP-5 at PO 14 following ION lesion. (A3) Summary of AP5 effects on LTP induction at PO 14 following ION lesion (ION group: n = 6; ION + AP5 group: n = 5; unpaired T-test; ***P <0.001). (B1) Upper traces, representative traces for the effect of 5 μM ifenprodil on LTP induction at PO 14 following ION lesion. Lower traces time-course for EPSC amplitude for same experiment. (B2) Averaged time-course for EPSC amplitude for LTP experiments in the presence of ifenprodil at PO 14 following ION lesion (B3) Summary of ifenprodil effects on LTP induction at PO 14 in following ION lesion (ION group: n = 6; ION + ifenprodil group: n = 7).
Figure 6.
Figure 6.
Activation of GluN2B-containing NMDA receptors is required in vivo for reappearance of silent synapses and TC LTP (A) Left, bright field image of a TC slice showing the injection site (red box) in a methylene blue-injected rat. Right, bright field image of a TC slice showing the recording electrode and injection site (red arrow head). (B1) Upper traces, representative traces for the effect of in vivo saline injection on LTP induction at PO 14 following ION lesion. Lower panel, time-course of EPSC amplitude for the same experiment (B2) Averaged time-course of EPSC amplitude for LTP experiments in slices from PO 14 ION lesion rats in the saline-injected group (n = 6). (B3) Upper traces, Representative traces for the effect of in vivo ifenprodil injection on LTP induction at PO 14 following ION lesion. Lower panel, time-course of EPSC amplitude for the same experiment (B4) Averaged time-course of EPSC amplitude for LTP experiments in slices from PO 14 ION lesion rats in the ifenprodil-injected group (n = 6). (C) Summary of the effect of saline or ifenprodil injection on LTP induction at PO 14 in sham and ION lesion groups (sham+saline: n = 7; IO+saline: n = 6; IO+ifenprodil: n = 6; one-way ANOVA with post hoc Tukey test; *P <0.05; ***P <0.001). (D1) Representative traces for EPSCs at −70 mV and +40 mV evoked by minimal stimulation at PO 14 in ION lesion rats in the saline-injected group. (D2) Time course of EPSC amplitude for experiment shown in D1. (D3) Failure rates for the responses at −70 mV and +40 mV at PO 14 in ION lesion rats in the saline-injected group. (D4) Representative traces for EPSCs at −70 mV and +40 mV evoked by minimal stimulation at PO 14 in ION lesion rats in the ifenprodil-injected group. (D5) Time course of EPSC amplitude for experiment shown in 4. (D6) Failure rates for the responses at −70 mV and +40 mV at PO 14 in ION lesion rats in the ifenprodil-injected group. (E) Summary data for the effect of saline or ifenprodil injection on % silent synapses at PO 14 following ION lesion (saline: n = 5; ifenprodil: n = 5; unpaired T test; ***P <0.001).
Figure 7.
Figure 7.
Unilateral whisker trimming or ablation of barrel field cortex restores long-term plasticity to TC input in spared barrel cortex similar to unilateral ION lesion. (A) (From top to bottom) Representative TC EPSC traces evoked by minimal stimulation at PO 14 in Sham, ION lesion (IO), unilateral whisker-trimmed (UWT), ION lesion with spared whisker-trimmed (SWT+IO) and unilateral BFC-lesioned (UBL) groups. The traces for Sham and IO groups are the same as Figure 1A2. Unilateral whisker trimming and BFC lesion were performed at the age of 4 weeks, similar to IO and Sham operation. Spared whiskers were trimmed daily from PO 12 to PO 14 in spared whisker-trimmed ION-lesioned rats. (B) Averaged summary for potencies of single fiber-activated TC EPSCs in each groups (Sham group: 25.6 + 6.0 pA, n = 7; IO group: 88.6 + 17.2 pA, n = 7; UWT group: 72.4 + 10.4 pA, n = 7; SWT+IO group: 24.0 + 5.1 pA, n = 7; UBL group: 76.6 + 12.0 pA, n = 8) (One-way ANOVA with post hoc Tukey test, *P <0.05, **P <0.01). (C1–2) LTP induction at TC inputs induced by pairing in slices from PO 14 following unilateral whisker trimming (C1) or BFC lesion (C2). Upper traces, representative traces showing of EPSCs before (average of 20 traces, black line) and after (average of 180 sweeps, red line). Lower trace, averaged time-courses for EPSC amplitude during LTP induction at PO 14 following unilateral whisker trimming (C1) or BFC lesion (C2). (D) Averaged summary for TC LTP at PO 14 in Sham, IO, UWT and UBL groups. (Sham group: −8.0 + 2.2 %, n = 6; IO group: 59.4 + 6.4 %, n = 6; UWT group: 54.2 + 7.7 %, n = 7; UBL group: 43.9 + 4.6 pA, n = 6) (One-way ANOVA with post hoc Tukey test, *P <0.05, **P <0.01).

References

    1. Adam R, and Gunturkun O (2009). When one hemisphere takes control: metacontrol in pigeons (Columba livia). PloS one 4, e5307. - PMC - PubMed
    1. Agmon A, and Connors BW (1991). Thalamocortical responses of mouse somatosensory (barrel) cortex in vitro. Neuroscience 41, 365–379. - PubMed
    1. Alvarez VA, Ridenour DA, and Sabatini BL (2007). Distinct structural and ionotropic roles of NMDA receptors in controlling spine and synapse stability. The Journal of neuroscience : the official journal of the Society for Neuroscience 27, 7365–7376. - PMC - PubMed
    1. Ashby MC, and Isaac JT (2011). Maturation of a recurrent excitatory neocortical circuit by experience-dependent unsilencing of newly formed dendritic spines. Neuron 70, 510–521. - PMC - PubMed
    1. Barth AL, and Malenka RC (2001). NMDAR EPSC kinetics do not regulate the critical period for LTP at thalamocortical synapses. Nat Neurosci 4, 235–236. - PubMed

Publication types

LinkOut - more resources