. 2017 Jun 27;19(13):2743-2755.
doi: 10.1016/j.celrep.2017.05.093.

Lanosterol Modulates TLR4-Mediated Innate Immune Responses in Macrophages

Affiliations

Lanosterol Modulates TLR4-Mediated Innate Immune Responses in Macrophages

Elisa Araldi et al. Cell Rep. .

Abstract

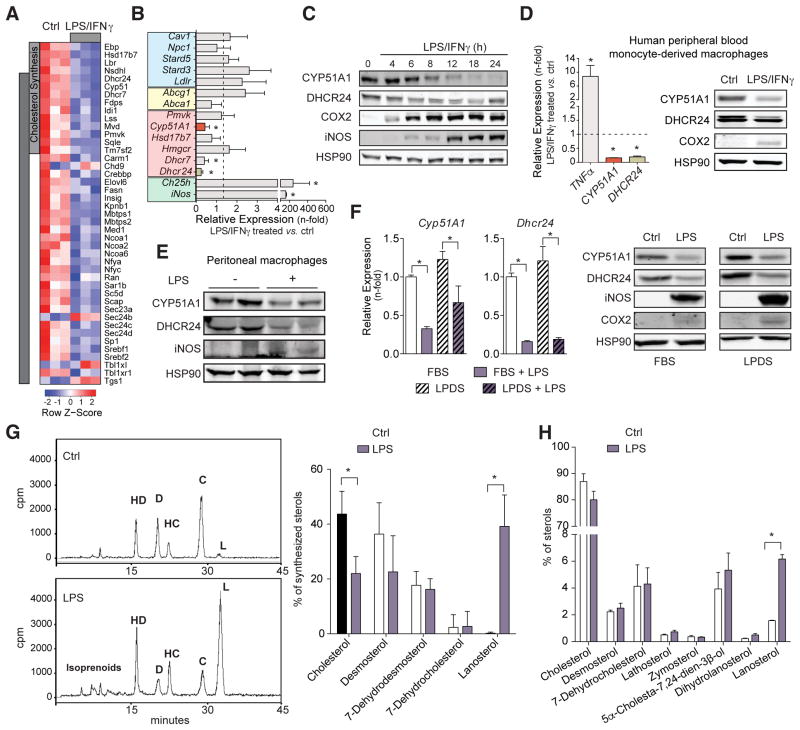
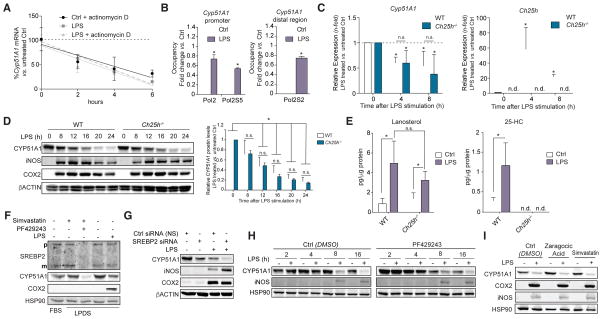
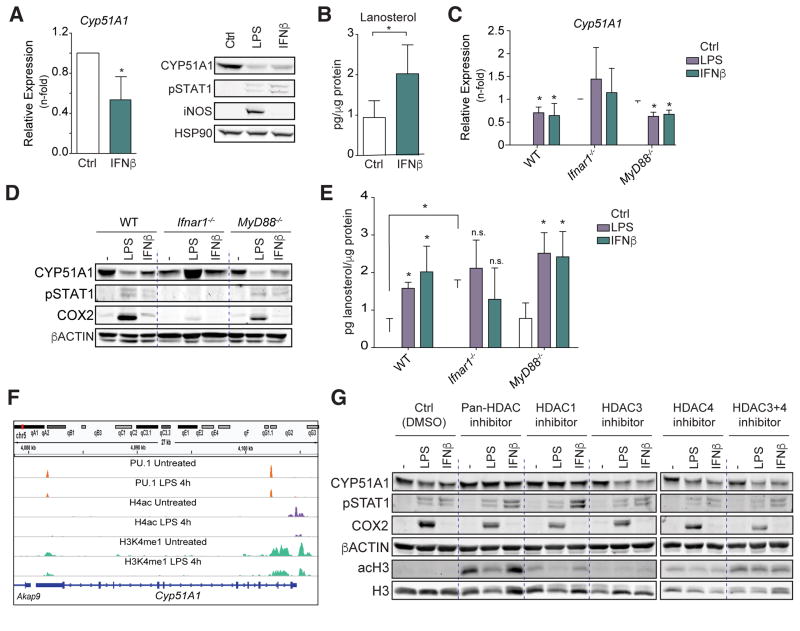
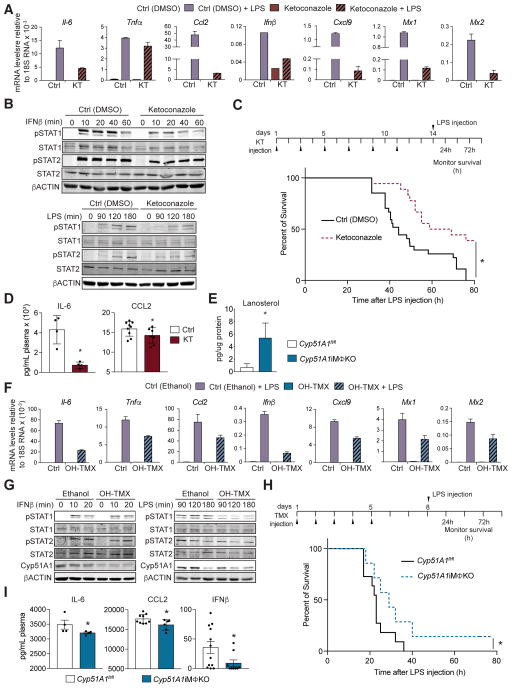
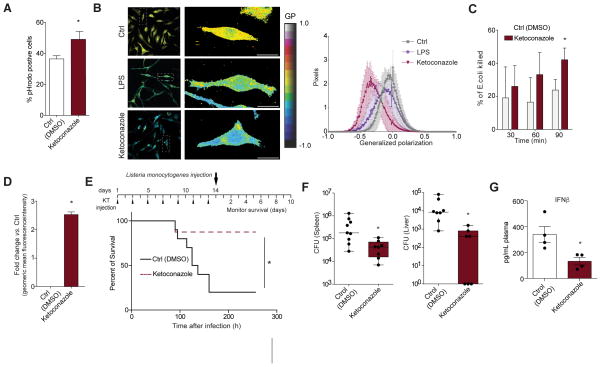
Macrophages perform critical functions in both innate immunity and cholesterol metabolism. Here, we report that activation of Toll-like receptor 4 (TLR4) in macrophages causes lanosterol, the first sterol intermediate in the cholesterol biosynthetic pathway, to accumulate. This effect is due to type I interferon (IFN)-dependent histone deacetylase 1 (HDAC1) transcriptional repression of lanosterol-14α-demethylase, the gene product of Cyp51A1. Lanosterol accumulation in macrophages, because of either treatment with ketoconazole or induced conditional disruption of Cyp51A1 in mouse macrophages in vitro, decreases IFNβ-mediated signal transducer and activator of transcription (STAT)1-STAT2 activation and IFNβ-stimulated gene expression. These effects translate into increased survival to endotoxemic shock by reducing cytokine secretion. In addition, lanosterol accumulation increases membrane fluidity and ROS production, thus potentiating phagocytosis and the ability to kill bacteria. This improves resistance of mice to Listeria monocytogenes infection by increasing bacterial clearance in the spleen and liver. Overall, our data indicate that lanosterol is an endogenous selective regulator of macrophage immunity.

Keywords: Cyp51A1; TLR4; innate immunity; lanosterol; macrophage.


Figures

Figure 1
Figure 1. CYP51A1 downregulation in LPS/IFNγ-treated macrophages promotes the accumulation of lanosterol
(A) Heat map of differentially expressed cholesterol biosynthesis genes and SREBP2 targets in BMDMs stimulated with LPS (10ng/mL)/IFNγ (20ng/mL) for 8h. (B) qPCR validation of microarray data. Relative mRNA expression levels of cholesterol trafficking (blue), efflux (yellow), biosynthesis (red), and positive controls of inflammatory stimulation (green), (n=3). (C) CYP51A1 and DHCR24 protein levels of LPS/IFNγ treated BMDMs for the indicated times (n=3). (D) Relative mRNA expression (left) and protein levels of CYP51A1 and DHCR24 (right) in hMΦs treated with LPS/IFNγ for 8h (left) or 18h (right), (n=3). (E) CYP51A1 and DHCR24 protein levels of elicited peritoneal macrophages collected 24h after intraperitoneal injection of LPS (20mg/kg) performed 3 days after initial 3% thioglycollate injection (n=2). (F) Left: relative mRNA expression, Right: protein levels CYP51A1 and DHCR24 of BMDMs cultured for 24h in regular media containing 20% FBS or in media containing 20% LPDS and then treated with LPS (100ng/mL) for 8h (left) or 18h (Right), (n=3). (G) Sterol intermediates analysis by HPLC and on-line radioactivity of BMDM treated LPS (100ng/mL) or PBS (Ctrl) for 24h. Left: representative plots of [1–214C]-acetate incorporation into sterols. Right: quantification of total synthesized sterols, expressed as % of total synthesized sterols vs. Ctrl, (n=3). (H) Composition of sterols by GC/MS of BMDM as in G, (% of each sterol specie within total sterol), (n=3). (C, D, E, F) COX2, iNOS or TNFα are positive controls of inflammatory activation. HSP90 is a loading control. Results are expressed as mean ± SEM. *p < 0.05 vs. Ctrl unless otherwise indicated. See also Figure S1.
Figure 2
Figure 2. CYP51A1 is transcriptionally downregulated independently of newly synthesized 25-HC and of SREBP activation
(A) Cyp51A1 mRNA analysis by qPCR of BMDMs treated with actinomycin-D (30 min) prior LPS (100ng/mL) stimulation for indicated times (n=3). (B) ChIP analysis with Pol2 and Pol2S5 (left) and PolS2 (right) of BMDMs cultured in media containing 20% LPDS for 24h and treated with LPS for 1h. Quantification of promoter specific bound antibody by qPCR with primers proximal to the TSS of Cyp51A1. Data are fold change vs. Ctrl (PBS treated) and normalized to input chromatin (n=3). (C) Relative mRNA expression of Cyp51A1 (left) or Ch25h (right) of WT of Ch25h−/−BMDMs incubated with LPS for the indicated times (n= 4). (D) Left: CYP51A1 protein levels of LPS treated BMDMs for the indicated times. Right: quantification of CYP51A1 protein levels normalized by βACTIN (n= 4) (E) Quantification of Lanosterol (left) or 25-HC (right) by GC/MS normalized protein content of WT of Ch25h−/− BMDMs incubated with LPS for 24h, (n=3). (F) CYP51A1 protein levels and precursor (p) and mature (m) forms of SREBP-2 of BMDMs incubated in regular media containing 20% FBS or 20% LPDS as indicated, treated with Simvastatin (5μM) for 12h, PF429243 (10μM) for 12h or LPS (100g/mL) for 4h, respectively (n=4). (G) CYP51A1 protein levels of BMDMs transfected with 30nM of non silencing (NS) control siRNA or Srebp2 siRNA and treated or not with LPS, as indicated, for 8h (n=3). (H) CYP51A1 protein levels of BMDMs treated with PF429243 (10μM) or vehicle (DMSO) Ctrl stimulated with LPS for the indicated times. (I) CYP51A1 protein levels of BMDM incubated with DMSO (Ctrl), zaragozic acid (10μM) or simvastatin (5μM) for 2h prior LPS stimulation for 8h (n=3). (D, F, G, H, I) COX2 and iNOS are positive controls of activation. βACTIN or HSP90 are loading controls. Results are expressed as mean ± SEM. *p < 0.05 vs. Ctrl unless otherwise indicated. Not significant (n.s.). Not detectable (n.d.) See also Figure S1 and S2.
Figure 3
Figure 3. CYP51A1 downregulation in macrophages is caused by a type I IFN response and is mediated by HDAC1 activation
(A) Relative mRNA expression of Cyp51A1 (left) and CYP51A1 protein levels (right) of BMDMs stimulated with IFNβ(1000U/mL) for 4h (left) or with LPS (100ng/mL) or IFNβ for 12h (right), (n=3). (B) Quantification of lanosterol by GC/MS normalized protein content of BMDMs incubated with IFNβ for 24h, (n=3). (C–D) Relative mRNA expression (C) or protein levels (D) of CYP51A1 of WT, Ifnar1−/− or myD88−/− BMDMs stimulated with LPS or INFβ for 4h (C) or 12h (D), (n=3). (E) Quantification of Lanosterol by GC/MS normalized protein content of BMDMs WT, Ifnar1−/− or myD88−/− BMDMs as in (B). (F) ChIP sequencing analysis of PU.1, H4ac, H3K4me1 pull-down in BMDM treated with LPS for 4hours or control. Pioneer transcription factor of the myeloid lineage (PU.1), active enhancer markers histone 4 acetylation (H4ac), histone 3 lysine 4 mono-methylation (H3K4me1), active promoter marker H3K4me3. (Ostuni et al., 2013). (G) CYP51A1 protein levels of BMDMs treated with different HDAC inhibitors. Pan-HDAC: panabinostat (50nM), HDAC1: CAY10398 (10μM), HDAC3: RGFP966 (5μM), HDAC4: tasquinimod (10mM) for 1h prior LPS or IFNβ stimulation for 12h (n=3). Dashed blue lines are for treatment group separation and do not indicate cropped blots. H3 and AcH3 are controls for HDAC inhibitor action. (A, D, G) pSTAT1, iNOS, COX2 are controls of activation of inflammatory activation, respectively. HSP90 or βACTIN are loading controls. Results are expressed as mean ± SEM. *p < 0.05 vs. Ctrl unless otherwise indicated. See also Figure S3.
Figure 4
Figure 4. Lanosterol decreases inflammatory cytokine secretion and improves survival to endotoxemic shock
(A) qPCR analysis of mRNA levels of indicated genes of BMDMs treated with KT (10μM) or DMSO 12h prior of LPS (100ng/ml) for 4h. (B) pSTAT1/STAT1 and pSTAT2/STAT2 protein levels of BMDMs treated with KT 12h prior to IFNβ (1000U/mL) (upper panels) or LPS (lower panels) for the indicated times (n=3). (C) Survival of WT mice treated with (25mg/kg) of KT as in indicated and subjected to a lethal dose of LPS (60 mg/kg). KT-treated mice (n=18), DMSO Ctrl treated mice (n=25). (D) Plasma levels IL6 or CCL2 by ELISA 3h after LPS injection (60mg/kg) of mice injected with KT as in (C). Each dot represents the mean of triplicate sample of individual animal. (E) Quantification of Lanosterol by GC/MS normalized protein content of BMDMs isolated from Cyp51A1fl/fl or Cyp51A1iMFΦKO 3 days after of TMX Cre-mediated induction as described in experimental procedures (n=3 per group). (F) qPCR analysis of mRNA levels of indicated genes of Cyp51A1iMFΦKO BMDMs and treated at day 5 of differentiation with OH-TMX (10μg/mL) or Ethanol for 2 days and then stimulated with LPS 100ng/mL for 4h. (G) pSTAT1/STAT1 and pSTAT2/STAT2 protein levels of Cyp51A1iMFΦKO BMDMs treated with OH-TMX or Ethanol as in (F) prior to IFNβ (upper panels) or LPS (lower panels) for the indicated times (n=3). CYP51A1 protein levels are show as control of TMX induced deletion. (H) Survival of Cyp51A1fl/fl or Cyp51A1iMFΦKO treated as indicated and subjected to a lethal dose LPS (60 mg/kg). Cyp51A1fl/fl (n=11), Cyp51A1iMFΦKO (n=6). (I) Plasma levels IL6 or CCL2 determined by ELISA 3h after LPS injection (60mg/kg) of mice of Cyp51A1fl/fl or Cyp51A1iMFΦKO mice injected with TMX as indicated in (H). Each dot represents the mean of triplicate sample of individual animal. (A, G) βACTIN is a loading control. (A, F) Data are mean of duplicate samples ± SD of one representative experiment out of four with similar results. (C, H) Kaplan–Meier survival curves compared by log-rank test. *p < 0.05 (C) or *p < 0.1 (H). (D, E, I) Results are expressed as mean ± SEM. *p < 0.05 vs. Ctrl. See also Figure S4.
Figure 5
Figure 5. Lanosterol improves phagocytosis and bacteria clearance and confers survival advantage to Listeria monocytogenes infection
(A) FACS analysis of uptake of opsonized E.coli pHrodo particles in CD11b+/Ly-6G- cells from thioglycollate elicited peritoneal cells from KT or DMSO treated mice as in Figure 4C. Data are % of pHrodo positive cells (n=3). (B) Representative micrographs of BMDMs treated with DMSO vehicle control, LPS 100ng/mL plus DMSO or KT (10μM) for 12h, stained with laurdan (left) and analyzed as described in experimental procedures. Higher GP value indicates that membranes are more ordered and less dynamic or fluid (right). The GP value of each pixel was used to generate a pseudocolor GP image (left). Representative experiment out of 3 with similar results. (C) Bacteria killing assay of tdTomato-E.coli in cells obtained as in (A) and analyzed by FACS. Data % of killed bacteria in CD11b+/Ly-6G- cells (n=3). (D) ROS determination with CellRox by FACS in BMDMs treated with KT (10μM) for 12h. Data (geometric mean fluorescent intensity) expressed as fold change vs. DMSO Ctrl (n=3, by triplicate). (E) Survival of WT mice treated 25mg/kg of KT as in indicated and infected by retro-orbital injection with 1×10⁵ Listeria particles. KT-treated mice (n=10), DMSO treated Ctrl mice (n=15). Kaplan–Meier survival curves compared by log-rank test. (G) Bacteria Burden in spleen and liver 48h post-infection with 1.5×10⁴ Listeria particles. CFU were determined from spleen and liver. Each dot represents data obtained from individual animals. (H) Plasma levels of IFNβ by ELISA of mice treated with KT as indicated in (E) and then infected with 1.5×10⁴ Listeria particles for 48h. Each dot represents the mean of triplicate sample of individual animal. Results are expressed as mean ± SEM. *p < 0.05 vs. Ctrl. See also Figure S5.

Similar articles

Cited by

References

    1. Adams CM, Reitz J, De Brabander JK, Feramisco JD, Li L, Brown MS, Goldstein JL. Cholesterol and 25-hydroxycholesterol inhibit activation of SREBPs by different mechanisms, both involving SCAP and Insigs. J Biol Chem. 2004;279:52772–52780. - PubMed
    1. Andreyev AY, Fahy E, Guan Z, Kelly S, Li X, McDonald JG, Milne S, Myers D, Park H, Ryan A, et al. Subcellular organelle lipidomics in TLR-4-activated macrophages. The Journal of Lipid Research. 2010;51:2785–2797. - PMC - PubMed
    1. Auerbuch V, Brockstedt DG, Meyer-Morse N, O’Riordan M, Portnoy DA. Mice lacking the type I interferon receptor are resistant to Listeria monocytogenes. J Exp Med. 2004;200:527–533. - PMC - PubMed
    1. Aung HT, Schroder K, Himes SR, Brion K, van Zuylen W, Trieu A, Suzuki H, Hayashizaki Y, Hume DA, Sweet MJ, et al. LPS regulates proinflammatory gene expression in macrophages by altering histone deacetylase expression. FASEB J. 2006;20:1315–1327. - PubMed
    1. Avery SV, Lloyd D, Harwood JL. Temperature-dependent changes in plasma-membrane lipid order and the phagocytotic activity of the amoeba Acanthamoeba castellanii are closely correlated. Biochem J. 1995;312(Pt 3):811–816. - PMC - PubMed