. 2017 Jun 27;19(13):2771-2781.
doi: 10.1016/j.celrep.2017.06.019.

Hepatocyte Hyperproliferation upon Liver-Specific Co-disruption of Thioredoxin-1, Thioredoxin Reductase-1, and Glutathione Reductase

Affiliations

Hepatocyte Hyperproliferation upon Liver-Specific Co-disruption of Thioredoxin-1, Thioredoxin Reductase-1, and Glutathione Reductase

Justin R Prigge et al. Cell Rep. .

Abstract

Energetic nutrients are oxidized to sustain high intracellular NADPH/NADP+ ratios. NADPH-dependent reduction of thioredoxin-1 (Trx1) disulfide and glutathione disulfide by thioredoxin reductase-1 (TrxR1) and glutathione reductase (Gsr), respectively, fuels antioxidant systems and deoxyribonucleotide synthesis. Mouse livers lacking both TrxR1 and Gsr sustain these essential activities using an NADPH-independent methionine-consuming pathway; however, it remains unclear how this reducing power is distributed. Here, we show that liver-specific co-disruption of the genes encoding Trx1, TrxR1, and Gsr (triple-null) causes dramatic hepatocyte hyperproliferation. Thus, even in the absence of Trx1, methionine-fueled glutathione production supports hepatocyte S phase deoxyribonucleotide production. Also, Trx1 in the absence of TrxR1 provides a survival advantage to cells under hyperglycemic stress, suggesting that glutathione, likely via glutaredoxins, can reduce Trx1 disulfide in vivo. In triple-null livers like in many cancers, deoxyribonucleotide synthesis places a critical yet relatively low-volume demand on these reductase systems, thereby favoring high hepatocyte turnover over sustained hepatocyte integrity.

Keywords: cancer; glutathione; liver; methionine cycle; mouse model; proliferation; redox; ribonucleotide reductase; thioredoxin; transsulfuration.


Figures

Figure 1
Figure 1. Development of Mice with Liver-Specific Co-disruptions of Trx1, TrxR1, and Gsr
(A) Txn1fl allele. The targeting vector generating the founder allele (Txn1found) contained a self-excising Flp/neo cassette that matures into the floxed allele (Txn1fl) in male germ cells. Cre recombination generates Txn1null. Details are in the Supplemental Experimental Procedures. (B) Chromosomal targeting. C57BL/6 × 129SvEv hybrid embryonic stem cells (ESCs) were used. Founder pups (chimera × C57BL/6) that either did (left) or did not (right) contain the Txn1found allele were analyzed for D4Mit193 (17.9 cM from Txn1), distinguishing C57BL/6 and 129SvEv chromosome 4. Most pups with Txn1found were homozygous for the C57BL/6 D4Mit193 marker with ratios reflecting meiotic recombination frequencies, indicating the allele had targeted the C57BL/6 chromosome. M, marker; C, WT ESC control. (C) Mendelian representation of WT (+) and Txn1fl alleles in genomic DNA from F1 sib-matings. (D) Conversion of Txn1fl to Txn1null in liver by AlbCre and survival of mice with Trx1-null livers. Total RNA from adult livers was analyzed for the presence of mRNA from the WT or Txn1fl alleles (molecularly identical) versus from the Txn1null allele by RT-PCR. Lanes 5 and 6 show adult mice with Trx1-null livers. C, no template control. (E) Histology of adult livers of each homozygous combination. Arrows show inflammation (blue), ductular reactions (purple), or hypertrophic (yellow) or degenerating (green) hepatocytes. Scale bars, 400 μm. C or P, representative central veins or portal triads, respectively. (F) Liver size at harvest. Bars depict mean and SEM (*p < 0.05 and **p < 0.01; ns, not significant; versus WT, Student’s t test). (G) Representative macroscopic and microscopic necrotic foci (green arrows) in double-null, but not in single-null, livers. Upper panels, liver lobes; scale bars, 1 mm. Lower panels, H&E-stained histology; scale bars, 200 μm. (H) Immunoblots on liver lysates of representative genotypes. Asterisk denotes mitochondrial TrxR2, which cross-reacts with the TrxR1 antibody. (I) Levels of GSH system component activities. Graphs depict means and SEM (*p < 0.05 and **p < 0.01; ns, not significant; versus WT, Student’s t test). (J) Thiol generation in lysates detected by reaction with DTNB, measured at 421 nm. Reactions contained liver lysates, GSSG, NADPH, or NADH as indicated.
Figure 2
Figure 2. Redistribution of Reducing Power among Cytosolic Disulfide-Reducing Systems in Primary Fibroblasts
(A) Synthetic lethality at 48 hr. Stably WT or Gsr-null fibroblast cultures or cultures that had been converted to the indicated genotypes 4 days earlier (see Figure S1) were untreated (cont, standard medium, 5 mM glucose) or treated for 48 hr with 3 mM BSO, 3 mM PPG, or 33 mM glucose, as indicated at top, and photographed. Red numerals in select panels refer to conditions modeled in (C). Scale bars, 200 μm. (B) Quantification of cell survival. Adherent live cells were counted on replicate plates as in (A), presented as the percentage of live cells present compared to the untreated control value for that cell line. Bars represent mean and SEM of surviving cells of the indicated line under the conditions indicated. Green shading and orange shading correspond to values considered to represent cell survival or cell failure under these conditions. (C) Pathway interpretations. Top diagram depicts reducing power trafficking from NADPH-independent (rose) or -dependent sources (blue). Enzymes or pathways that are disrupted genetically or pharmacologically in (A) are indicated by red font or red arrows, respectively. Yellow star, hyperglycemia-induced oxidative stress; gray arrows, putative cross-trafficking of reducing power from TrxR1 to Grx (arrow i) or from Grx to Trx1 (arrow ii); blue and green arrows, the outputs of the GSH or Trx1 pathways, respectively. Below, the modeling pathway activities and outcomes under key conditions tested in (A) are shown. Assignments of survive or fail (green or orange, respectively) were based on values depicted with the same colors in (B). Red numerals refer to correspondingly labeled conditions in (A). Red Xs denote enzymes or activities that were disrupted in each condition.
Figure 3
Figure 3. Accumulation of Oxidative Damage in Resting Adult Liver
(A–L) Panels show representative images of H&E-stained histology (A, E, and I) or immunostaining for 4-HNE (B, F, and J), acrolein adducts (C, G, and K), or glutathionylated proteins (protein-SSG; D, H, and L) in WT (A–D), TrxR1-null (E–H), or TrxR1/Gsr-null (I–L) livers, as indicated. Blue arrows denote small rare acrolein-positive cells of unknown type, which are present in all genotypes. Abbreviations as in Figure 1; BH, ballooning hepatocyte; DR, ductal reaction; LM, giant Langhan’s type macrophage. Scale bars, 200 μm.
Figure 4
Figure 4. Hepatocytic Mitochondrial Ultrastructure
(A) Representative transmission electron micrographs, captured at 5,000× magnification. Yellow arrows denote regions where DBs have distinct multilamminar surrounding membranes; yellow asterisks denote Mi containing distinct electron-dense condensations; blue arrows denote glycogen rosettes dispersed outside of GTs. DB, coarsely electron dense bodies; ER, endoplasmic reticulum; GT, glycogen tracts; LD, lipid droplet; Mi, mitochondrion; Nu, nucleus. Scale bars, 1,000 nm. (B) Quantification of average mitochondrial cross-sectional area (top panel), average total mitochondrial area per cytoplasmic area (middle), or average number of DBs per cytoplasmic area (bottom).
Figure 5
Figure 5. Impacts of Acute Oxidative or Hepatotoxic Stress
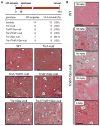
(A) Acute oxidative stress. Top: experimental strategy for I/R injury model is shown. The left lateral lobe (one-third of liver mass) was occluded for 30 min to induce ischemia; 14-day survival is tabulated below. Bottom: representative liver micrographs at 14 days post-I/R injury are shown (see also Figures S3 and S4). Inflammatory foci, py-knotic cells, necrotic hepatocytes, or post-necrotic acellular debris are denoted by yellow, white, green, or blue arrows, respectively. Scale bars, 200 μm. (B) Hepatic acetaminophen toxicity. Adult male mice were challenged with the indicated doses of APAP and harvested 24 hr later for histopathological evaluation. Representative tracts of centi-lobular congestion (CC) are denoted with dashed lines; other designations are as above. Scale bars, 200 μm.
Figure 6
Figure 6. Hepatocyte Morphometry and Proliferation
(A–C) Genotype-specific hepatocyte morphometry. Volumetric values are plotted on a log2 scale. Each point represents a single hepatocyte or nuclei (A and B, respectively). The nuclear:total hepatocyte volumetric ratio for each hepatocyte is plotted in (C). WT livers are predominated by diploid and tetraploid nuclei, as seen by clustering of values for WT livers in (B), and these landmarks were used to assign approximate ploidy values. See the Supplemental Experimental Procedures for details. (D) Hepatocyte nuclear sizes in juvenile or aged mice. Cryosections of livers from post-natal day 26 (P26) or P255 mice of the indicated genotypes were prepared and imaged by fluorescence microscopy. In TrxR1/Gsr-null mice, hepatocyte nuclei are green and nuclei of all other cell types are red; in Gsr-null mice all nuclei are red. For each condition, a low-magnification (left; scale bar, 100 μm) and embedded zoomed image pair is shown for nuclei size comparisons. Results show that hyperploidy is already pronounced by P26 in TrxR1/Gsr-null livers (e.g., compare P26 TrxR1/Gsr-null nuclei sizes to P255 Gsr-null nuclei sizes) yet increases further with age. (E–G) Proliferation in resting adult livers. Representative immunostaining or compiled data for PCNA (E and F, respectively) or PHH3 (G) staining are shown. Graphs depict means and SEM (*p < 0.05 and **p < 0.01; ns, not significant; versus WT, Student’s t test). Scale bars, 200 μm. See also Figure S4.

Similar articles

Cited by

References

    1. Arnér ESJ. Focus on mammalian thioredoxin reductases–important selenoproteins with versatile functions. Biochim Biophys Acta. 2009;1790:495–526. - PubMed
    1. Arnér ESJ, Eriksson S. Mammalian deoxyribonucleoside kinases. Pharmacol Ther. 1995;67:155–186. - PubMed
    1. Arnér ES, Holmgren A. Physiological functions of thioredoxin and thioredoxin reductase. Eur J Biochem. 2000;267:6102–6109. - PubMed
    1. Bondareva AA, Capecchi MR, Iverson SV, Li Y, Lopez NI, Lucas O, Merrill GF, Prigge JR, Siders AM, Wakamiya M, et al. Effects of thioredoxin reductase-1 deletion on embryogenesis and transcriptome. Free Radic Biol Med. 2007;43:911–923. - PMC - PubMed
    1. Brand MD, Affourtit C, Esteves TC, Green K, Lambert AJ, Miwa S, Pakay JL, Parker N. Mitochondrial superoxide: production, biological effects, and activation of uncoupling proteins. Free Radic Biol Med. 2004;37:755–767. - PubMed

Publication types

LinkOut - more resources