. 2017 Jun 27;19(13):2782-2795.
doi: 10.1016/j.celrep.2017.06.011.

In Vivo Regulation of the Zebrafish Endoderm Progenitor Niche by T-Box Transcription Factors

Affiliations

In Vivo Regulation of the Zebrafish Endoderm Progenitor Niche by T-Box Transcription Factors

Andrew C Nelson et al. Cell Rep. .

Abstract

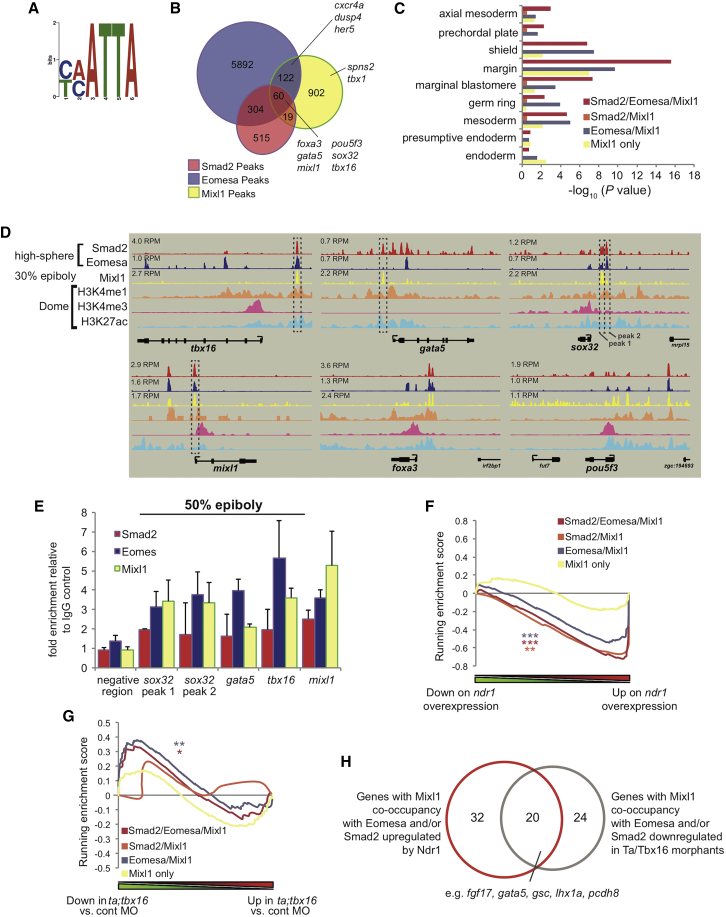
T-box transcription factors T/Brachyury homolog A (Ta) and Tbx16 are essential for correct mesoderm development in zebrafish. The downstream transcriptional networks guiding their functional activities are poorly understood. Additionally, important contributions elsewhere are likely masked due to redundancy. Here, we exploit functional genomic strategies to identify Ta and Tbx16 targets in early embryogenesis. Surprisingly, we discovered they not only activate mesodermal gene expression but also redundantly regulate key endodermal determinants, leading to substantial loss of endoderm in double mutants. To further explore the gene regulatory networks (GRNs) governing endoderm formation, we identified targets of Ta/Tbx16-regulated homeodomain transcription factor Mixl1, which is absolutely required in zebrafish for endoderm formation. Interestingly, we find many endodermal determinants coordinately regulated through common genomic occupancy by Mixl1, Eomesa, Smad2, Nanog, Mxtx2, and Pou5f3. Collectively, these findings augment the endoderm GRN and reveal a panel of target genes underlying the Ta, Tbx16, and Mixl1 mutant phenotypes.

Keywords: ChIP-seq; T-box; endoderm; redundancy; transcription.


Figures

None
Graphical abstract
Figure 1
Figure 1
Genome-wide Analysis of Ta and Tbx16 Binding Sites (A) Summary of the expression of the endodermal regulators (or their upstream activator) for which ChIP data are presented. Bars indicate the temporal expression window of factors at the margin, color coded per factor as in subsequent figures. Datasets indicated are ChIP-seq: Smad2 (regulated by Ndr1/2) and Eomesa at 3.3–4 hpf; Nanog and Mxtx2 at 3.3 and 4.3 hpf; Pou5f3 at 5 hpf; Mixl1 at 4.7–5.3 hpf; Ta and Tbx16 at 8–8.5 hpf; and histones at 8.25 hpf. ChIP-qPCR are Smad2, Eomesa, Mixl1, Ta, and Tbx16 at 5.3 hpf and Ta and Tbx16 at 8–8.5 hpf. (B) Overlap of Ta and Tbx16 ChIP-seq peaks at 75%–85% epiboly (8–8.5 hpf). (C) Closest match to the consensus T-box binding site identified within each peak class. Percentage of peaks containing such a sequence is indicated. (D) Occurrences of motifs indicated in (C) within each peak of each class. Boxplots intervals are 10th, 25th, median, 75th, and 90th percentiles. (E) Percentage of peaks in each class overlapping histone marks. †p = 3 × 10−19; ††p = 4 × 10−89; †††p = 9 × 10−119, chi-square test. See also Figure S1. (F) Closest match to the canonical T-box binding site identified within each class of peak overlapping histone marks with percentage of peaks containing such sequences indicated. (G) Stage-matched Ta, Tbx16, H3K4me1, H3K4me3, and H3K27ac and ChIP-seq at the various genomic loci. Peak heights in reads per million (RPM) are indicated. Boxed regions indicate regions used for ChIP-qPCR validation. (H) ChIP-qPCR validation of regions indicated in (G). Data are represented as mean ± SEM.
Figure 2
Figure 2
Ta and Tbx16 Show Cell-Type-Specific Binding Profiles and Redundantly Regulate Genes Showing Common Occupancy of Both Factors (A) Enrichment for target genes with distinct Ta, Tbx16, or common binding (as indicated in Figure 1B) expressed within cell types where ta and/or tbx16 are expressed, as defined by the ZFIN database (http://www.zfin.org; Howe et al., 2013). Blue, common peaks; green, distinct Ta peaks; purple, distinct Tbx16 peaks. (B) Bar graph showing enrichment for Gene Ontology terms associated with target genes with distinct or common binding (as indicated in Figure 1B). (C) Stage-matched Ta, Tbx16, H3K4me1, H3K4me3, and H3K27ac and ChIP-seq profiles. Peak heights in RPM are indicated. Boxed regions indicate peaks used for ChIP-qPCR validation. (D) Ta (green) and Tbx16 (mauve) ChIP-qPCR validation of regions indicated in (C). Data are represented as mean ± SEM. (E–I) GSEA enrichment plots for comparison of target genes with distinct or common binding (as indicated in Figure 1B) with (E) ta KD relative to control; (F) tbx16 KD relative to control; (G) ta/tbx16 double KD relative to control; (H) ta/tbx16 double KD relative to ta KD; (I) ta/tbx16 double KD relative to tbx16 KD. Family-wise error rate (FWER) p ≤ 3 × 10−2; ∗∗FWER p ≤ 5 × 10−4.
Figure 3
Figure 3
Comparison of Ta/Tbx16 Genomic Occupancy with Eomesa/Smad2 Reveals Direct Regulation of Endodermal Determinants prior to Gastrulation (A) Overlap of Ta and Tbx16 ChIP-seq peaks at 75%–85% epiboly (8–8.5 hpf) with Eomesa at high-sphere stage (3.3–4 hpf). (B) Smad2, Eomesa, Ta, Tbx16, H3K4me1, H3K4me3, and H3K27ac ChIP-seq peaks at indicated stages proximal to mixl1, foxh1, and foxa2. Peak heights in RPM are indicated. Boxed regions indicate peaks used for ChIP-qPCR validation. (C) ChIP-qPCR analysis of regions indicated in (B) at the indicated stages. Data are represented as mean ± SEM.
Figure 4
Figure 4
Loss of Ta and Tbx16 Leads to Downregulation of Endodermal Specifiers and Reduction of Endodermal Progenitors during Gastrulation (A) qPCR analysis of mixl1, gata5, and sox32 at 50% epiboly (5.3 hpf) in single and double ta/tbx16 morphants. All genes are significantly downregulated in double morphants; p ≤ 5 × 10−2; Student’s t test. Data are represented as mean ± SEM. See also Figure S2. (B) WISH analysis of sox32 in single and double morphants at germ ring stage (5.7 hpf). Arrowhead, YSL expression; , loss of endoderm expression. (C) Microarray analysis at 90% epiboly (9 hpf) indicates downregulation of cxcl12a/b. Data are represented as mean ± SEM. (D) Immunological and WISH analysis of a sox17:eGFP transgene and endogenous sox17 expression at 90% epiboly (9 hpf) in single and double morphants. (E) Cell numbers identified by immunostaining and WISH in (D). Cell numbers are representative of at least 20 embryos per condition. p ≤ 1 × 10−8; ∗∗p ≤ 1 × 10−20; Student’s t test. Data are represented as mean ± SEM. See also Figure S3.
Figure 5
Figure 5
Ta and Tbx16 Are Redundantly Required for Liver, Pancreas, and Gut Development (A) GFP immunostaining in single and double morphant sox17:eGFP transgenic fish at 24 hpf and WISH analysis of broad endodermal organ marker foxa3, pancreas marker ins, and liver marker cp at 52–56 hpf in single and double morphants. l, liver; p, pancreas; s, stomach. Phenotypic classes as defined in (B) are indicated. (B) Percentage of KD embryos in each phenotypic class identified by WISH. Compare with Figure S3D. Graphs represent 19–124 embryos per group. (C) Genetic crosses and expected embryonic genotypes. Ta-enhanced (ta−/−;tbx16+/−) and tbx16-enhanced (ta+/−;tbx16−/−) genotypes are indicated. (D) Phenotypic classes of embryos from genetic crosses indicated in (C) identified by WISH. Arrowheads indicate liver cp staining. (E) Percentage of embryos in each phenotypic class from each genetic cross identified by WISH. Graphs represent 31–175 embryos per group. p ≤ 3 × 10−2; ∗∗p ≤ 5 × 10−3; ∗∗∗p ≤ 1 × 10−4; all other comparisons with wild-type are not significant (p = 0.1–1); Fisher’s exact test. See also Figure S3.
Figure 6
Figure 6
Mixl1 Occupies the Same Sites as Smad2 and Eomesa Proximal to Nodal-Responsive Endodermal Genes (A) Motif identified within Mixl1 ChIP-seq peaks using DREME; e = 2.7 × 10−19; p = 7.1 × 10−24. (B) Overlap of Eomesa and Smad2 ChIP-seq peaks at high-sphere stage (3.3–4 hpf) with Mixl1 peaks at 30%–50% epiboly (4.7–5.3 hpf). Endodermal regulators with occupancy of TFs are indicated. (C) Enrichment for genes with Eomesa and/or Smad2 and/or Mixl1 proximal binding (as indicated in B). The graph shows enrichment for cell types where ndr1 and/or ndr2 are expressed. (D) Smad2, Eomesa, Mixl1, H3K4me1, H3K4me3, and H3K27ac ChIP-seq at indicated stages proximal to tbx16, gata5, sox32, mixl1, foxa3, and pou5f3. Peak heights in reads per million (RPM) are indicated. Boxed regions indicate peaks used for ChIP-qPCR validation. (E) ChIP-qPCR analysis of regions indicated in (D) at 50% epiboly (5.3 hpf). Data are represented as mean ± SEM. (F and G) GSEA plots of genes with proximal binding of Mixl1 alone or at the same CRMs as Eomesa and/or Smad2 (defined and color-coded as in B) compared with microarray data: (F) changes in expression on ndr1 overexpression in blastulae—Mixl1 binding with Eomesa and/or Smad2 is highly correlated with genes induced by Ndr1; (G) changes in expression on ta/tbx16 KD at shield (6 hpf)—Mixl1 binding with Eomesa and Smad2 is highly correlated with downregulated genes. FWER p ≤ 2 × 10−2; ∗∗FWER p ≤ 1 × 10−3; ∗∗∗FWER p ≤ 5 × 10−4. (H) Overlap of genes with occupancy of Mixl1 with Eomesa and/or Smad2 upregulated by Ndr1 (identified in F) or downregulated in Ta/Tbx16 morphants (identified in G). See also Figure S4.
Figure 7
Figure 7
Nanog, Mxtx2, and Pou5f3 Occupy Sites Bound by Mixl1/Smad2/Eomesa Proximal to Key Endodermal Regulators (A) Overlap of Nanog, Smad2, and Eomesa ChIP-seq peaks at high stage (3.3 hpf). Endodermal regulators with occupancy of TFs are indicated. (B) Overlap of Nanog, Mxtx2, Pou5f3, and Mixl1 ChIP-seq peaks at 4.3–5 hpf. Endodermal regulators with occupancy of TFs are indicated. (C) A GRN for endoderm formation informed by this study. Links within the network represent binding identified by ChIP plus expression change in this or cited studies. Illustrated boxes contain the following: “midblastula”—factors implicated in mesendoderm induction, a subset of which are maternally contributed; “mesendoderm”—TFs induced at the margin between onset of zygotic transcription and gastrulation, promoting endoderm formation; “endoderm”—master regulator of zebrafish endoderm formation Sox32, which ensures endoderm fate specification; and “mesoderm”—secreted chemokines induced in at the margin and expressed by mesoderm to promote endoderm proliferation and migration. ≫ indicates ligand-receptor binding, leading to Smad2 activation. Dotted line indicates the reported minor influence of Cxcl12a compared with Cxcl12b (Boldajipour et al., 2011). See also Figures S5 and S6.

Similar articles

Cited by

References

    1. Ahn D., You K.H., Kim C.H. Evolution of the tbx6/16 subfamily genes in vertebrates: insights from zebrafish. Mol. Biol. Evol. 2012;29:3959–3983. - PubMed
    1. Amacher S.L., Draper B.W., Summers B.R., Kimmel C.B. The zebrafish T-box genes no tail and spadetail are required for development of trunk and tail mesoderm and medial floor plate. Development. 2002;129:3311–3323. - PubMed
    1. Amack J.D., Wang X., Yost H.J. Two T-box genes play independent and cooperative roles to regulate morphogenesis of ciliated Kupffer’s vesicle in zebrafish. Dev. Biol. 2007;310:196–210. - PubMed
    1. Arnold S.J., Hofmann U.K., Bikoff E.K., Robertson E.J. Pivotal roles for eomesodermin during axis formation, epithelium-to-mesenchyme transition and endoderm specification in the mouse. Development. 2008;135:501–511. - PMC - PubMed
    1. Bailey T.L. DREME: motif discovery in transcription factor ChIP-seq data. Bioinformatics. 2011;27:1653–1659. - PMC - PubMed

Publication types

Substances