. 2017 Jun 27;19(13):2836-2852.
doi: 10.1016/j.celrep.2017.06.014.

Definition of a High-Confidence Mitochondrial Proteome at Quantitative Scale

Affiliations

Definition of a High-Confidence Mitochondrial Proteome at Quantitative Scale

Marcel Morgenstern et al. Cell Rep. .

Abstract

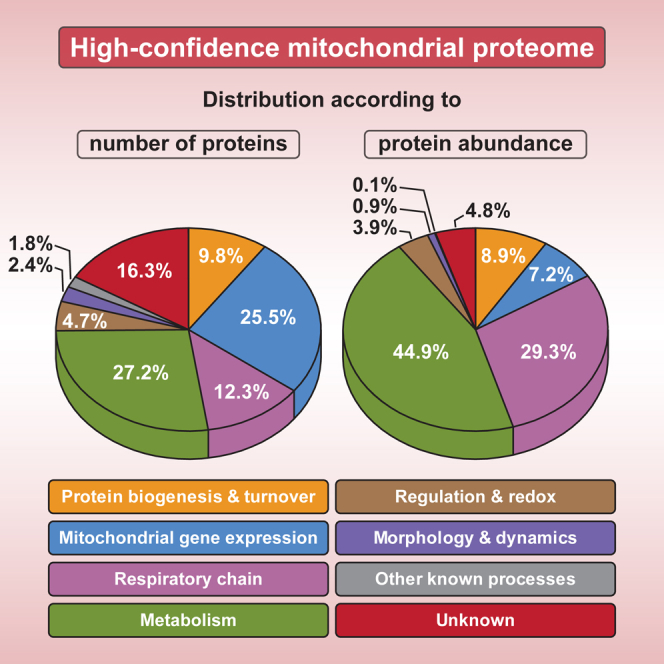
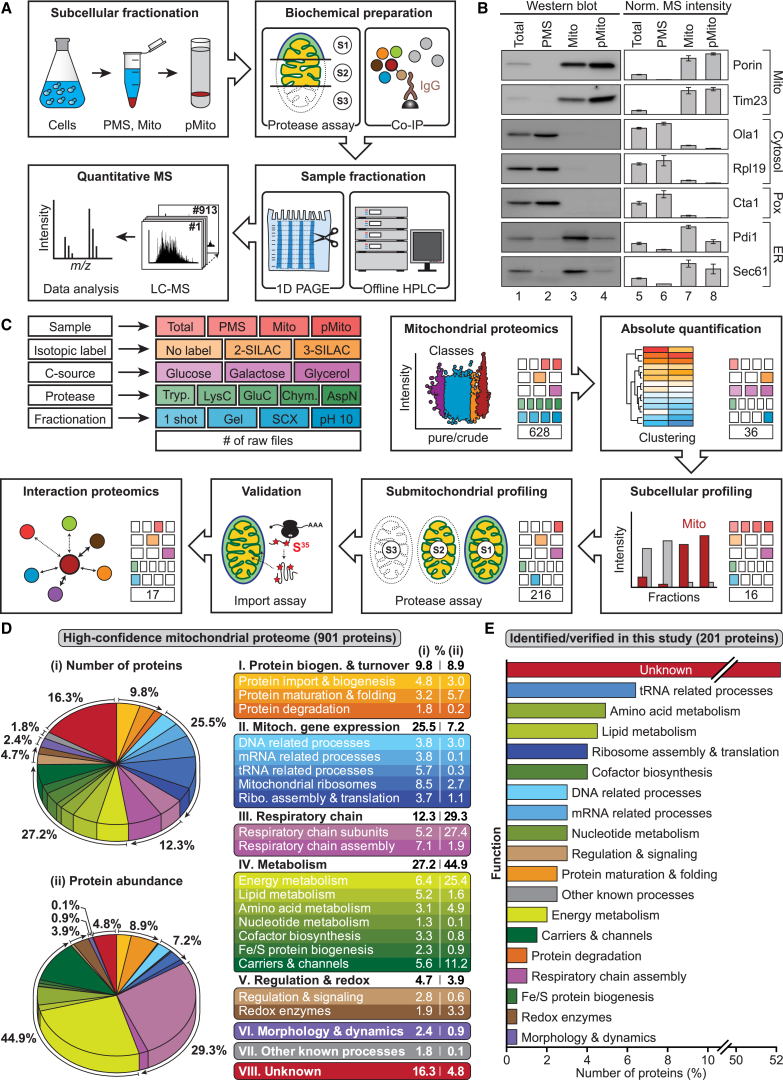
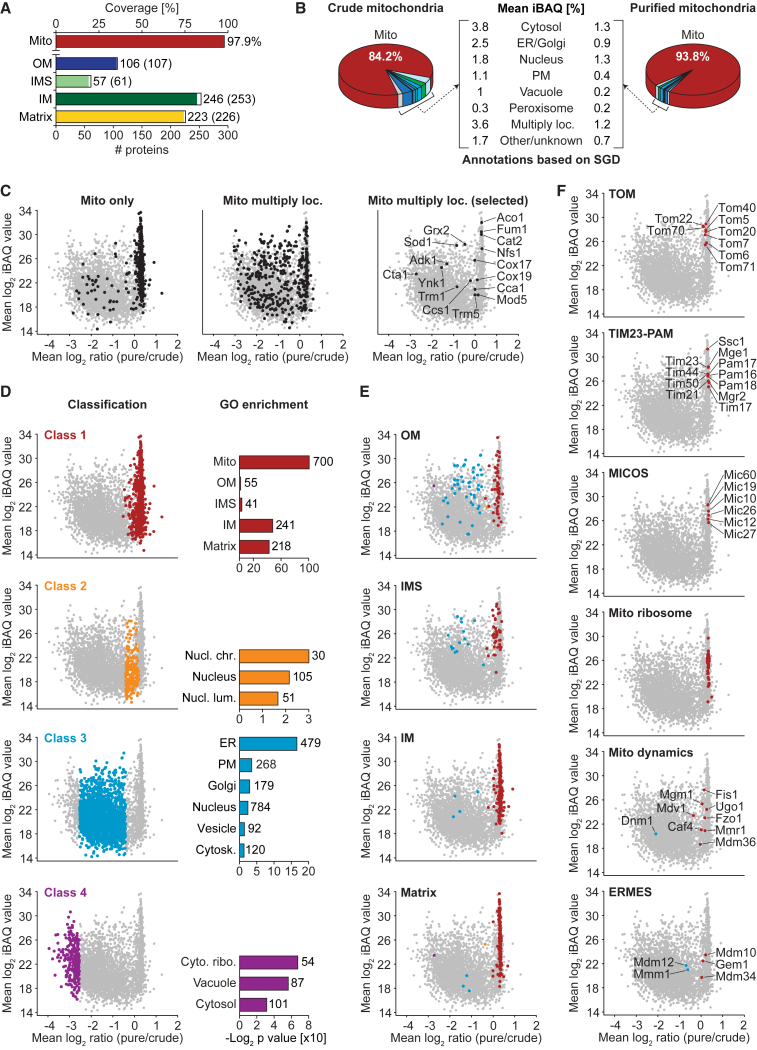
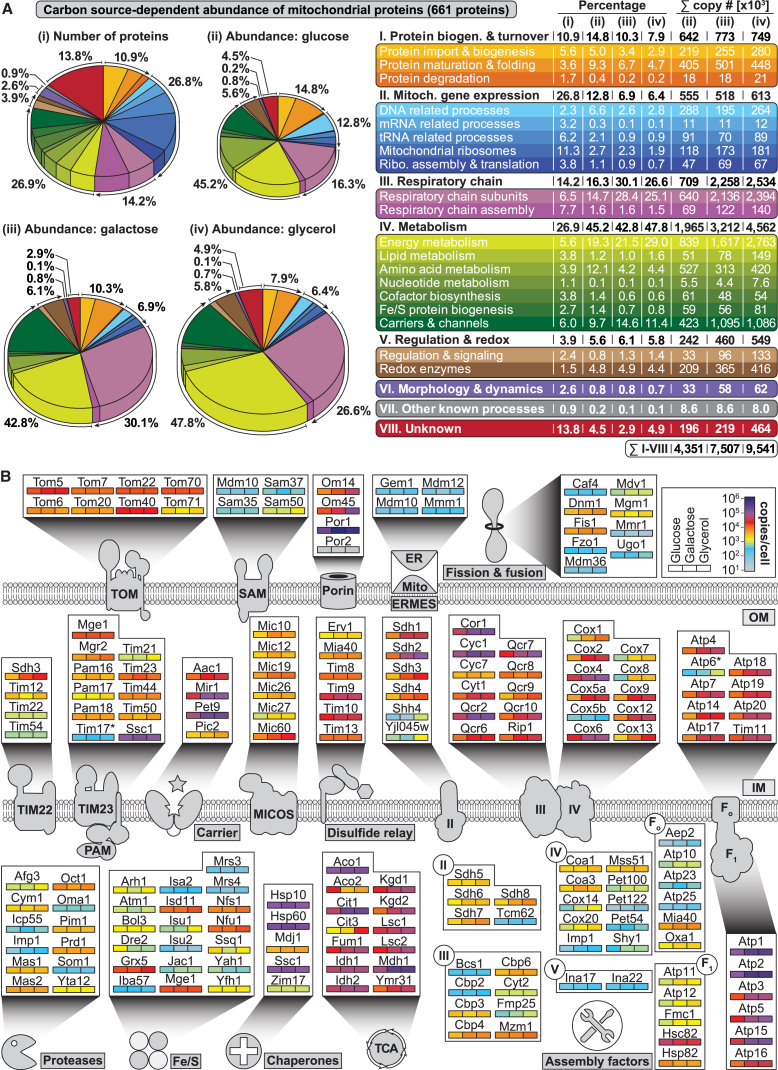
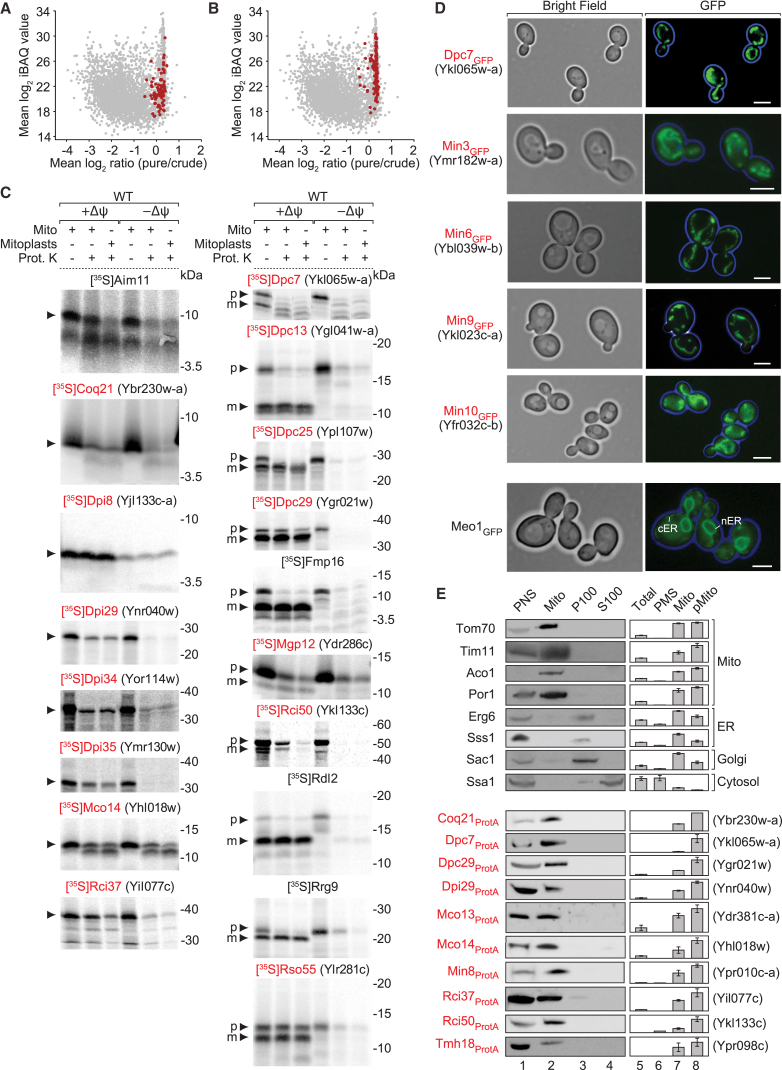
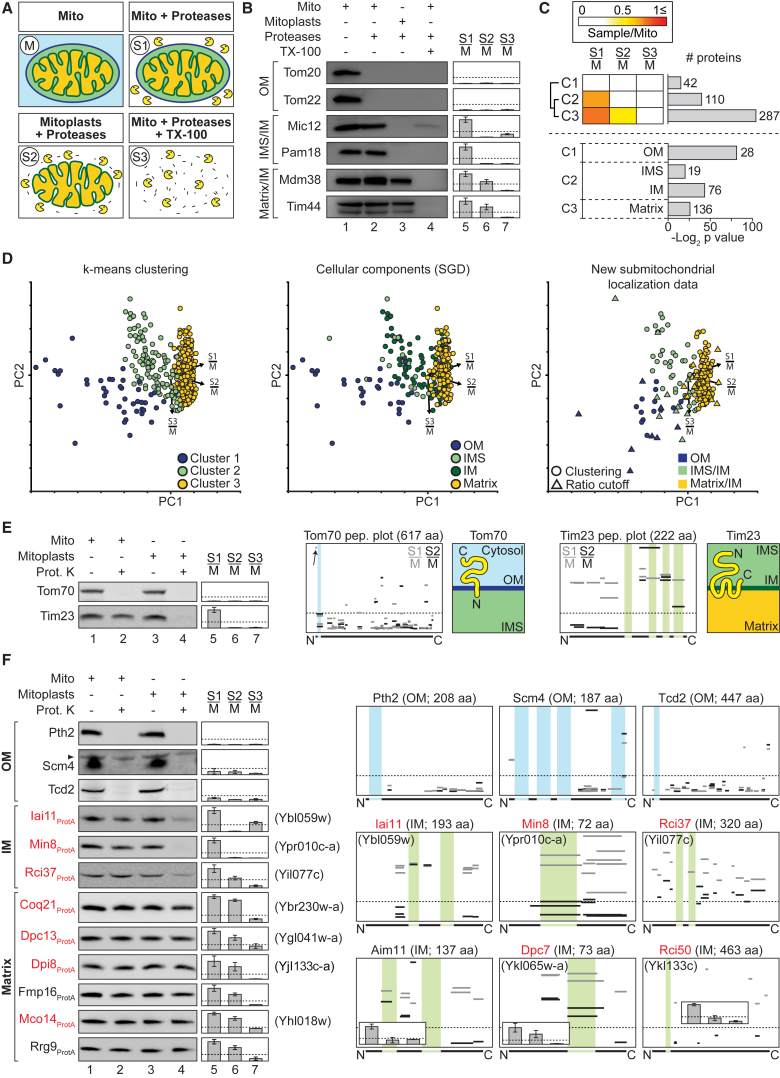
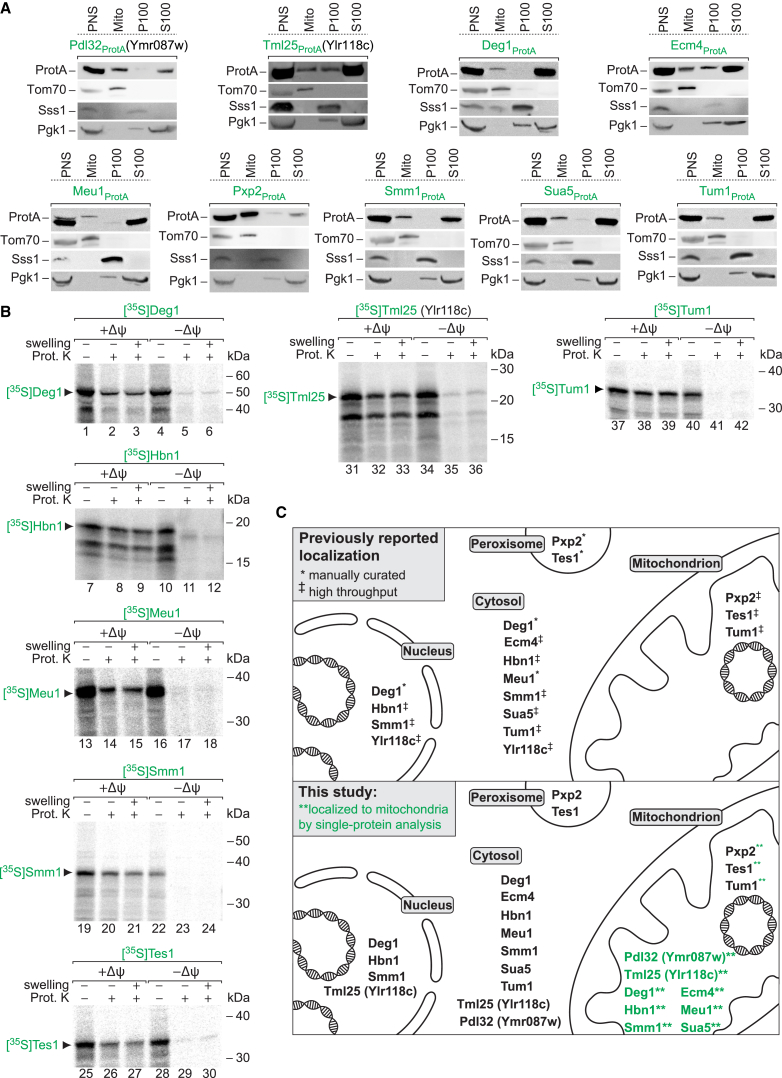
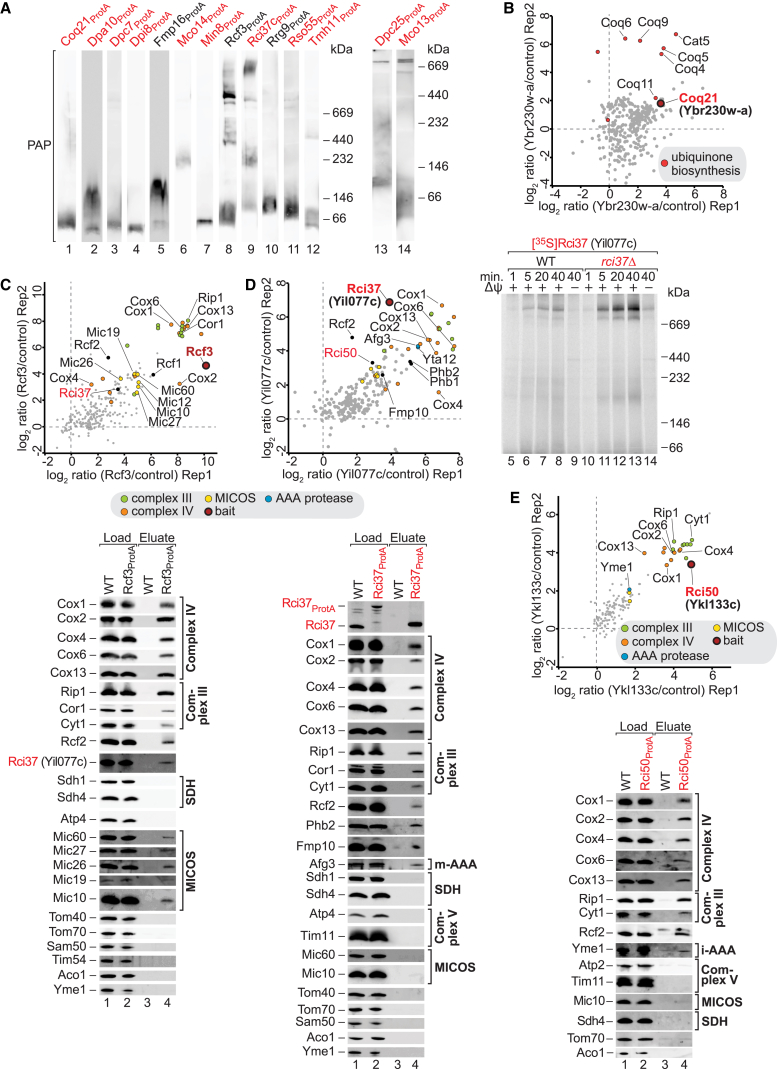
Mitochondria perform central functions in cellular bioenergetics, metabolism, and signaling, and their dysfunction has been linked to numerous diseases. The available studies cover only part of the mitochondrial proteome, and a separation of core mitochondrial proteins from associated fractions has not been achieved. We developed an integrative experimental approach to define the proteome of yeast mitochondria. We classified > 3,300 proteins of mitochondria and mitochondria-associated fractions and defined 901 high-confidence mitochondrial proteins, expanding the set of mitochondrial proteins by 82. Our analysis includes protein abundance under fermentable and nonfermentable growth, submitochondrial localization, single-protein experiments, and subcellular classification of mitochondria-associated fractions. We identified mitochondrial interactors of respiratory chain supercomplexes, ATP synthase, AAA proteases, the mitochondrial contact site and cristae organizing system (MICOS), and the coenzyme Q biosynthesis cluster, as well as mitochondrial proteins with dual cellular localization. The integrative proteome provides a high-confidence source for the characterization of physiological and pathophysiological functions of mitochondria and their integration into the cellular environment.

Keywords: SILAC; dual localization; mitochondria; protein copy numbers; protein-protein interaction; quantitative MS; subcellular localization; submitochondrial localization.


Figures

None
Graphical abstract
Figure 1
Figure 1
Multi-dimensional MS Approach for Global Profiling and In-Depth Characterization of the Mitochondrial Proteome of S. cerevisiae (A) Outline of experimental strategy. Total, cell lysate; PMS, post-mitochondrial supernatant; Mito, mitochondria; pMito, gradient-purified mitochondria. (B) Western blot (lanes 1–4) and MS data (lanes 5–8) for selected subcellular marker proteins. Error bars indicate SEM for n ≥ 3 and the range for n = 2. (C) Overview of experimental approaches followed to define and characterize mitochondrial proteins. (D) Overview of the functional classification of the high-confidence mitochondrial proteome. Relative protein quantification was based on the analysis of gradient-purified mitochondria from cells grown on glycerol. (E) Overview of the functional classification of mitochondrial proteins identified or verified in this study. See also Figure S1 and Tables S2A, S3, and S4.
Figure 2
Figure 2
Quantitative Deep Proteome Analysis of Yeast Mitochondria by SILAC-MS (A) Coverage of proteins of distinct submitochondrial localization. Proteins identified in pure/crude mitochondria were categorized as outer membrane (OM), intermembrane space (IMS), inner membrane (IM), or matrix protein based on GO annotations. Shown is the number of proteins assigned to a given term and (in parentheses) the total number of proteins with this annotation. Mito, sum of all proteins in OM, IMS, IM, and matrix. (B) Protein composition of crude versus gradient-purified mitochondria. Shown are mean percentages of intensity-based absolute quantification (iBAQ) values (n = 4). Loc., localized; PM, plasma membrane; SGD, Saccharomyces Genome Database. (C) Ratio-intensity plots of quantified proteins (n = 4). Proteins exclusively localized to mitochondria (left), to mitochondria and other organelles (middle), and selected proteins with multiple subcellular localization (right) are highlighted. (D) Distribution of proteins grouped into distinct classes by statistical data analysis (left panel) and selected GO cellular component terms significantly enriched in each class (right panel) with the number of proteins assigned. Cyto. ribo., cytosolic ribosome; Cytosk., cytoskeleton; Nucl. chr./lum., nuclear chromosome/lumen. (E and F) Ratio-intensity plots as shown in (D) highlighting mitochondrial subcompartment annotations (E) and subunits of the TOM, TIM23-PAM, MICOS, and ERMES complex as well as mitochondrial ribosomal proteins and proteins involved in mitochondrial dynamics (F). Coloring reflects the class a protein was assigned to. See also Figure S2 and Tables S1, S2A, and S5A.
Figure 3
Figure 3
Proteome-wide Absolute Quantification of Carbon Source-Dependent Protein Expression (A) Overview of the functional classification of 661 high-confidence class 1 mitochondrial proteins according to copy numbers per cell determined for three different carbon sources. The areas of the pie charts (ii), (iii), and (iv) are directly proportional to the determined copy numbers of the mitochondrial proteins. (B) Proteins of selected mitochondrial complexes, functions, or pathways and their carbon source-dependent copy numbers per cell. Colors indicate absolute mean copy numbers per cell and carbon source (n = 3). Asterisks, low sequence coverage or low quantification accuracy can lead to an underestimation of the copy number of components such as for Atp6 and Tim17. Fe/S, iron–sulfur cluster biosynthesis; FoF1, ATP synthase; TCA, tricarboxylic acid cycle; II/III/IV, complexes II/III/IV of the respiratory chain. See also Figure S3 and Table S2D.
Figure 4
Figure 4
Biochemical, Fluorescence Microscopy, and MS-Based Subcellular Localization Analysis of Mitochondrial Proteins (A and B) Ratio-intensity plots, as shown in Figures 2C–2F, highlighting proteins from Tables S4A (A) and S4B (B). (C) Protein import assays with radiolabeled mitochondrial precursor proteins. +/−Δψ, mitochondria with or without membrane potential; Prot. K, proteinase K; p, precursor; m, mature form. (D) Images of yeast cells expressing GFP-tagged proteins analyzed by fluorescence microscopy. cER/nER, cortical/nuclear ER. Scale bar, 5 μm. (E) Subcellular protein profiling. Yeast strains were subjected to subcellular fractionation followed by SDS-PAGE and immunoblotting (lanes 1–4) or quantitative MS analysis (n = 4) (lanes 5–8). Shown are data for selected marker proteins (upper panel) and proteins that were only listed as ORF in the SGD and named in this study (shown in red, lower panel). Y axes of bar charts, mean of normalized MS intensities; error bars indicate SEM for n ≥ 3 and the range for n = 2. PNS, post-nuclear supernatant; PMS, post-mitochondrial supernatant; pMito, gradient-purified mitochondria. See also Figures S4 and S5, and Tables S1 and S2A.
Figure 5
Figure 5
Profiling of Suborganellar Localization and Membrane Topology of Mitochondrial Proteins (A and B) Protease accessibility assay. Gradient-purified mitochondria (M, S1), mitoplasts (S2), and mitochondrial Triton X-100 (TX-100) lysates (S3) were treated with proteases (proteinase K and trypsin) as indicated. (B) Samples were analyzed by SDS-PAGE and immunoblotting using antisera against marker proteins of the mitochondrial outer membrane (OM), and intermembrane space (IMS)- and matrix-exposed proteins (lanes 1–4). For submitochondrial profiling, SILAC-labeled untreated mitochondria (M) and S1, S2, or S3 were mixed and analyzed by MS (n = 3) (lanes 5–7). Y axes, mean S/M protein ratios; error bars indicate SEM for n = 3 and the range for n = 2; dotted lines, S/M ratios of 0.25. IM, inner membrane. (C) Top, k-means clustering performed based on S/M ratios of proteins (n = 3) with a ratio ≤1.1 that were present in class 1 in pure/crude experiments and showed decreasing ratios with increasing accessibility of the proteases (i.e., S1/M ≥ S2/M > S3/M). Bottom, selected GO terms significantly enriched in each cluster. (D) Principal-component (PC) analysis of log2-transformed mean S/M ratios of the proteins present in the clusters depicted in (C) and further proteins meeting the criteria for signature plots. Shown are all proteins of C1–C3 (left), proteins with previous GO annotations (middle), and proteins without previous GO annotation that were assigned to mitochondrial subcompartments based on our experimental data (right). PC 1–3 account for 45.7%, 35.3%, and 19.0% of the variability in the data. Arrows point to the direction of increasing values for the different experimental conditions. (E and F) Mitochondrial sublocalization and membrane protein topology. Intact mitochondria (lanes 1 and 2) or mitoplasts (lanes 3 and 4) were treated with proteinase K (Prot. K) where indicated. Marker proteins of the mitochondrial outer (Tom70) and inner membrane (Tim23) shown in (E) belong to the fractionation of Mco8ProtA (Figure S6). Bar charts (lanes 5–7) show the corresponding S/M protein ratios. Peptide plots illustrate the topology for Tom70, Tim23 (both summarized in adjacent cartoons), and selected proteins of the high-confidence mitochondrial proteome. Plotted are S/M ratios of tryptic peptides identified in submitochondrial profiling experiments. Transmembrane segments (TMHMM prediction or according to Alder et al. [2008] for Tim23) are indicated in blue (OM) or green (IM). Y axes of bar charts and peptide plots, mean S/M ratio; dotted lines indicate S/M ratios of 0.25; error bars indicate SEM for n = 3 and the range for n = 2. See also Figure S1C and Tables S1, S2G, and S5E.
Figure 6
Figure 6
Mitochondrial Proteins with Dual Localization (A) Yeast strains expressing proteins with a protein A tag previously reported to localize to the cytosol, nucleus, or peroxisome were subjected to subcellular fractionation as described in Figure 4E. (B) 35S-labeled proteins were incubated with isolated wild-type mitochondria in the presence (+Δψ) or absence (−Δψ) of a membrane potential. Where indicated, mitochondria were subjected to hypoosmotic swelling and/or proteinase K (Prot. K) treatment. (C) Schematic representation of the previously reported subcellular localization of selected proteins (upper panel). In this study, all proteins were additionally found in mitochondria by quantitative MS (Tables S4A and S4B) and single-protein analysis (lower panel). ‡/, subcellular localization reported from high-throughput studies/manual curation (SGD). See also Tables S1, S2, and S7.
Figure 7
Figure 7
Mitochondrial Protein Interaction Networks (A) Mitochondria isolated from indicated yeast strains were analyzed by blue native gel electrophoresis using 3%–13% (lanes 1–13) or 6%–16.5% (lanes 14–16) discontinuous polyacrylamide gels. (B) Coq21 interaction network identified by SILAC q-AP-MS (n = 2). (C–E) Rcf3, Rci37, and Rci50 interaction networks identified by SILAC q-AP-MS (n = 2 each). In addition, IgG chromatography eluates were analyzed by SDS-PAGE and immunoblotting using the indicated antisera. Load = 5% (C and D) or 0.4% (E); eluate = 100%. (D, lanes 5–14) 35S-labeled Yil077c was imported into mitochondria isolated from wild-type (WT) or yil077cΔ strains for the indicated periods at 25°C and subsequently treated with proteinase K. Where indicated (−Δψ), the membrane potential was dissipated prior to import reactions. Samples were solubilized with 1% digitonin and analyzed by blue native gel electrophoresis and digital autoradiography. See also Figure S7 and Tables S2J and S6.

References

    1. Alder N.N., Jensen R.E., Johnson A.E. Fluorescence mapping of mitochondrial TIM23 complex reveals a water-facing, substrate-interacting helix surface. Cell. 2008;134:439–450. - PubMed
    1. Arnold I., Pfeiffer K., Neupert W., Stuart R.A., Schägger H. Yeast mitochondrial F1F0-ATP synthase exists as a dimer: identification of three dimer-specific subunits. EMBO J. 1998;17:7170–7178. - PMC - PubMed
    1. Barbot M., Jans D.C., Schulz C., Denkert N., Kroppen B., Hoppert M., Jakobs S., Meinecke M. Mic10 oligomerizes to bend mitochondrial inner membranes at cristae junctions. Cell Metab. 2015;21:756–763. - PubMed
    1. Becker T., Wenz L.-S., Krüger V., Lehmann W., Müller J.M., Goroncy L., Zufall N., Lithgow T., Guiard B., Chacinska A. The mitochondrial import protein Mim1 promotes biogenesis of multispanning outer membrane proteins. J. Cell Biol. 2011;194:387–395. - PMC - PubMed
    1. Bohnert M., Zerbes R.M., Davies K.M., Mühleip A.W., Rampelt H., Horvath S.E., Boenke T., Kram A., Perschil I., Veenhuis M. Central role of Mic10 in the mitochondrial contact site and cristae organizing system. Cell Metab. 2015;21:747–755. - PubMed