. 2017 Aug 7;216(8):2425-2442.
doi: 10.1083/jcb.201612129. Epub 2017 Jun 28.

Characterization of spindle pole body duplication reveals a regulatory role for nuclear pore complexes

Affiliations

Characterization of spindle pole body duplication reveals a regulatory role for nuclear pore complexes

Diana Rüthnick et al. J Cell Biol. .

Abstract

The spindle pole body (SPB) of budding yeast duplicates once per cell cycle. In G1, the satellite, an SPB precursor, assembles next to the mother SPB (mSPB) on the cytoplasmic side of the nuclear envelope (NE). How the growing satellite subsequently inserts into the NE is an open question. To address this, we have uncoupled satellite growth from NE insertion. We show that the bridge structure that separates the mSPB from the satellite is a distance holder that prevents deleterious fusion of both structures. Binding of the γ-tubulin receptor Spc110 to the central plaque from within the nucleus is important for NE insertion of the new SPB. Moreover, we provide evidence that a nuclear pore complex associates with the duplicating SPB and helps to insert the SPB into the NE. After SPB insertion, membrane-associated proteins including the conserved Ndc1 encircle the SPB and retain it within the NE. Thus, uncoupling SPB growth from NE insertion unmasks functions of the duplication machinery.


Figures

Figure 1.
Figure 1.
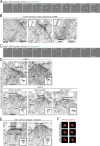
The upright orientation of the satellite. (A) Experimental outline. (B) SIM analysis in α-factor–arrested and SPC42 SPC29 OE–induced (+Gal) cells. White (mSPB) and yellow (satellite) dashed lines indicate the plot profile measurements in C. Bars: (main images) 2 µm; (insets) 500 nm. (C) Exemplary FWHM quantification of the plot profiles from B. (D) FWHM quantifications of B. Error bars indicate SD. n ≥ 30. (E) EM analysis of α-factor–arrested cells upon SPC42 or SPC42 SPC29 OE. Cartoons illustrate SPB phenotypes. (F) Representative EM images of WT cells and noninduced pGal1-SPC42 pGal1-SPC29 cells arrested in α-factor. (E and F) The length of the obelisk and satellite was quantified. Numbers of cells ± SD. Bars: (main images) 200 nm; (insets) 50 nm. B, bridge; cMT, cytoplasmic MT; N, nucleus; nMT, nuclear MT; S, satellite.
Figure 2.
Figure 2.
The bridge serves as an insulator. (A) EM micrographs of cells (45 min SPC42 SPC29 OE in α-factor and then 30 min release). Cartoons illustrate SPB phenotypes. Bars, 200 nm. (B) Sch­ematic view of Sfi1 WT and sfi1Δ6 proteins. Cells were arrested in α-factor for Spc42-yeGFP intensity measurement. n ≥ 50. (C) Exemplary SIM images of SFI1 and sfi1Δ6 cells arrested in α-factor. Orange lines indicate how the plot profiles were generated. Gray lines in the plot profiles show the distance between two peaks. Quantification of the mSPB satellite distance. SFI1: n = 52; sfi1Δ6: n = 9. Error bars indicate SD. ***, P < 0.0001. Bars: (main images) 2 µm; (insets) 500 nm. (D) EM micrograph of an α-factor–arrested sfi1Δ6 cell. Bars: (main images) 200 nm; (insets) 50 nm. (E) Western blot verification of Spc42 OE and quantification of phenotypes from live-cell imaging. Mean of two experiments with >200 cells analyzed for each experiment per time point. Error bars indicate SD. (F) Live-cell imaging of MATα SPC42-mTurquoise cells mating with MATa SPC42-mNeonGreen cells. Representative cells are shown together with signal intensity quantification. (G) Accepter photobleaching at different stages of mating. FRET efficiency was calculated. Bars: (main images) 5 µm; (insets) 500 nm. B, bridge; cMT, cytoplasmic MT; N, nucleus; nMT, nuclear MT; RFI, relative fluorescence intensity; S, satellite.
Figure 3.
Figure 3.
Insertion phenotypes. (A–F) Cells arrested with α-factor followed by SPC42 SPC29 OE for 45 min before release into cell cycle. (A and C) Live-cell imaging for 90 min after release. (B, D, and E) EM was conducted after 30-min (B and D) or 120-min release (E). Cartoons illustrate the state of the SPB. (F) Representative SIM images of SPC42-mCherry in SPC42 SPC29 OE cells after 120 min release. Bars: (A and C) 4 µm; (D and E) 200 nm; (F) 500 nm. B, bridge; N, nucleus; nMT, nuclear MT; S, satellite.
Figure 4.
Figure 4.
Localization of the SPIN components upon NE insertion of the Spc42–Spc29 obelisk. (A) Fluorescence intensity quantification of the yeGFP signal of indicated proteins at the SPB after release from the G1 block in WT cells (shaded portions in graphs) and cells upon 45 min SPC42 SPC29 OE (scatter plot). Error bars indicate SD; n ≥ 50. The black horizontal line indicates the maximum yeGFP intensity at the duplicated SPB without SPC42 SPC29 OE. RFI, relative fluorescence intensity. (B) SIM images of SPC42 SPC29 OE cells in α-factor arrest and after 120 min release. Bars: (main images) 2 µm; (insets) 500 nm.
Figure 5.
Figure 5.
Analysis of SPB duplication mutants. (A) Experimental outline. (B) Fluorescence intensity quantification for Tub4-yeGFP in spc110-124 mutant cells (scatter plot) in comparison to SPC110 WT (shaded portion in graph) upon 45 min SPC42 SPC29 OE. Error bars indicate SD. n ≥ 50. (C and D) Representative EM micrographs of SPC110 WT (C) and spc110-124 (D) cells 60 min after cell cycle release from α-factor arrest and SPC42 SPC29 OE. (E) EM micrographs of SPIN ts mutant cells after G1 block, SPC42 SPC29 OE, and 60 min release. (C–E) Cartoons illustrate SPB phenotypes. Bars, 200 nm. B, bridge; cMT, cytoplasmic MT; N, nucleus; nMT, nuclear MT; RFI, relative fluorescence intensity.
Figure 6.
Figure 6.
NPC cluster mutant analysis and Nsp1 immuno-EM. (A) NIC96-yeGFP SPC42-mCherry cells were analyzed in NPC cluster mutant cells. Representative images from live-cell microscopy are shown in the maximum projection and an SPB enlargement in single plane. Bars: (main images) 5 µm; (insets) 500 nm. (B) Live-cell microscopy of the NIC96-yeGFP SPC42-mCherry Δnup133 cell from A. Arrows indicate times of no colocalization of SPB and NPC clusters. Bars: (main images) 5 µm; (insets) 1 µm. (C) SPC42-mCherry Δnup133 were tagged with NPC-yeGFP to analyze the occupancy of NPC subclusters close to the SPB. Bars: (main images) 5 µm; (insets) 500 nm. FG, phenylalanine-glycine repeat; Nup, nucleoporin. (D and E) Immuno-EM analysis with α-Nsp1 antibody of WT cells arrested with α-factor (D) and cln1,2Δ pGal1-CLN3–depleted G1-arrested cells (E). Note that the bridge in D with the satellite and the anti-Nsp1 NPC signal is shown in the first serial section; the mSPB was detected in the second serial section. Bars: (main images) 200 nm; (insets) 50 nm. B, bridge; cMT, cytoplasmic MT; nMT, nuclear MT; S, satellite.
Figure 7.
Figure 7.
Localization of NPCs in proximity to duplicating SPBs. (A) Immuno-EM analysis with α-Nsp1 antibody of SPC42 SPC29 OE cells with 45 min induction during α-factor arrest and after release into the cell cycle. EM enlargements on the right show NPCs labeled by the α-Nsp1 antibody from the NE of the “inserted fusion SPB” cell. Cartoons illustrate SPB phenotypes and gold particles (pink). B, bridge; N, nucleus; nMT, nuclear MT; S, satellite. Bars: (main images) 200 nm; (insets) 50 nm. (B) Phenotype analysis of EM images (Figs. 1, 2, and 3). n > 100 for the entire dataset. (C) Quantification of EM micrographs categorized according to their phenotypes and analyzed for the distance between the mSPB/satellite and NPCs. In the three bottom categories, the G1 block was released. n, number of analyzed SPBs. Red-encircled numbers indicate NPCs (%) at the distal end of the bridge. (D) Representative images and quantification of SIM analysis in SPC42-yeGFP NIC96-tdTomato WT cells in α-factor arrest and upon release. n ≥ 30. Bars: (main images) 2 µm; (insets) 500 nm.
Figure 8.
Figure 8.
NPC auxin depletion experiment. (A) Growth of strains. (B) Western blot after treatment with EtOH or 1 mM auxin. Tubulin was used as a loading control. (C, top) Experimental design. (Left) SPB splitting was analyzed based on Spc42-mCherry signal. Two independent experiments. n > 50. (Right) Spc110-yeGFP recruitment was quantified to measure the time of dSPB NE insertion. The gray bar indicates budding. mSPBs and dSPBs were quantified separately after their separation (42 and 63 min). n > 20. (D, top) Outline of experiment. Spc110-yeGFP recruitment was analyzed in cells with SPB fusion (left) and cells with splitting SPBs (right). Gray bars indicate time of budding. (Right) The signals of the mSPB and dSPB are indicated after SPB separation in the right graph (40 and 55 min). n > 50 (left) and ≥ 20 (right). Error bars indicate SD. RFI, reflective fluorescence intensity.
Figure 9.
Figure 9.
NPC clustering. (A) Model showing how cells were arrested with α-factor followed by GBP–β-galactosidase–GBP cross-links of NPCs. (B) Drop test of strains (10-fold serial dilutions). LEU, leucin. (C) Western blot analysis to confirm construct expression. (D) Quantification of the SPB splitting in cells overexpressing GBP–LacZ–GBP for 45 min or 90 min in α-factor–arrested cells normalized to budding (t = 0). At least two individual experiments. Error bars indicate SD. n ≥ 50. (E) Exemplarily single-stack live-cell images of cells in D. Normal separation (40 min), delayed separation (60 min), and no separation are shown. Bars: (main images) 5 µm; (insets) 500 nm.

Similar articles

Cited by

References

    1. Adams I.R., and Kilmartin J.V.. 1999. Localization of core spindle pole body (SPB) components during SPB duplication in Saccharomyces cerevisiae. J. Cell Biol. 145:809–823. 10.1083/jcb.145.4.809 - DOI - PMC - PubMed
    1. Araki Y., Lau C.K., Maekawa H., Jaspersen S.L., Giddings T.H. Jr., Schiebel E., and Winey M.. 2006. The Saccharomyces cerevisiae spindle pole body (SPB) component Nbp1p is required for SPB membrane insertion and interacts with the integral membrane proteins Ndc1p and Mps2p. Mol. Biol. Cell. 17:1959–1970. 10.1091/mbc.E05-07-0668 - DOI - PMC - PubMed
    1. Bullitt E., Rout M.P., Kilmartin J.V., and Akey C.W.. 1997. The yeast spindle pole body is assembled around a central crystal of Spc42p. Cell. 89:1077–1086. 10.1016/S0092-8674(00)80295-0 - DOI - PubMed
    1. Burns S., Avena J.S., Unruh J.R., Yu Z., Smith S.E., Slaughter B.D., Winey M., and Jaspersen S.L.. 2015. Structured illumination with particle averaging reveals novel roles for yeast centrosome components during duplication. eLife. 4:e08586 10.7554/eLife.08586 - DOI - PMC - PubMed
    1. Byers B.1981a Multiple roles of the spindle pole bodies in the life cycle of Saccharomyces cerevisiae. In Molecular Genetics in Yeast. Vol. 16. D. Wettstein, A. Stenderup, M. Kielland-Brandt, and J. Friis, editors. Alfred Benzon Symp., Munksgaard, Copenhagen. 119-133.

MeSH terms

LinkOut - more resources