. 2017 Jun;7(6):170114.
doi: 10.1098/rsob.170114.

CEP19 cooperates with FOP and CEP350 to drive early steps in the ciliogenesis programme

Affiliations

CEP19 cooperates with FOP and CEP350 to drive early steps in the ciliogenesis programme

Bahareh A Mojarad et al. Open Biol. 2017 Jun.

Abstract

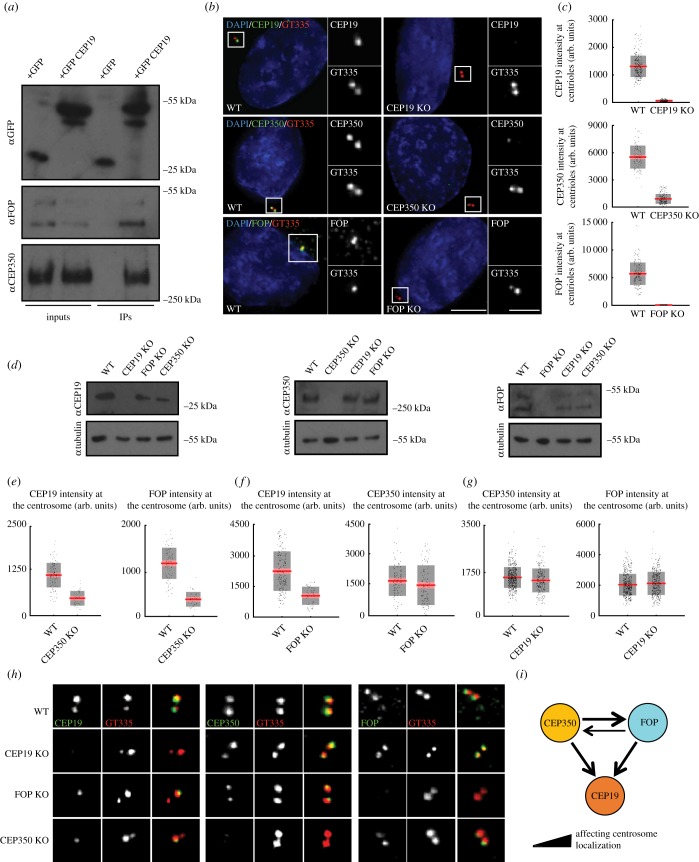
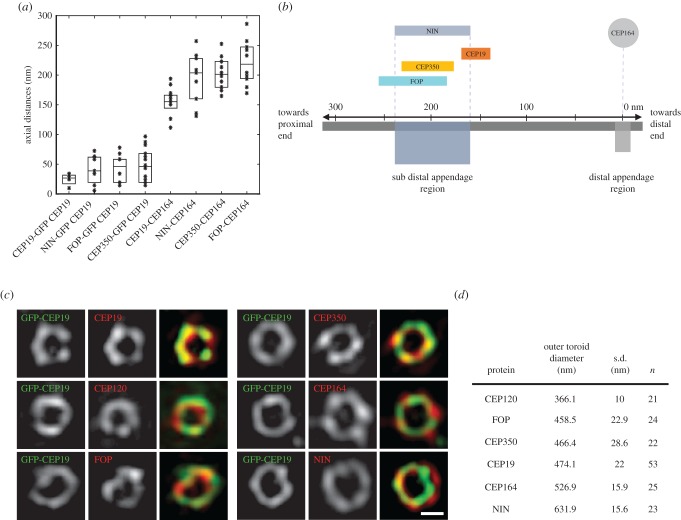
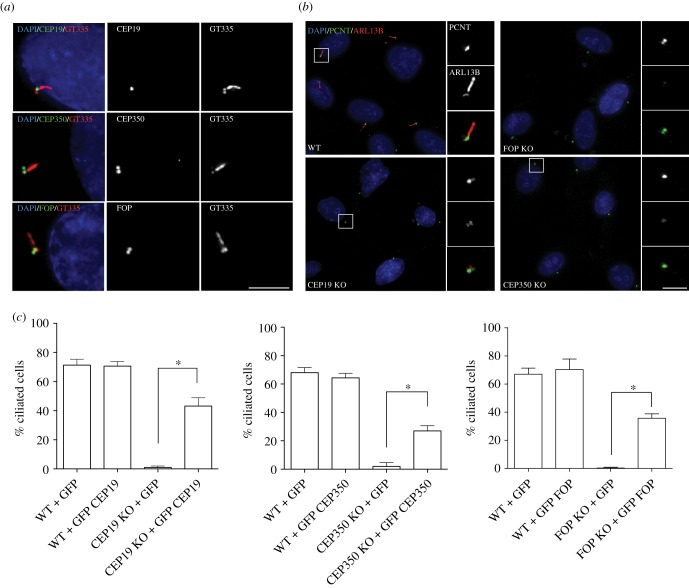
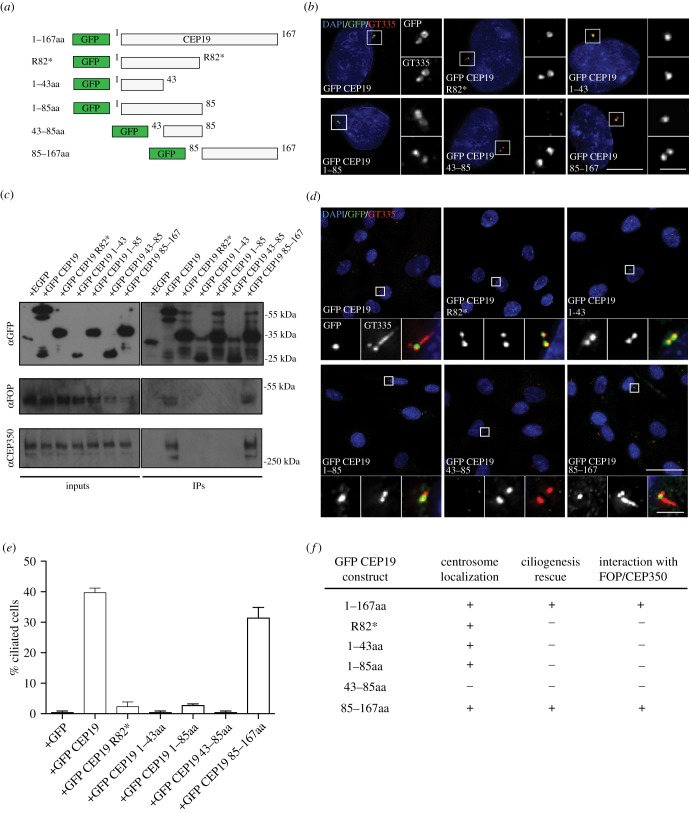
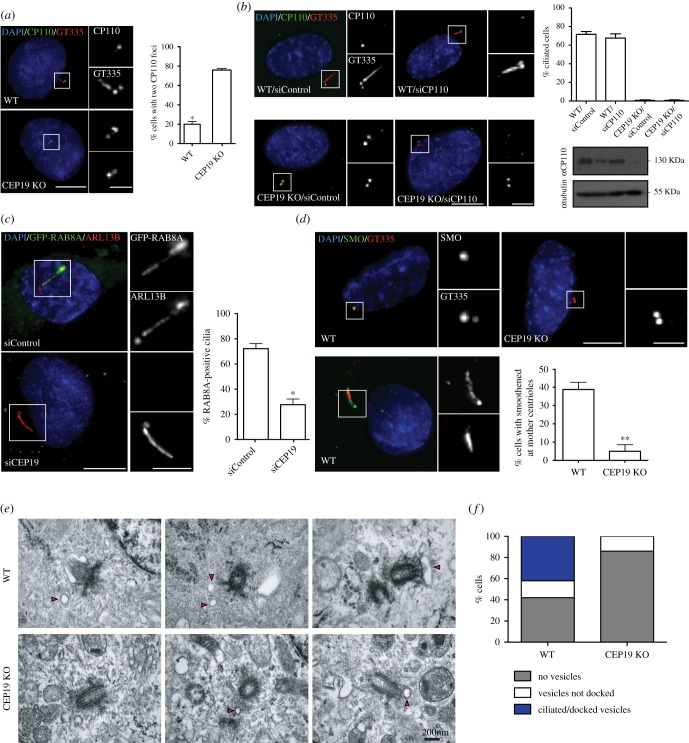
Primary cilia are microtubule-based sensory organelles necessary for efficient transduction of extracellular cues. To initiate cilia formation, ciliary vesicles (CVs) are transported to the vicinity of the centrosome where they dock to the distal end of the mother centriole and fuse to initiate cilium assembly. However, to this date, the early steps in cilia formation remain incompletely understood. Here, we demonstrate functional interplay between CEP19, FOP and CEP350 in ciliogenesis. Using three-dimensional structured-illumination microscopy (3D-SIM) imaging, we mapped the relative spatial distribution of these proteins at the distal end of the mother centriole and show that CEP350/FOP act upstream of CEP19 in their recruitment hierarchy. We demonstrate that CEP19 CRISPR KO cells are severely impaired in their ability to form cilia, analogous to the loss of function of CEP19 binding partners FOP and CEP350. Notably, in the absence of CEP19 microtubule anchoring at centromes is similar in manner to its interaction partners FOP and CEP350. Using GFP-tagged deletion constructs of CEP19, we show that the C-terminus of CEP19 is required for both its localization to centrioles and for its function in ciliogenesis. Critically, this region also mediates the interaction between CEP19 and FOP/CEP350. Interestingly, a morbid-obesity-associated R82* truncated mutant of CEP19 cannot ciliate nor interact with FOP and CEP350, indicative of a putative role for CEP19 in ciliopathies. Finally, analysis of CEP19 KO cells using thin-section electron microscopy revealed marked defects in the docking of CVs to the distal end of the mother centrioles. Together, these data demonstrate a role for the CEP19, FOP and CEP350 module in ciliogenesis and the possible effect of disrupting their functions in ciliopathies.

Keywords: centrioles; centrosomes; cilia; ciliopathies; super-resolution microscopy.


Conflict of interest statement

We declare we have no competing interests.

Figures

Figure 1.
Figure 1.
CEP19, FOP and CEP350 interact and localize to the distal end of centrioles. (a) GFP-CEP19 interacts with endogenous FOP and CEP350. (b) Generation of CRISPR KO RPE-1 cell lines for CEP19, FOP and CEP350. IF micrographs of WT and knockout RPE-1 cells probed with the indicated antibodies and counterstained with DAPI. Scale bar, 5 µm. Insets 1 µm. (c) Mean fluorescence intensity of the indicated proteins at the centrosome in WT, CEP19, CEP350 and FOP KO RPE-1 cell lines. Grey region denotes 2 s.d. from the mean (red line), pink region denotes 95% confidence interval. (d) Western blots confirming the loss of expression of the indicated proteins. (e) Quantification of the mean fluorescence intensity of the indicated protein in CEP350 KO RPE-1 cell line. (f) Quantification of the mean fluorescence intensity of the indicated protein in FOP KO RPE-1 cell line. (g) Quantification of the mean fluorescence intensity of the indicated protein in CEP19 KO RPE-1 cell line. (h) CEP19 localization to the centrioles is dependent on FOP and CEP350. (i) Assembly pathway of CEP19, FOP and CEP350.
Figure 2.
Figure 2.
Three-dimensional SIM-based localization of CEP19, FOP and CEP350 at the distal end of the centrioles. (a) Axial distance of indicated proteins with respect to GFP-CEP19, or CEP164 (the median together with the 25% and 75% quantiles are shown for each category; n > 10). (b) Schematic overview of relative localization of indicated proteins along the length of the centriole in HeLa cells. (c) Three-dimensional SIM micrographs of centrioles immuno-labelled with GFP-CEP19 (in green, imaged at 488 nm), indicated centriolar proteins (in red, imaged at either 568 or 642 nm) and merged channels. Scale bar, 250 nm. (d) Table summarizing the outer ring diameter of the indicated proteins.
Figure 3.
Figure 3.
CEP19, FOP and CEP350 are required for ciliogenesis. (a) CEP19, FOP and CEP350 localize to the basal body in serum-starved WT RPE-1 cells. Scale bar, 5 µm. (b) IF micrographs of CEP19, FOP and CEP350 KO and WT RPE-1 cell lines upon serum starvation. Main merged panels are immuno-labelled with PCNT (green), ARL13B (red) and counterstained with DAPI (blue), corresponding top and bottom insets represent PCNT and ARL13B, respectively. Scale bar, 15 µm. Insets 1 µm. (c) Expression of GFP-tagged CEP19, FOP and CEP350 rescues the defect in ciliogenesis in their respective cell lines. *p < 0.01 by Student's t-test, n > 200.
Figure 4.
Figure 4.
Mapping the centriole localization and ciliogenesis domain in CEP19. (a) Schematics of various GFP-tagged truncation fragments generated for CEP19. (b) IF micrographs representing the localization of GFP-tagged CEP19 deletion fragments in cycling WT RPE-1 cells. Main merged panels are immuno-labelled with GFP (green), GT335 (red) and counterstained with DAPI (blue), corresponding top and bottom insets represent GFP and GT335, respectively. Scale bar, 5 µm. Insets 1 µm. (c) Co-IPs showing the interaction of GFP-tagged CEP19 fragments with endogenous FOP and CEP350. (d) IF micrographs of expressed GFP-tagged CEP19 deletion fragments in serum-starved CEP19 KO cells to monitor ciliogenesis. Main merged panels are labelled with GFP (green), GT335 (red) and counterstained with DAPI (blue), corresponding left and middle insets represent GFP and GT335, respectively. Scale bar, 15 µm. Insets 1 µm. (e) Quantifications of percentage of ciliated cells in the presence of indicated GFP-tagged deletion fragments in serum-starved RPE-1 cells. (f) Summary of different CEP19 fragments generated and their ability to rescue ciliogenesis in CEP19 KO cells and interact with FOP and CEP350.
Figure 5.
Figure 5.
CEP19 is required for the early stages of ciliogenesis. (a) IF micrographs of serum-starved WT and CEP19 KO RPE-1 cells. Main merged panels are immuno-labelled with CP110 (green), GT335 (red) and counterstained with DAPI (blue), corresponding top and bottom insets represent CP110 and GT335, respectively. Graph shows the percentage of cells with two CP110 foci at the centrioles in serum-starved WT and CEP19 KO RPE-1 cells. Scale bar, 5 µm. Insets 1 µm. *p < 0.01 by Student's t-test, n > 200. (b) IF micrographs of serum-starved WT or CEP19 KO RPE-1 cells treated with non-targeting siRNA or siRNA targeting CP110. Main merged panels are immuno-labelled with CP110 (green), GT335 (red) and counterstained with DAPI (blue), corresponding top and bottom insets represent CP110 and GT335, respectively. Scale bar, 5 µm. Insets 1 µm. Top right: quantification of percentage of ciliated cells in control or CEP19 KO cells, with siControl or siCP110. Bottom right: western blot (in the same row order as graph) confirming the depletion of CP110. (c) IF micrographs of GFP-RAB8A RPE-1 cells serum-starved for 24 h. Main merged panels are immuno-labelled with GFP (green), ARL13B (red) and counterstained with DAPI (blue), corresponding top and bottom insets represent GFP and ARL13B, respectively. Graph shows percentage of GFP-RAB8A positive cilia in controls compared with CEP19-depleted RPE-1 cells. Scale bar, 5 µm. Insets 1 µm. (d) IF micrographs of serum-starved WT RPE-1 and CEP19 KO RPE-1 cells treated with SAG. Main merged panels are immuno-labelled with SMO (green), GT335 (red) and counterstained with DAPI (blue), corresponding top and bottom insets represent SMO and GT335, respectively. Graph shows percentage of cells with smoothened at the mother centriole in WT compared with CEP19 KO cells. Scale bar, 5 µm. Insets 1 µm. (e) Electron micrographs showing serial sections of WT and CEP19 KO RPE-1 cells serum-starved for 72 h. Arrowheads indicate CVs. (f) Quantification of percentage of cells with docked/undocked CVs and no vesicles in WT and CEP19 KO RPE-1 cells.

Similar articles

Cited by

References

    1. Bornens M. 2002. Centrosome composition and microtubule anchoring mechanisms. Curr. Opin. Cell Biol. 14, 25–34. (doi:10.1016/S0955-0674(01)00290-3) - DOI - PubMed
    1. Anderson RGW. 1972. The three-dimensional structure of the basal body from the rhesus monkey oviiduct. J. Cell Biol. 54, 246–265. (doi:10.1083/jcb.54.2.246) - DOI - PMC - PubMed
    1. Eggenschwiler JT, Anderson KV. 2007. Cilia and developmental signaling. Annu. Rev. Cell Dev. Biol. 23, 345–373. (doi:10.1146/annurev.cellbio.23.090506.123249) - DOI - PMC - PubMed
    1. Vorobjev IA, Chentsov Yu S. 1982. Centrioles in the cell cycle. I. Epithelial cells. J. Cell Biol. 93, 938 (doi:10.1083/jcb.93.3.938) - DOI - PMC - PubMed
    1. Reiter JF, Blacque OE, Leroux MR. 2012. The base of the cilium: roles for transition fibers and the transition zone in ciliary formation, maintenance and compartmentalization. EMBO Rep. 13, 608–618. (doi:10.1038/embor.2012.73) - DOI - PMC - PubMed