

Haspin inhibition reveals functional differences of interchromatid axis-localized AURKB and AURKC
- PMID: 28659416
- PMCID: PMC5555651
- DOI: 10.1091/mbc.E16-12-0850
Haspin inhibition reveals functional differences of interchromatid axis-localized AURKB and AURKC
Abstract
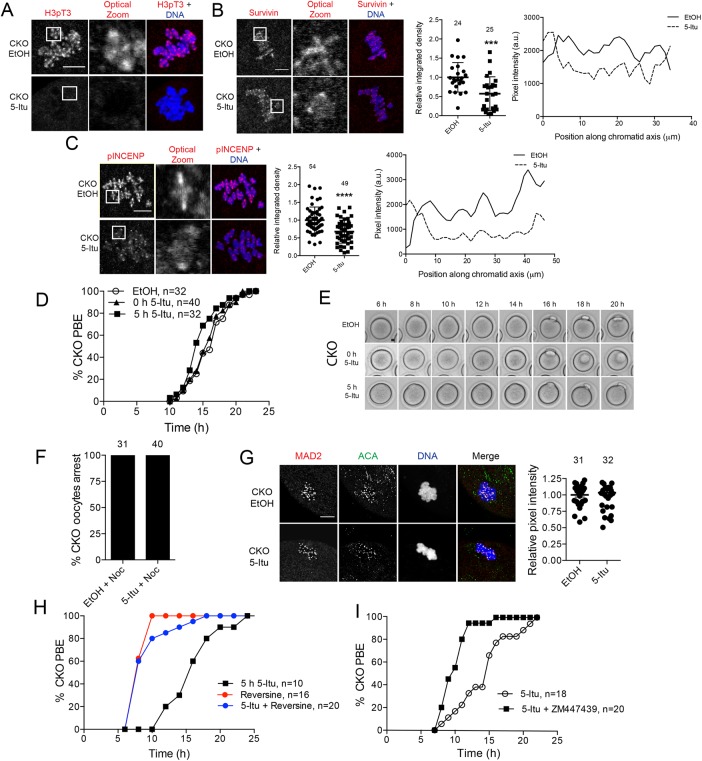
Aneuploidy is the leading genetic abnormality contributing to infertility, and chromosome segregation errors are common during female mammalian meiosis I (MI). Previous results indicate that haspin kinase regulates resumption of meiosis from prophase arrest, chromosome condensation, and kinetochore-microtubule attachments during early prometaphase of MI. Here we report that haspin inhibition in late prometaphase I causes acceleration of MI, bypass of the spindle assembly checkpoint (SAC), and loss of interchromatid axis-localized Aurora kinase C. Meiotic cells contain a second chromosomal passenger complex (CPC) population, with Aurora kinase B (AURKB) bound to INCENP. Haspin inhibition in oocytes from Aurkc-/- mice, where AURKB is the sole CPC kinase, does not alter MI completion timing, and no change in localization of the SAC protein, MAD2, is observed. These data suggest that AURKB on the interchromatid axis is not needed for SAC activation and illustrate a key difference between the functional capacities of the two AURK homologues.
© 2017 Quartuccio et al. This article is distributed by The American Society for Cell Biology under license from the author(s). Two months after publication it is available to the public under an Attribution–Noncommercial–Share Alike 3.0 Unported Creative Commons License (http://creativecommons.org/licenses/by-nc-sa/3.0).
Figures


Similar articles
-
Establishing correct kinetochore-microtubule attachments in mitosis and meiosis.Essays Biochem. 2020 Sep 4;64(2):277-287. doi: 10.1042/EBC20190072. Essays Biochem. 2020. PMID: 32406497 Free PMC article. Review.
-
Phosphorylation of threonine 3 on histone H3 by haspin kinase is required for meiosis I in mouse oocytes.J Cell Sci. 2014 Dec 1;127(Pt 23):5066-78. doi: 10.1242/jcs.158840. Epub 2014 Oct 14. J Cell Sci. 2014. PMID: 25315835 Free PMC article.
-
Genetic Interactions between the Aurora Kinases Reveal New Requirements for AURKB and AURKC during Oocyte Meiosis.Curr Biol. 2018 Nov 5;28(21):3458-3468.e5. doi: 10.1016/j.cub.2018.08.052. Epub 2018 Oct 25. Curr Biol. 2018. PMID: 30415701 Free PMC article.
-
Selective disruption of aurora C kinase reveals distinct functions from aurora B kinase during meiosis in mouse oocytes.PLoS Genet. 2014 Feb 27;10(2):e1004194. doi: 10.1371/journal.pgen.1004194. eCollection 2014 Feb. PLoS Genet. 2014. PMID: 24586209 Free PMC article.
-
Specialize and Divide (Twice): Functions of Three Aurora Kinase Homologs in Mammalian Oocyte Meiotic Maturation.Trends Genet. 2017 May;33(5):349-363. doi: 10.1016/j.tig.2017.03.005. Epub 2017 Mar 27. Trends Genet. 2017. PMID: 28359584 Free PMC article. Review.
Cited by
-
Distinct Aurora B pools at the inner centromere and kinetochore have different contributions to meiotic and mitotic chromosome segregation.Mol Biol Cell. 2023 May 1;34(5):ar43. doi: 10.1091/mbc.E23-01-0014. Epub 2023 Mar 15. Mol Biol Cell. 2023. PMID: 36920098 Free PMC article.
-
Aurora B prevents aneuploidy via MAD2 during the first mitotic cleavage in oxidatively damaged embryos.Cell Prolif. 2019 Sep;52(5):e12657. doi: 10.1111/cpr.12657. Epub 2019 Jul 1. Cell Prolif. 2019. PMID: 31264311 Free PMC article.
-
DNA damage induces a kinetochore-based ATM/ATR-independent SAC arrest unique to the first meiotic division in mouse oocytes.Development. 2017 Oct 1;144(19):3475-3486. doi: 10.1242/dev.153965. Epub 2017 Aug 29. Development. 2017. PMID: 28851706 Free PMC article.
-
Establishing correct kinetochore-microtubule attachments in mitosis and meiosis.Essays Biochem. 2020 Sep 4;64(2):277-287. doi: 10.1042/EBC20190072. Essays Biochem. 2020. PMID: 32406497 Free PMC article. Review.
-
AURKA controls oocyte spindle assembly checkpoint and chromosome alignment by HEC1 phosphorylation.Life Sci Alliance. 2025 May 6;8(7):e202403146. doi: 10.26508/lsa.202403146. Print 2025 Jul. Life Sci Alliance. 2025. PMID: 40328643 Free PMC article.
References
-
- Chen HL, Tang CJ, Chen CY, Tang TK. Overexpression of an Aurora-C kinase-deficient mutant disrupts the Aurora-B/INCENP complex and induces polyploidy. J Biomed Sci. 2005;12:297–310. - PubMed
MeSH terms
Substances
Grants and funding
LinkOut - more resources
Full Text Sources
Other Literature Sources
Miscellaneous
