. 2017 Aug 24;91(18):e00422-17.
doi: 10.1128/JVI.00422-17. Print 2017 Sep 15.

Hepatitis C Virus Strain-Dependent Usage of Apolipoprotein E Modulates Assembly Efficiency and Specific Infectivity of Secreted Virions

Affiliations

Hepatitis C Virus Strain-Dependent Usage of Apolipoprotein E Modulates Assembly Efficiency and Specific Infectivity of Secreted Virions

Romy Weller et al. J Virol. .

Abstract

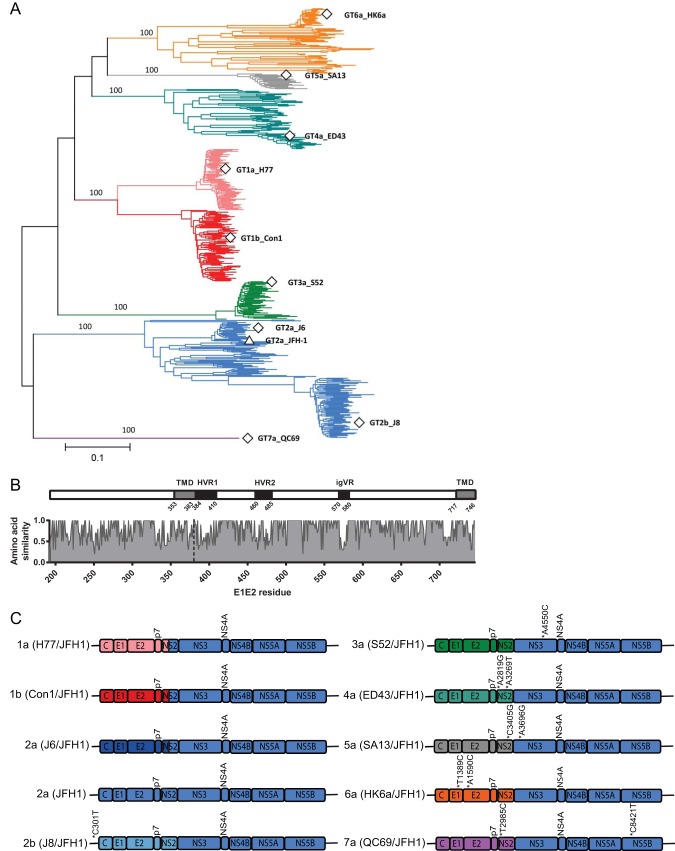
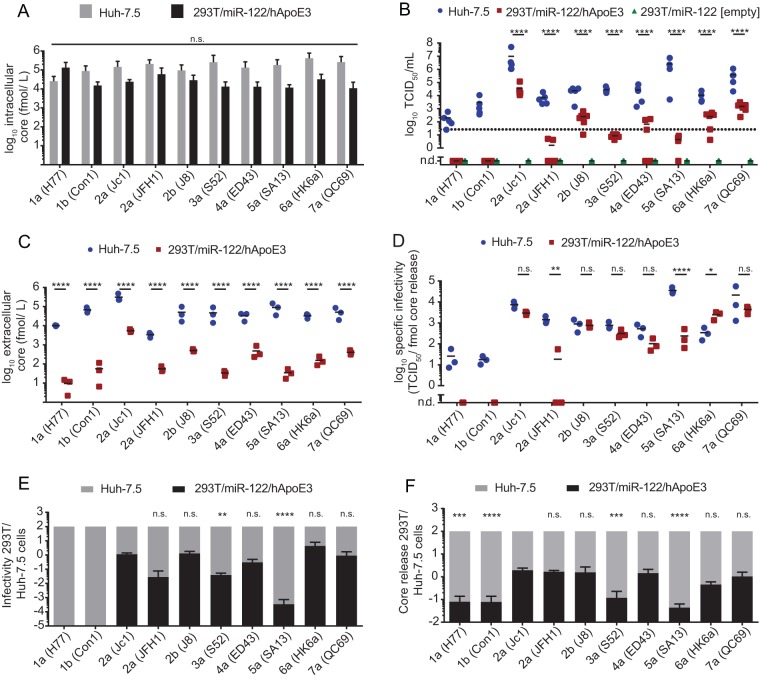
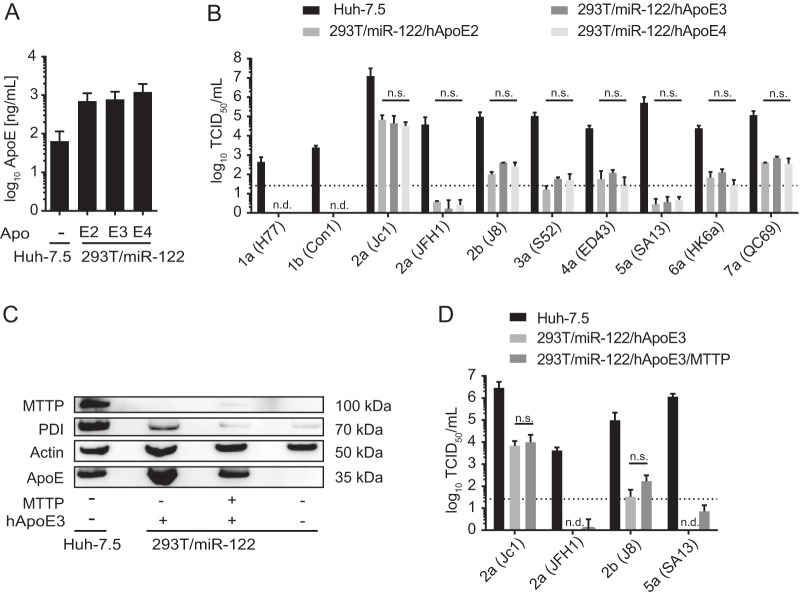
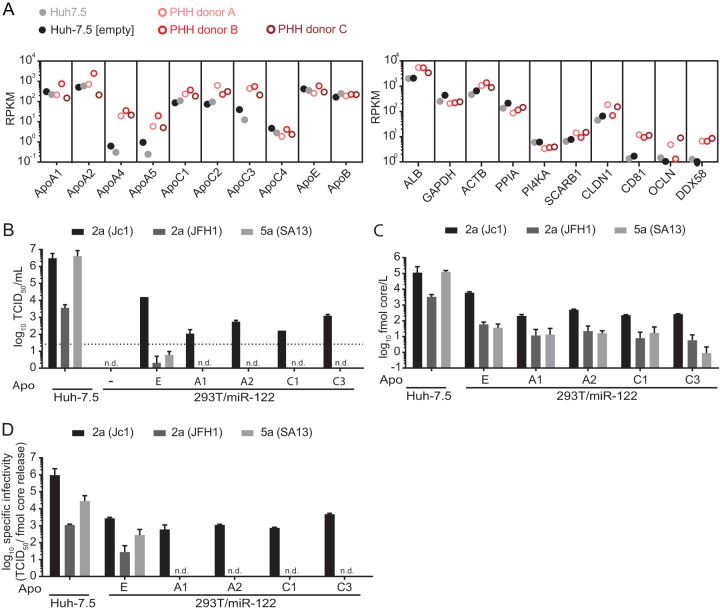
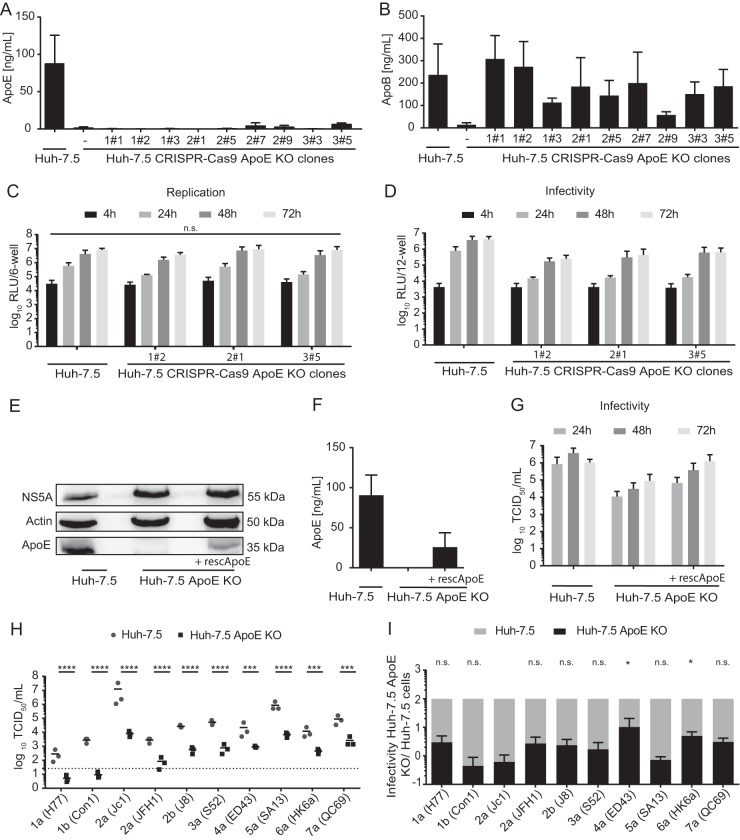
Hepatitis C virus (HCV) is extraordinarily diverse and uses entry factors in a strain-specific manner. Virus particles associate with lipoproteins, and apolipoprotein E (ApoE) is critical for HCV assembly and infectivity. However, whether ApoE dependency is common to all HCV genotypes remains unknown. Therefore, we compared the roles of ApoE utilizing 10 virus strains from genotypes 1 through 7. ApoA and ApoC also support HCV assembly, so they may contribute to virus production in a strain-dependent fashion. Transcriptome sequencing (RNA-seq) revealed abundant coexpression of ApoE, ApoB, ApoA1, ApoA2, ApoC1, ApoC2, and ApoC3 in primary hepatocytes and in Huh-7.5 cells. Virus production was examined in Huh-7.5 cells with and without ApoE expression and in 293T cells where individual apolipoproteins (ApoE1, -E2, -E3, -A1, -A2, -C1, and -C3) were provided in trans All strains were strictly ApoE dependent. However, ApoE involvement in virus production was strain and cell type specific, because some HCV strains poorly produced infectious virus in ApoE-expressing 293T cells and because ApoE knockout differentially affected virus production of HCV strains in Huh-7.5 cells. ApoE allelic isoforms (ApoE2, -E3, and -E4) complemented virus production of HCV strains to comparable degrees. All tested strains assembled infectious progeny with ApoE in preference to other exchangeable apolipoproteins (ApoA1, -A2, -C1, and -C3). The specific infectivity of HCV particles was similar for 293T- and Huh-7.5-derived particles for most strains; however, it differed by more than 100-fold in some viruses. Collectively, this study reveals strain-dependent and host cell-dependent use of ApoE during HCV assembly. These differences relate to the efficacy of virus production and also to the properties of released virus particles and therefore govern viral fitness at the level of assembly and cell entry.IMPORTANCE Chronic HCV infections are a major cause of liver disease. HCV is highly variable, and strain-specific determinants modulate the response to antiviral therapy, the natural course of infection, and cell entry factor usage. Here we explored whether host factor dependency of HCV in particle assembly is modulated by strain-dependent viral properties. We showed that all examined HCV strains, which represent all seven known genotypes, rely on ApoE expression for assembly of infectious progeny. However, the degree of ApoE dependence is modulated in a strain-specific and cell type-dependent manner. This indicates that HCV strains differ in their assembly properties and host factor usage during assembly of infectious progeny. Importantly, these differences relate not only to the efficiency of virus production and release but also to the infectiousness of virus particles. Thus, strain-dependent features of HCV modulate ApoE usage, with implications for virus fitness at the level of assembly and cell entry.

Keywords: ApoE; apolipoprotein; assembly; genotypes; hepatitis C virus.


Figures

FIG 1
FIG 1
HCV genetic and amino acid diversity. (A) E1E2 phylogenetic tree depicting the evolutionary relationships of the seven HCV genotypes, with genotypes color coded (subtypes 1a/1b, pink/red; genotype 2. blue; genotype 3, green; genotype 4, turquoise; genotype 5, gray; genotype 6, orange; genotype 7, purple). The positions of E1E2s derived from the nine chimeric strains utilized in this study are highlighted with open squares. The position of the JFH-1 E1E2 is marked with an open triangle. Branch lengths represent genetic distance measured in nucleotide substitutions per site and are proportional to the scale bar. Bootstrap values are assigned to the branches leading to the seven genotypes and are percentages derived from 1,000 replications. (B) Amino acid similarity plot of full-length HCV envelope glycoproteins derived from the 10 strains utilized in this study, with relative similarity shown on the y axis and amino acid position in the encoded proteins presented on the x axis. For the purpose of positional referencing, a cartoon of the E1E2 protein is located directly above, with the three hypervariable regions of E2 (HVR1, HVR2, and igVR) highlighted in black and the E1 and E2 transmembrane domains (TMD) highlighted in gray. The dashed vertical line represents the E1/E2 boundary. All numbering is relative to the full-length ORF position in the H77 reference strain (accession number NC_004102). (C) HCV constructs used in this study. The colors of genome portions matches the colors chosen for display of distinct HCV genotypes and subtypes in panel A. Asterisks indicate adaptive mutations.
FIG 2
FIG 2
Strain-dependent usage of ApoE3 during HCV assembly in 293T/miR-122 cells. (A) Huh-7.5 cells and non-liver-derived 293T/miR-122 cells expressing hApoE3 were transfected with in vitro-transcribed RNA of the depicted HCV constructs, and intracellular core protein was quantified 48 h later to compare transfection, translation, and replication efficacy by use of a core-specific ELISA. Depicted are means and standard deviations from three independent experiments (n.s., not significant by 2-way ANOVA followed by Sidak's multiple-comparison test). (B) Infectious virus production from these transfected cells was quantified by titrating the cell-free culture fluids collected at 48 h posttransfection and by using endpoint dilution assay on Huh-7.5 target cells. Infectivity is given as 50% tissue culture infectious dose per milliliter (TCID50/ml). 293T/miR-122 cells lacking ApoE expression were transfected with each HCV chimera in parallel, and no infectious events were detected. The dotted line represents the lower limit of quantification (LLOQ) of the assay. Displayed are individual results of four to six independent experiments, with the mean presented as a horizontal bar. Mean TCID50s in Huh-7.5 cells were compared to infectivity in 293T/miR-1227hApoE3 cells for each strain (****, P < 0.0001; n.d., not detected [by 2-way ANOVA followed by Sidak's multiple-comparison test]). (C) At 48 h after transfection, secretion of core protein into the cell culture supernatant as an indicator of particle release was additionally quantified by core-specific ELISA. Results from three independent experiments, with the mean presented as a horizontal bar, are given. Mean concentrations of core in Huh-7.5 were compared to detected particles in 293T/miR-122/hApoE3 cells for each strain (****, P < 0.0001 by 2-way ANOVA followed by Sidak's multiple-comparison test). (D) Based on the data plotted in panels B and C, the specific infectivity (i.e., the TCID50 units per fmol of released core protein) was calculated in three independent experiments. Mean specific infectivities in Huh-7.5 cells were compared to those in 293T/miR-122/hApoE3 cells for each strain (****, P < 0.0001; **, P < 0.01; *, P < 0.05; n.s., not significant; n.d., not detected [by 2-way ANOVA followed by Sidak's multiple-comparison test]). (E and F) Efficiencies of infectious virus particle production (E) and core protein release (F) from 293T/miR-122/hApoE3 cells were calculated and displayed, with those observed in Huh-7.5 cells normalized to 100%. Significant differences of relative infectivity and relative core release in 293T/miR-122/hApoE3 cells of different chimeras compared to Jc1 are indicated (****, P < 0.0001; ***, P < 0.001; **, P < 0.01; n.s., not significant [by 1-way ANOVA followed by Sidak's multiple-comparison test]).
FIG 3
FIG 3
Ability of ApoE allelic isoforms and MTTP to support infectious virus production of HCV chimeras in 293T/miR-122 cells. (A) 293T/miR-122 cells were transduced to express the allelic isoforms of ApoE, and secretion of these allelic forms (ApoE2, ApoE3, and ApoE4) was quantified by using an ApoE ELISA. (B) These cell lines were subsequently transfected with RNAs of the indicated HCV constructs, and release of infectious particles was determined by a limiting dilution assay. Differences in infectivity observed among the three cell lines were analyzed by 2-way ANOVA followed by Sidak's multiple-comparison test (n.s., not significant; n.d., not detected). (C) 293T/miR-122/hApoE3 cells were lentivirus transduced to express the additional host factor MTTP. Protein expression of MTTP as well as the protein disulfide isomerase (PDI), which completes the heterodimeric MTTP, was confirmed by immunoblotting using antibodies specific for MTTP, PDI, β-actin, and ApoE. (D) Cells were transfected with the indicated HCV constructs. Infectious virus production was assessed by a limiting dilution assay. Differences in means were analyzed by multiple t tests, corrected with the Holm-Sidak method (n.s., nonsignificant; n.d., not detected). For all panels, results are shown as means with standard deviations from three independent experiments.
FIG 4
FIG 4
Preferential usage of ApoE over ApoA and ApoC during HCV assembly of different HCV constructs in 293T/miR-122 cells. (A) Relative mRNA expression levels are depicted as reads per kilobase per million reads (RPKM) of multiple exchangeable and nonexchangeable apolipoproteins in Huh-7.5 cells, lentivirus-transduced Huh-7.5 cells expressing an “empty” lentiviral vector (Huh-7.5 [empty]), and PHHs from three different donors. For comparison, RPKM values for the liver-specific host factor albumin (ALB), two housekeeping genes (glyceraldehyde-3-phosphate dehydrogenase [GAPDH] and β-actin [ACTB]), HCV replication factors cyclophilin A (PPIA) and phosphatidylinositol 4-kinase alpha (PI4KA), HCV entry factors scavenger receptor class B type 1 (SCARB1), claudin-1 (CLDN1), CD81, and occludin (OCLN), and the innate immune sensor RIG-I (DDX58) are presented on the right. (B) A subset of apolipoproteins that were highly expressed in Huh-7.5 cells/PHHs was selected to evaluate their ability to complement infectious virus production 48 h after HCV RNA transfection. Virus titers were assessed via limiting dilution assay, with the dotted line indicating the lower limit of quantification (LLOQ). (C) Release of core protein into the culture fluids was quantified by core-specific ELISA at 48 h posttransfection. (D) Specific infectivity was calculated based on core protein released into the supernatants and corresponding infectivity. For panels B, C, and D, means and standard deviations from two independent experiments are depicted (n.d., not detected).
FIG 5
FIG 5
HCV replication and virus production in Huh-7.5 cell clones with ApoE knockout. (A and B) Individual Huh-7.5 clones deficient in endogenous ApoE expression were generated via CRISPR/Cas9-mediated knockout, subcloned, and characterized for ApoE (A) or ApoB secretion (B) into the culture fluids by commercially available ApoE and ApoB ELISAs. Means and standard deviations from at least two independent experiments are shown. (C) Three knockout cell clones were transfected with JcR2A HCV RNA encoding a Renilla luciferase reporter. At 4 h, 24 h, 48 h, and 72 h posttransfection, HCV RNA replication was monitored by luciferase measurements in the cell lysates. Luciferase activity is given in relative light units per well of a 6-well plate (RLU/6-well). Means and standard deviations from at least three independent experiments are depicted. Differences in RLU were compared among KO clones to Huh7.5 at each of the indicated time points (n.s., not significant). (D) Cell-free cell culture supernatants of the cells used for panel C were used to inoculate naive Huh-7.5 cells, and infectivity was determined by luciferase assay at 72 h postinoculation from three independent repetitions. Based on the data sets presented, cell clone 1#2 was selected for further analyses. (E to G) Endogenous ApoE KO was restored by ectopic expression of a C-terminally HA-tagged ApoE3 variant. Intracellular ApoE KO or overexpression of recombinant ApoE was confirmed by immunoblotting (E) and secretion of ApoE into the cell culture supernatant by ApoE-specific ELISA (F). Infectious virus production upon transfection with HCV Jc1 RNA was quantified by a limiting-dilution assay (G). Virus replication after transfection was assessed by immunoblotting of intracellular NS5A protein (E). For panel G, results from three independent experiments are shown. (H) The selected ApoE KO cell clone 1#2 and parental Huh-7.5 cells were transfected with RNA of JFH1 and nine chimeric HCV constructs, and at 48 h posttransfection, cell-free supernatants were used to inoculate naive Huh-7.5 cells. Infectivity was determined by limiting-dilution assay. The dotted line represents the lower limit of quantification (LLOQ) of the assay; independent repetitions are indicated as solid dots with a bar displaying the mean. Mean TCID50s in Huh-7.5 cells were compared to infectivity in the KO cell line for each strain (****, P < 0.0001; ***, P < 0.001 [by 2-way ANOVA followed by Sidak's multiple-comparison test]). (I) The efficiency of infectious virus particle release (E) from subcloned Huh-7.5 ApoE KO cells was compared to that from parental Huh-7.5 cells, which was set to 100%. The mean specific infectivity in Huh-7.5 cells was compared to that in ApoE KO cells for each strain (*, P < 0.05; n.s., not significant [by 2-way ANOVA followed by Sidak's multiple-comparison test]).

Similar articles

Cited by

References

    1. Simmonds P, Alberti A, Alter HJ, Bonino F, Bradley DW, Brechot C, Brouwer JT, Chan SW, Chayama K, Chen DS, Choo Q, Colombo M, Cuypers HTM, Date T, Dusheiko GM, Esteban JI, Fay O, Hadziyannis SJ, Han J, Hatzakis A, Holmes EC, Hotta H, Houghton M, Irvine B, Kohara M, Kolberg JA, Kuo G, Lau JYN, Lelie PN, Maertens G, McOmish F, Miyamura T, Mizokami M, Nomoto A, Prince AM, Reesink HW, Rice CM, Roggendorf M, Schalm SW, Shikata T, Shimotohno K, Stuyver L, Trépo C, Weiner A, Yap PL, Urdea MS. 1994. A proposed system for the nomenclature of hepatitis C viral genotypes. Hepatology 19:1321–1324. doi:10.1002/hep.1840190538. - DOI - PubMed
    1. Smith DB, Bukh J, Kuiken C, Muerhoff AS, Rice CM, Stapleton JT, Simmonds P. 2014. Expanded classification of hepatitis C virus into 7 genotypes and 67 subtypes: updated criteria and genotype assignment web resource. Hepatology 59:318–327. doi:10.1002/hep.26744. - DOI - PMC - PubMed
    1. Lauer GM, Walker BD. 2001. Hepatitis C virus infection. N Engl J Med 345:41–52. doi:10.1056/NEJM200107053450107. - DOI - PubMed
    1. Cooke GS, Lemoine M, Thursz M, Gore C, Swan T, Kamarulzaman A, DuCros P, Ford N. 2013. Viral hepatitis and the global burden of disease: a need to regroup. J Viral Hepat 20:600–601. doi:10.1111/jvh.12123. - DOI - PubMed
    1. Smith DB, Pathirana S, Davidson F, Lawlor E, Power J, Yap PL, Simmonds P. 1997. The origin of hepatitis C virus genotypes. J Gen Virol 78:321–328. doi:10.1099/0022-1317-78-2-321. - DOI - PubMed

Publication types

LinkOut - more resources