. 2017 Jun 28;7(1):4343.
doi: 10.1038/s41598-017-04628-2.

Novel approaches for Spatial and Molecular Surveillance of Porcine Reproductive and Respiratory Syndrome Virus (PRRSv) in the United States

Affiliations

Novel approaches for Spatial and Molecular Surveillance of Porcine Reproductive and Respiratory Syndrome Virus (PRRSv) in the United States

Moh A Alkhamis et al. Sci Rep. .

Abstract

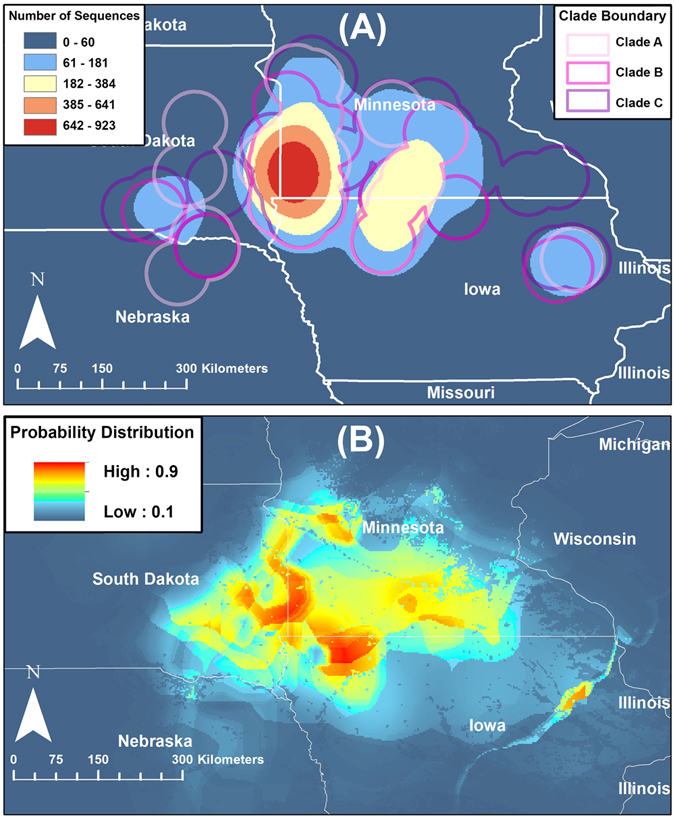
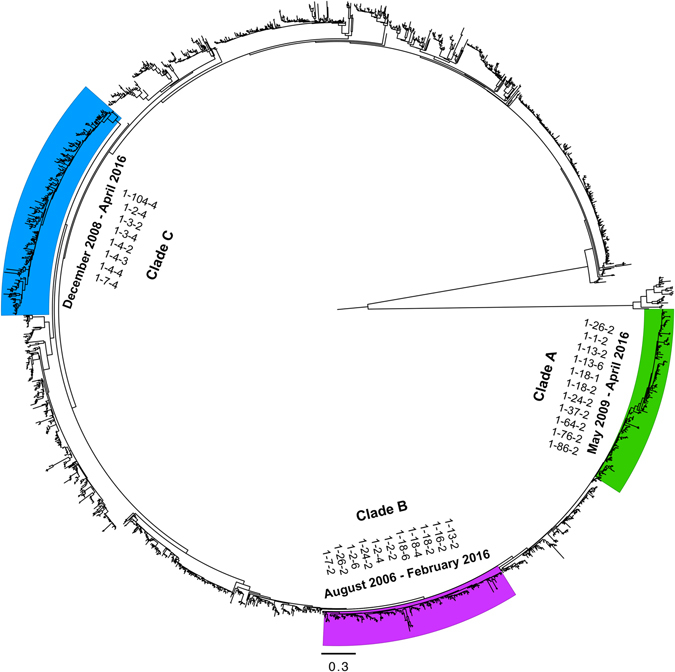
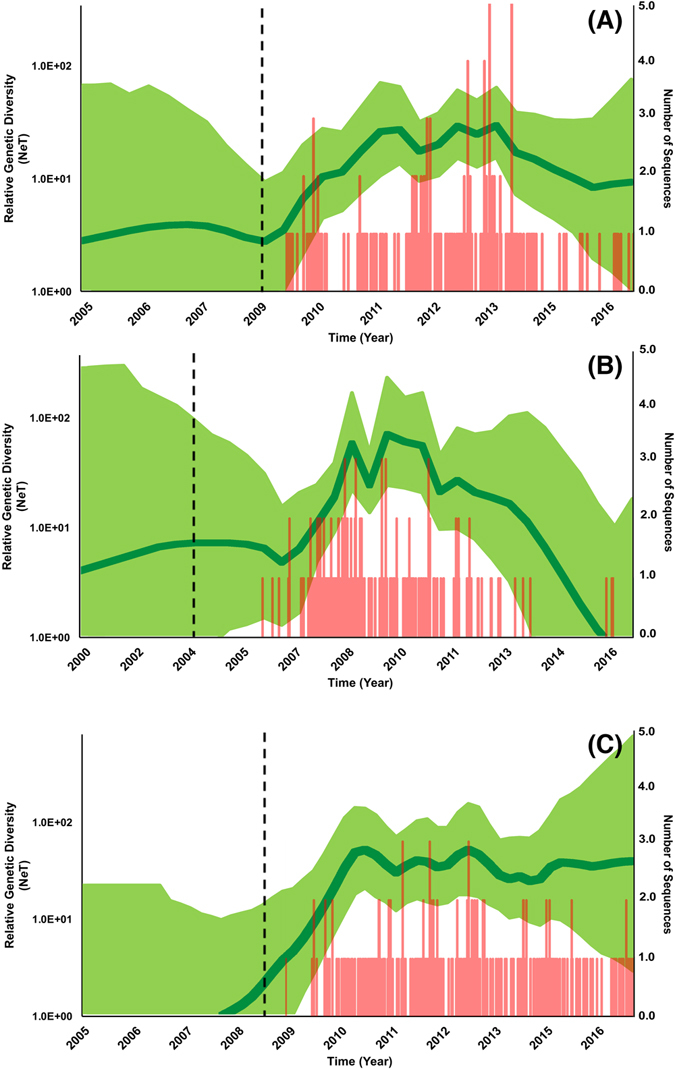
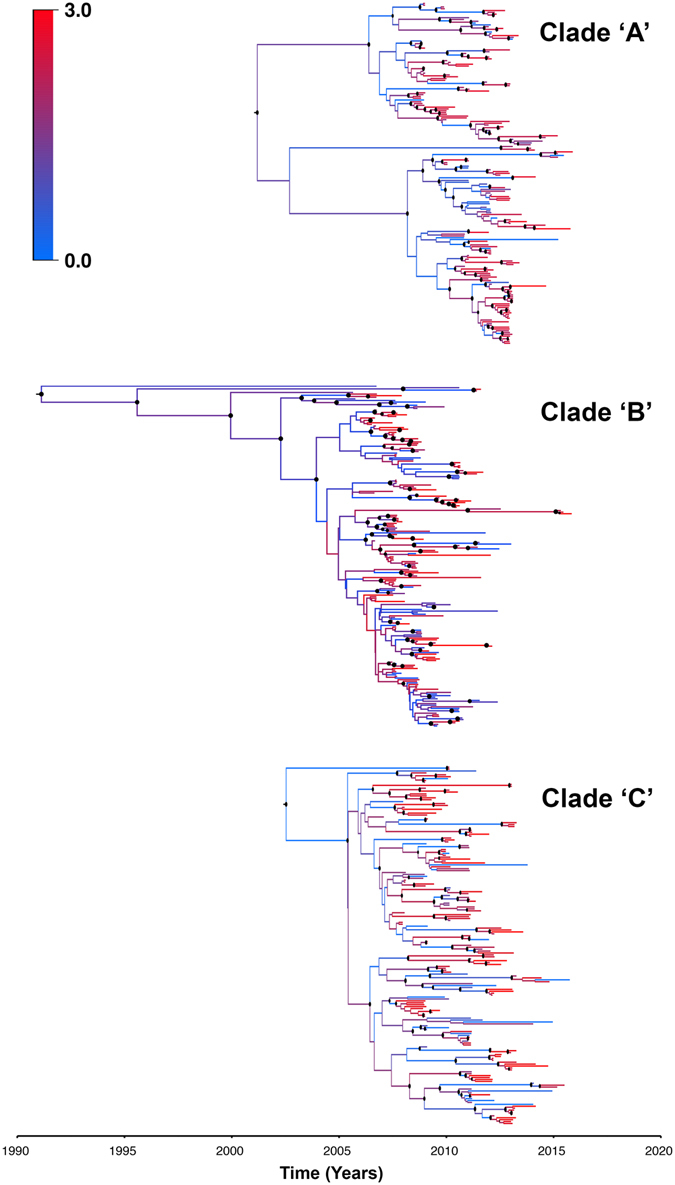
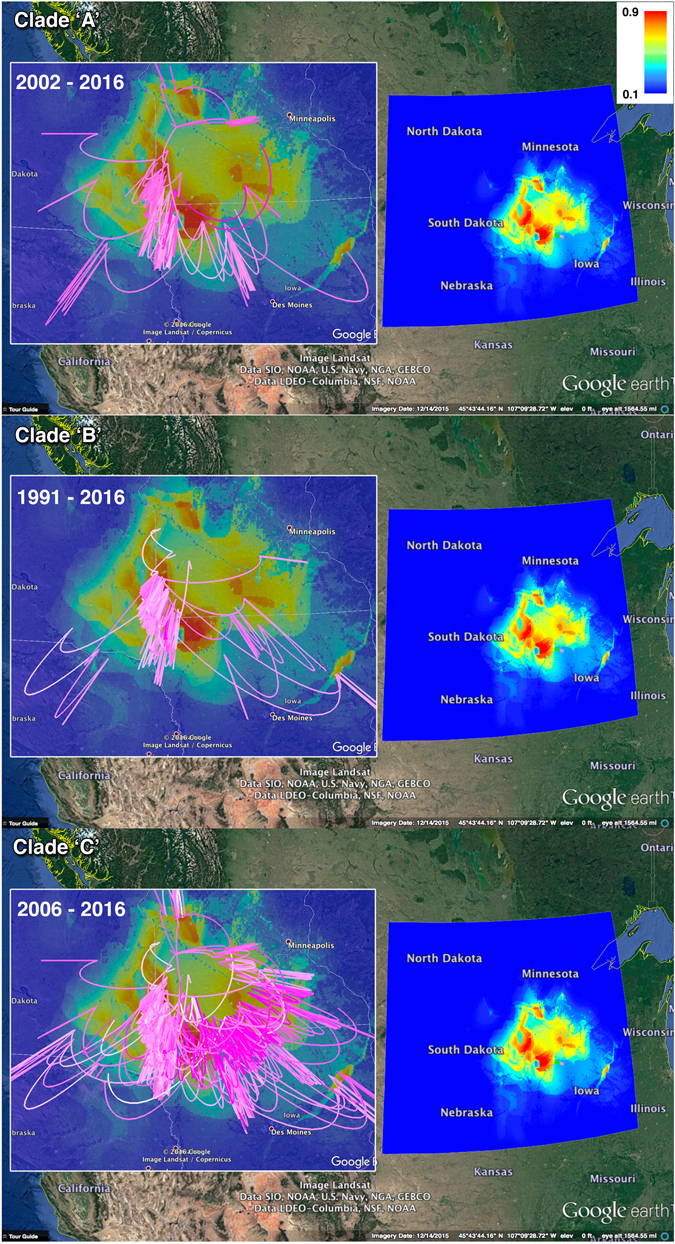
The US swine industry has been impaired over the last 25 years by the far-reaching financial losses caused by the porcine reproductive and respiratory syndrome (PRRS). Here, we explored the relations between the spatial risk of PRRS outbreaks and its phylodynamic history in the U.S during 1998-2016 using ORF5 sequences collected from swine farms in the Midwest region. We used maximum entropy and Bayesian phylodynamic models to generate risk maps for PRRS outbreaks and reconstructed the evolutionary history of three selected phylogenetic clades (A, B and C). High-risk areas for PRRS were best-predicted by pig density and climate seasonality and included Minnesota, Iowa and South Dakota. Phylodynamic models demonstrated that the geographical spread of the three clades followed a heterogeneous spatial diffusion process. Furthermore, PRRS viruses were characterized by typical seasonality in their population size. However, endemic strains were characterized by a substantially slower population growth and evolutionary rates, as well as smaller spatial dispersal rates when compared to emerging strains. We demonstrated the prospects of combining inferences derived from two unique analytical methods to inform decisions related to risk-based interventions of an important pathogen affecting one of the largest food animal industries in the world.


Conflict of interest statement

The authors declare that they have no competing interests.

Figures

Figure 1
Figure 1
Geographical locations of the PRRSv sequences and predicted spatial probability of PRRSV outbreaks in swine farms located in the Midwest region of the U.S., collected from January 1998 to April 2016. (A) Smoothed kernel density function for the geographical locations of the farms where sequences were collected and geographical exntension of the selected clades. (B) Spatial probability distribution of PRRSV outbreaks predicted by the final presence-only maximum entropy ecological niche model. Figure’s maps were generated using ArcGIS version 10.4.
Figure 2
Figure 2
Maximum Likelihood (ML) phylogeny of PRRSV ORF-5 sequences collected between January 1998 and April 2016 in swine farms in the Midwest of the U.S. The ML tree was inferred from the GTR + Γ model of evolution. Support given at nodes based on through bootstrap search using 10 runs, with 100 ML replicates in each run, implemented in RAxML version 8. The scale bar indicates the number of substitutions per site. Selected clades are highlighted with green (Clade ‘A’), purple (Clade ‘B’), and Blue (‘F’), with their corresponding RFLP-types isolates listed and collection dates (Month-Year).
Figure 3
Figure 3
Temporal variation in the effective population size of PRRSv selected clades in the in the Midwest isolated between 2009 and 2016. This ‘Bayesian skygrid’ plot summarizes the inferred effective population size (N e T)—which summarize genetic variation in terms of effective population size trajectories of the sampled ORF-5 gene sequences—through time in the Midwest. The mean estimate is indicated by the dark green line; the shaded light green regions correspond to the 95% HPD. Red bars represents the number of sequences collected over the period of the study and correspond to each selected clade. Vertical doted lines represent corresponds to the estimated time at which each clade transitioned from slow to fast population growth. Each figure (AC) corresponds to Clades (AC), respectively.
Figure 4
Figure 4
Maximum clade credibility (MCC) phylogeny of ORF-5 gene of PRRS clades ‘A’, ‘B’ and ‘C’ viruses in the Midwest estimated under the best-fitting spatial diffusion model (Table 2). The color of the branches represents the among-branch spatial diffusion rate variation and corresponds to the color gradient legend on the middle right. Well-supported posterior probabilities (P > 0.85) of branching events are indicated by black circles at the nodes.
Figure 5
Figure 5
Clades’ ‘A’, ‘B’ and ‘C’ MCC tree spread and ecology in the Midwest. The Google Earth Pro snapshots of Clades MCC trees are superimposed on the predicted spatial risk of PRRSV outbreaks by the final Maxent model. The gradient color legend on the upper right represents the scale of the spatial probability distribution. The lines represent the continuous diffusion phylogeographic history of clade viruses, and their gradient colors represent their age (light pink = older, dark pink = younger). The figure is composed of satellite images captured as snapshots from Google Earth Pro (https://www.google.com/earth/). Figure’s associated three-dimensional movies corresponding to each clade are provided in the supplementary materials (File S2–4).

Similar articles

Cited by

References

    1. Pork Checkoff. Top 10 Pork-Producing Countries Accessed December 2016. Available online: http://www.pork.org/pork-quick-facts/home/stats/u-s-pork-exports/top-10-....
    1. Quaife T. Scramble is on to solve mystery disease. Swine Practice. 1989;5:10.
    1. Benfield DA, et al. Characterization of swine infertility and respiratory syndrome (SIRS) virus (isolate ATCC VR-2332) J Vet Diagn Invest. 1992;4:127–133. doi: 10.1177/104063879200400202. - DOI - PubMed
    1. Holtkamp DJ, et al. Assessment of the economic impact of porcine reproductive and respiratory syndrome virus on United States pork producers. Journal of Swine Health and Production. 2013;21:72–84.
    1. Perez AM, et al. Lessons learned and knowledge gaps about the epidemiology and control of porcine reproductive and respiratory syndrome virus in North America. J Am Vet Med Assoc. 2015;246:1304–1317. doi: 10.2460/javma.246.12.1304. - DOI - PubMed

Publication types

MeSH terms

Substances

LinkOut - more resources