. 2017 Jun 28;7(1):4314.
doi: 10.1038/s41598-017-04375-4.

Comparative genetic, proteomic and phosphoproteomic analysis of C. elegans embryos with a focus on ham-1/STOX and pig-1/MELK in dopaminergic neuron development

Affiliations

Comparative genetic, proteomic and phosphoproteomic analysis of C. elegans embryos with a focus on ham-1/STOX and pig-1/MELK in dopaminergic neuron development

Sarah-Lena Offenburger et al. Sci Rep. .

Abstract

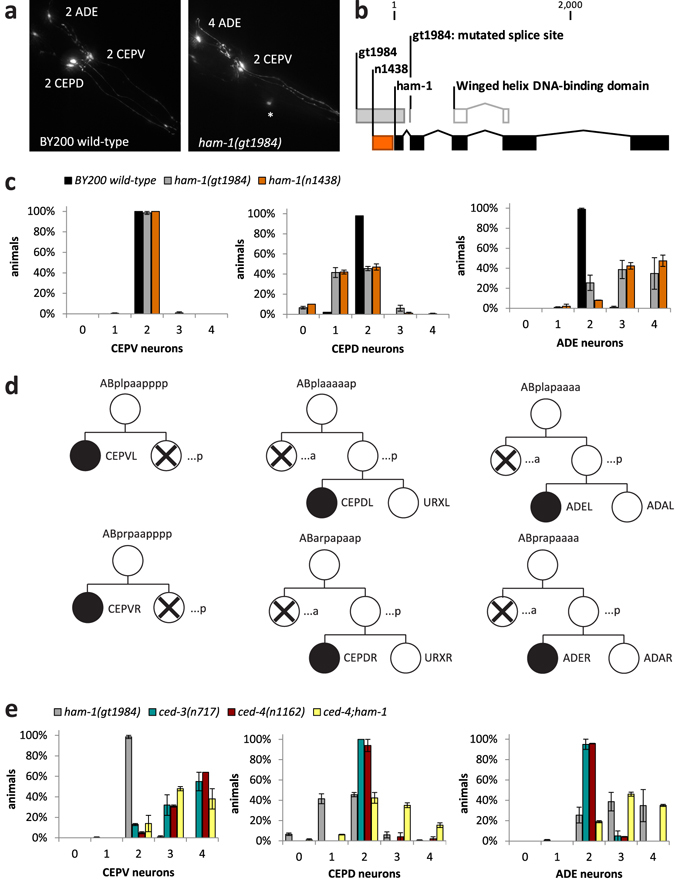
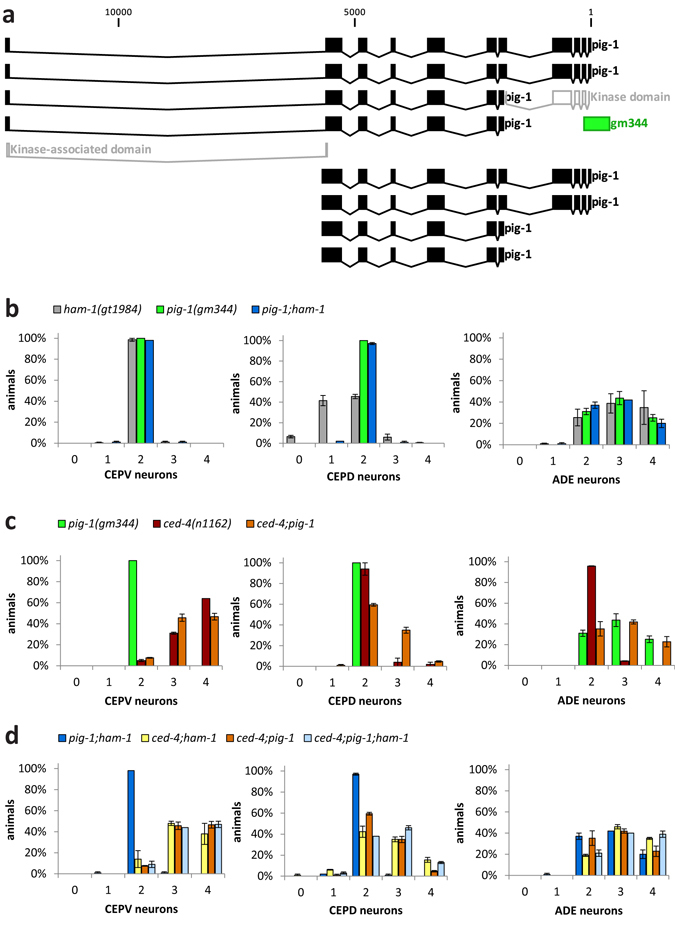
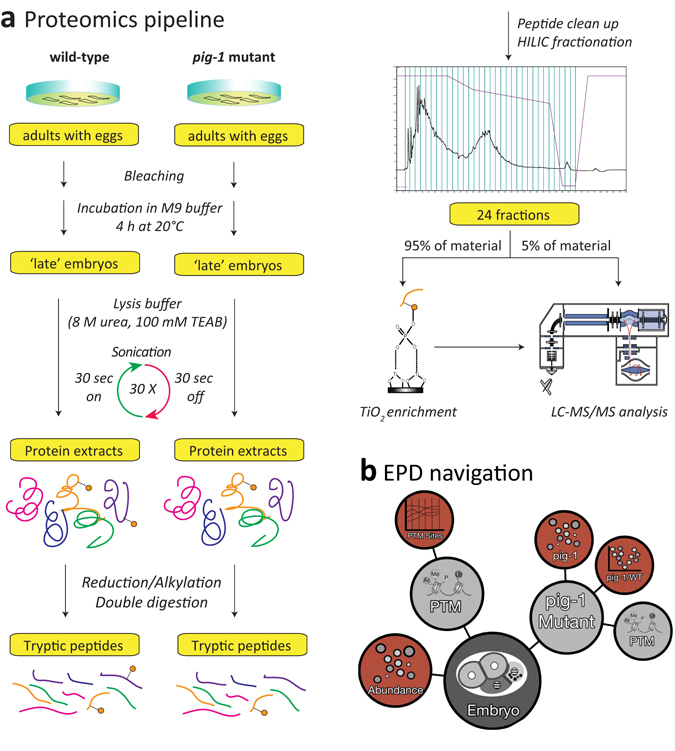
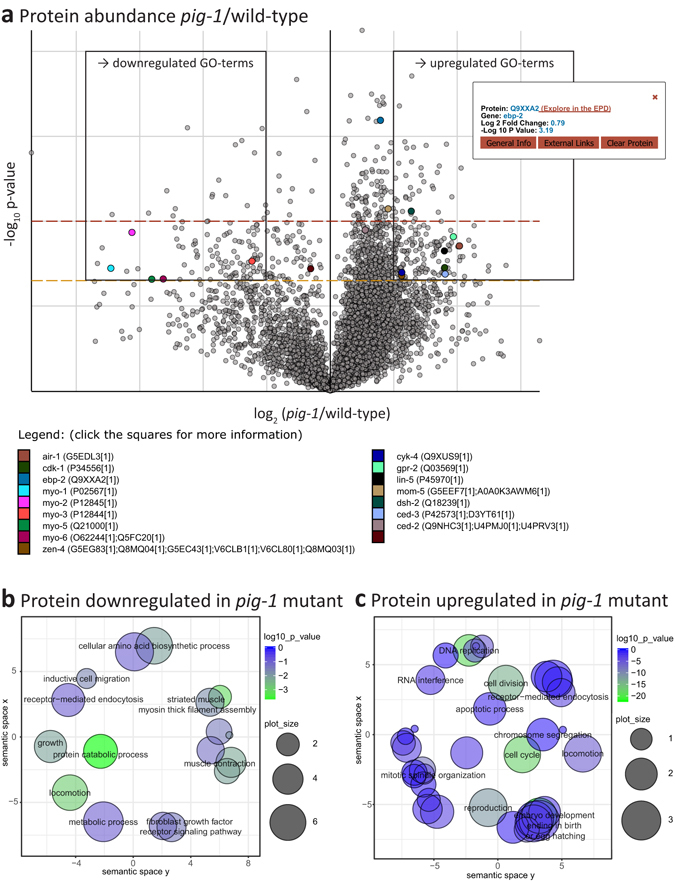
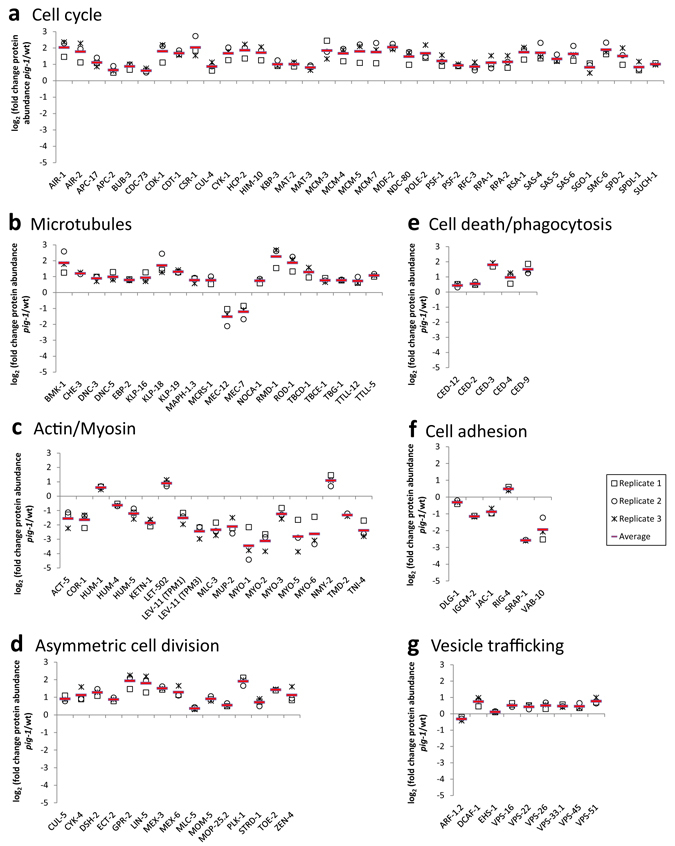
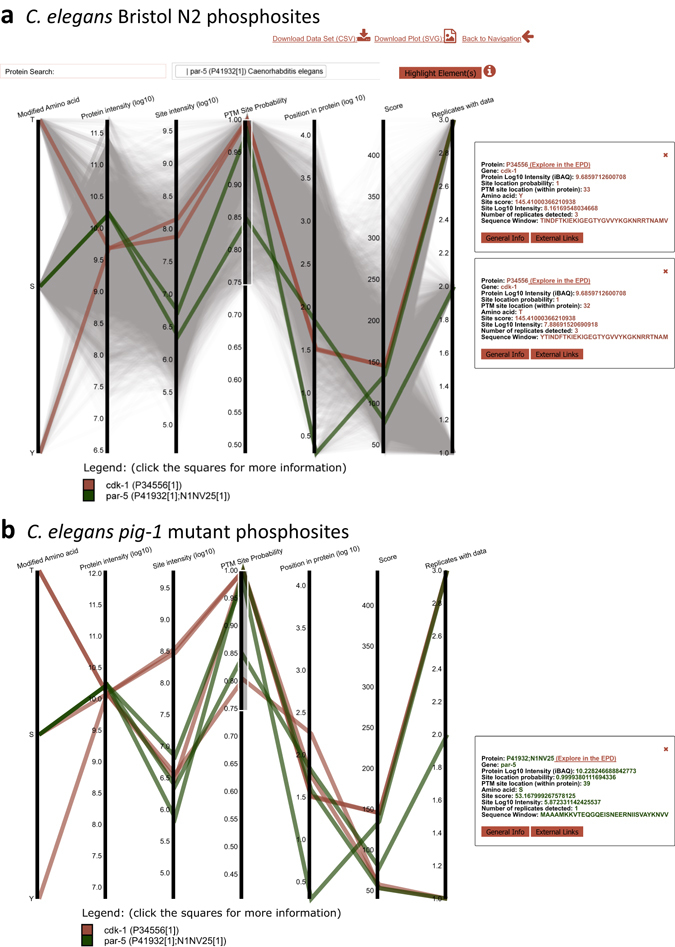
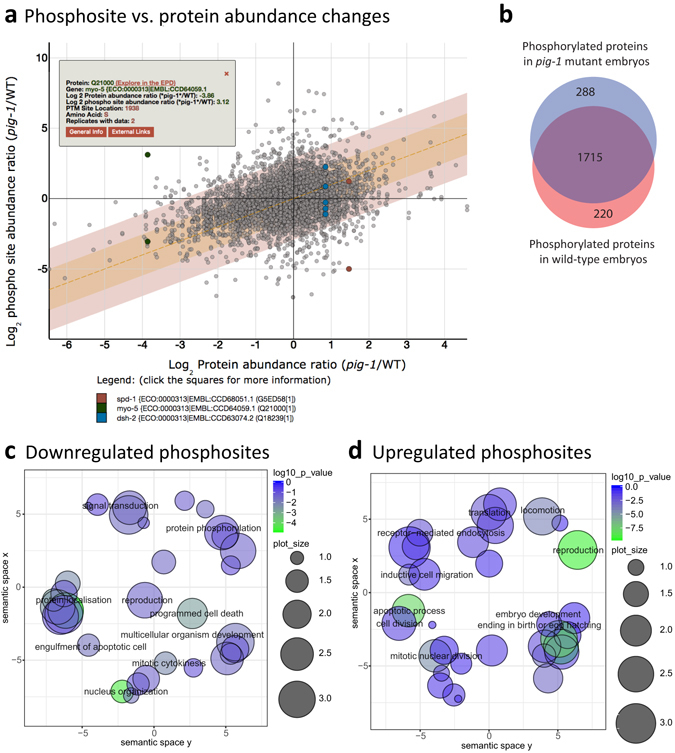
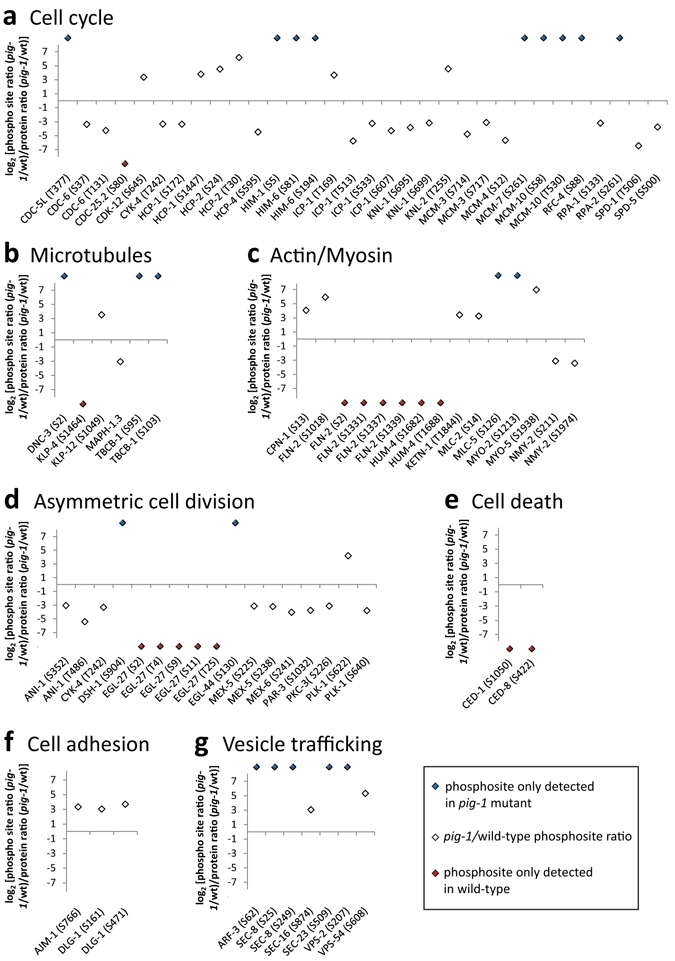
Asymmetric cell divisions are required for cellular diversity and defects can lead to altered daughter cell fates and numbers. In a genetic screen for C. elegans mutants with defects in dopaminergic head neuron specification or differentiation, we isolated a new allele of the transcription factor HAM-1 [HSN (Hermaphrodite-Specific Neurons) Abnormal Migration]. Loss of both HAM-1 and its target, the kinase PIG-1 [PAR-1(I)-like Gene], leads to abnormal dopaminergic head neuron numbers. We identified discrete genetic relationships between ham-1, pig-1 and apoptosis pathway genes in dopaminergic head neurons. We used an unbiased, quantitative mass spectrometry-based proteomics approach to characterise direct and indirect protein targets and pathways that mediate the effects of PIG-1 kinase loss in C. elegans embryos. Proteins showing changes in either abundance, or phosphorylation levels, between wild-type and pig-1 mutant embryos are predominantly connected with processes including cell cycle, asymmetric cell division, apoptosis and actomyosin-regulation. Several of these proteins play important roles in C. elegans development. Our data provide an in-depth characterisation of the C. elegans wild-type embryo proteome and phosphoproteome and can be explored via the Encyclopedia of Proteome Dynamics (EPD) - an open access, searchable online database.


Conflict of interest statement

The authors declare that they have no competing interests.

Figures

Figure 1
Figure 1
Distinct defects caused by ham-1 mutation and genetic interactions with the apoptosis pathway in the lineages leading to C. elegans dopaminergic head neurons. (a) Dopaminergic head neurons in BY200 wild-type animals and in ham-1(gt1984) mutants. The dorsal cephalic sensilla (CEPD) neurons are located more posteriorly than the ventral cephalic sensilla (CEPV) neurons. A misplaced CEPD neuron is marked with an asterisk. (b) ham-1 gene structure with winged helix box DNA-binding domain (in white) and positions of mutations in ham-1(gt1984) (in orange) and ham-1(n1438) (in grey). gt1984 comprises a 554 base pair (bp) deletion spanning from the ham-1 promoter into the first exon and also includes a splice site mutation at the start of the second exon. The 238 bp deletion of the n1438 allele is within the gt1984 deletion. (c) Number of dopaminergic head neurons in BY200 wild-type and ham-1 mutant animals. Error bars = SEM of 2−4 biological replicates with 50 animals each. (d) Cartoon depicting the last divisions in the cell lineages that produce C. elegans dopaminergic head neurons (dopaminergic neurons are indicated with a solid black circle): left and right ventral cephalic sensilla neurons (CEPVL/R), left and right dorsal cephalic sensilla neurons (CEPDL/R) and left and right anterior deirids neurons (ADEL/R). Cells undergoing developmental apoptosis are marked with a cross. Daughter cells resulting from an anteroposterior division are labelled with ‘a’ and ‘p’, respectively, while daughter cells resulting from a left-right division are labelled with ‘l’ and ‘r’, respectively, starting from the ‘AB’ precursor cell. (e) Number of dopaminergic head neurons in the ham-1 mutant, in the apoptosis pathway mutants ced-3 and ced-4 and in the ced-4;ham-1 double mutant. Error bars = SEM of 2−4 biological replicates with 50 animals each.
Figure 2
Figure 2
pig-1 is epistatic to ham-1 in the CEPD neuron lineage and genetically interacts with the apoptosis pathway. (a) pig-1 gene structure with position of the predicted kinase and kinase-associated domains (both in white) and the pig-1(gm344) 562 bp deletion (in green). In gm344, 400 bp of the pig-1 promoter and the first 132 bp of the kinase domain are deleted. (b) Number of dopaminergic head neurons in the ham-1, pig-1 and pig-1;ham-1 mutant. (c) Number of dopaminergic head neurons in the pig-1, ced-4 and ced-4;pig-1 mutant. (d) Number of dopaminergic head neurons in the double and triple mutants of ham-1, pig-1 and ced-4. Error bars = SEM of 2–4 biological replicates with 50 animals each.
Figure 3
Figure 3
Mass spectrometry-based proteomics analysis and data deposition at the Encyclopedia of Proteome Dynamics (EPD). (a) Proteomics pipeline with a phosphopeptide enrichment step using titanium dioxide (TiO2) (for experimental details please refer to Materials and Methods). 95% of each peptide fraction was used to enrich for phosphopeptides using TiO2 affinity chromatography before being analysed by LC-MS/MS. In addition, 5% of the peptide fractions were directly measured with LC-MS/MS to assess global protein abundances. HILIC = hydrophilic interaction chromatography, TiO2 = titanium dioxide, LC-MS/MS = liquid chromatography tandem mass spectrometry. (b) Overview of protein abundance and post-translational modification (PTM) data from wild-type and pig-1 mutant embryos available in the Encyclopedia of Proteome Dynamics (EPD).
Figure 4
Figure 4
Global protein abundance changes in pig-1 mutant embryos. (a) Volcano plot (in log10 vs. log2 scale) depicting protein abundance changes in the pig-1 mutant embryo compared to wild-type embryos. The dashed orange and red lines indicate a p-value of 0.05 and 0.01 (1.3 and 2 in log10 scale), respectively. Boxed proteins were at least 2-fold down- or upregulated with a p-value of 0.05 and used for gene ontology term analysis. An interactive version of this volcano plot is available online via the EPD. To illustrate its functions, several proteins are highlighted and for one of them a tooltip with further available information is displayed. (b and c) Gene ontology term (GO) enrichment (biological process) of pig-1-variant proteins (boxed in the volcano plot). x and y-axis indicate semantic space used to group GO terms of related biological processes. Bubble sizes indicate the frequency of the GO term in the underlying C. elegans protein database (larger bubbles reflect more common terms) and bubble colour indicates statistical significance (the greener, the lower the p-value). (b) GO term analysis of proteins with at least 2-fold downregulated abundance in the pig-1 mutant (Supplementary Table 5a). (c) GO term analysis of proteins with at least 2-fold upregulated abundance in the pig-1 mutant (Supplementary Table 5b).
Figure 5
Figure 5
Abundance changes of key pathway proteins in pig-1 mutant embryos. Proteins exhibiting a significantly different abundance (in log2 scale) in pig-1 mutant embryos as compared to wild-type embryos, in at least two out of the three biological replicates (p-value < 0.05, two-tailed t-test; FDR < 5%) (replicate values are indicated in black and the calculated average over the replicates is indicated in red). Proteins are grouped according to their functional association with. (a) cell cycle regulation, (b) microtubule regulation, (c) actomyosin regulation, (d) asymmetric cell division, (e) cell death or phagocytosis, (f) cell adhesion, or (g) vesicle trafficking.
Figure 6
Figure 6
Phosphosites detected in wild-type and pig-1 mutant embryos. (a) Detected protein post translational modification (PTM) phosphorylation sites in wild-type embryos. Each grey line represents a phosphorylation site and models its behaviour across multiple dimensions. The phosphorylation lines intersect the y-axes on the values that were detected for the specific site. The axis dimensions are ‘modified amino acid’ (threonine (T), serine (S) or tyrosine (Y)), ‘protein intensity’ (in log10 scale), ‘site intensity’ (in log10 scale), ‘PTM site probability’, ‘position in protein’ (in log10 scale), ‘score’ (of identification, the product of all peptide posterior error probabilities used for identification that is calculated in MaxQuant), and number of ‘replicates with data’. (b) Detected protein phosphorylation sites of two example proteins in pig-1 mutant embryos - the grey lines for background phosphorylation were removed in this graph. Both of these plots are available online as interactive visualisations via the EPD (http://www.peptracker.com/epd/). Firstly, the axes can be filtered such that only elements contained within the user-defined boxes are shown: in the depicted graphs an example filter of ≥0.75 was applied for the ‘PTM site probability’ axis. Secondly, proteins can be searched and their phosphorylation sites can be highlighted in colour: Here, this was done for the same two example proteins and the search bar is shown on top of one of the graphs. Thirdly, selection of a phosphorylation line will lead to the display of a tooltip box containing further information: In the graphs shown, this was done for three examples of phosphorylation sites.
Figure 7
Figure 7
Global phosphoproteome changes in pig-1 mutant embryos. (a) Phosphorylation site abundance ratio (pig-1/wild-type) compared to protein abundance ratio (pig-1/wild-type). The orange dotted line indicates where the phosphorylation site ratio is equal to the protein ratio. Points within the orange and red areas are within one and two standard deviations from equality, respectively. An interactive version of this plot is accessible online via the EPD. In this illustration, detected phosphorylation sites for three example proteins were marked and a tooltip containing further information is shown for one of these phosphorylation sites. (b) Number of phosphorylated proteins detected either in wild-type (red) or in pig-1 mutant embryos (blue) or in both genetic backgrounds (purple overlap)(localisation probability >75%). (c and d) Gene ontology (GO) term enrichment (biological process) of pig-1 variant phosphosites. x- and y-axis indicate semantic space used to group GO terms of related biological processes. Bubble sizes indicate the frequency of the GO term in the underlying C. elegans protein database (larger bubbles reflect more common terms) and bubble colour indicates statistical significance (the greener, the lower the p-value). (c) GO term analysis of downregulated phosphosites in the pig-1 mutant (related to Supplementary Table 5c). Phosphosites downregulated in pig-1 (outside of the 2 standard deviation range in (a)) were pooled with phosphosites that were only detected in wild-type embryos (red in (b)). (d) GO term analysis of phosphosites with upregulated abundance in the pig-1 mutant (Supplementary Table 5d). Phosphosites upregulated in pig-1 mutant embryos (outside of the 2 standard deviation range in (a)) were pooled with the phosphosites that were only detected in pig-1 mutant embryos (blue in b)).
Figure 8
Figure 8
Phosphopeptide abundance changes of key pathway proteins in pig-1 mutant embryos. Ratio of phosphopeptide abundance and protein abundance (in log2 scale) in pig-1 mutants as compared to wild-type embryos (white diamonds). Phosphosites that were only detected in either pig-1 mutants (blue diamonds), or wild-type embryos (red diamonds), are shown above and below the y-axis, respectively. Proteins are grouped according to their functional association with (a) cell cycle regulation, (b) microtubule regulation, (c) actomyosin regulation, (d) asymmetric cell division, (e) cell death or phagocytosis, (f) cell adhesion, or (g) vesicle trafficking.

References

    1. Knoblich Ja. Asymmetric cell division: recent developments and their implications for tumour biology. Nat. Rev. Mol. Cell Biol. 2010;11:849–860. doi: 10.1038/nrm3010. - DOI - PMC - PubMed
    1. Goldstein B, Macara IG. The PAR Proteins: Fundamental Players in Animal Cell Polarization. Dev. Cell. 2007;13:609–622. doi: 10.1016/j.devcel.2007.10.007. - DOI - PMC - PubMed
    1. Bertrand, V. Β-Catenin-Driven Binary Cell Fate Decisions in Animal Development. Wiley Interdiscip. Rev. Dev. Biol. n/a–n/a, doi:10.1002/wdev.228 (2016). - PMC - PubMed
    1. Desai, C., Garriga, G., Mclntire, S. & Horvitz, H. A genetic pathway for the development of the Caenorhabditis elegans HSN motor neurons. Nature336 (1988). - PubMed
    1. Guenther C, Garriga G. Asymmetric distribution of the C. elegans HAM-1 protein in neuroblasts enables daughter cells to adopt distinct fates. Development. 1996;122:3509–18. - PubMed

Publication types

MeSH terms

LinkOut - more resources