. 2017 Jun 13:11:325.
doi: 10.3389/fnins.2017.00325. eCollection 2017.

A New Perspective for the Training Assessment: Machine Learning-Based Neurometric for Augmented User's Evaluation

Affiliations

A New Perspective for the Training Assessment: Machine Learning-Based Neurometric for Augmented User's Evaluation

Gianluca Borghini et al. Front Neurosci. .

Abstract

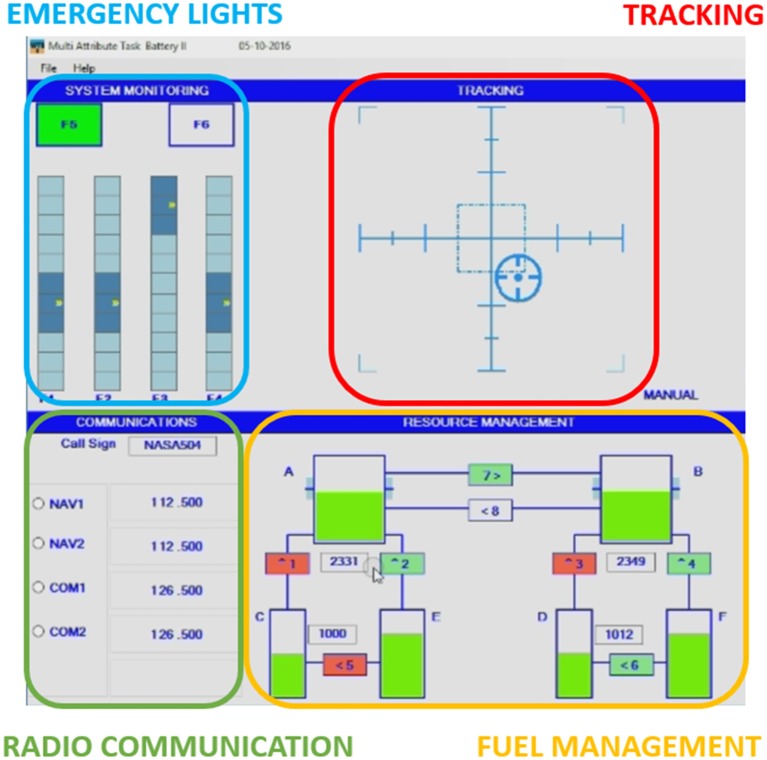
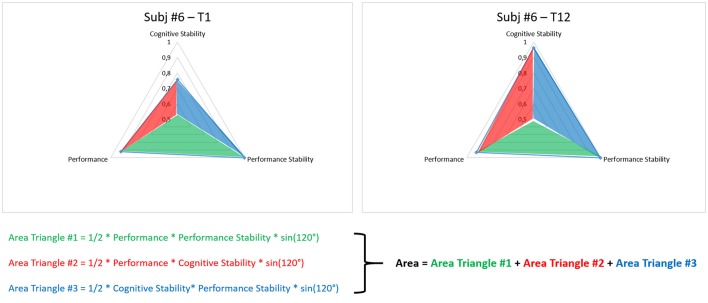
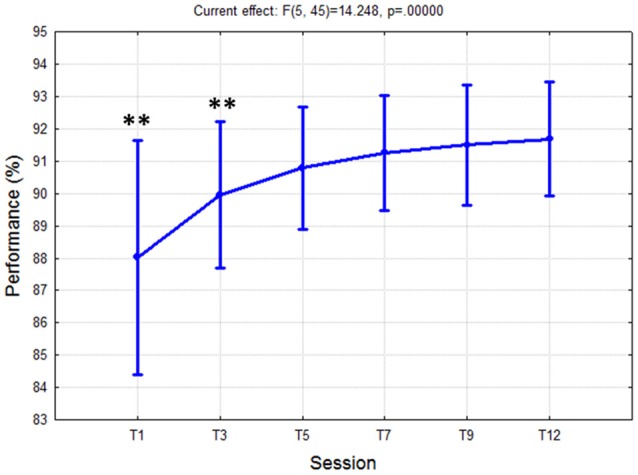
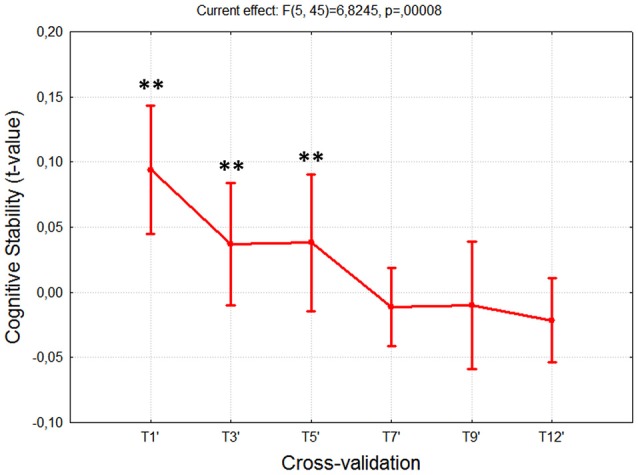
Inappropriate training assessment might have either high social costs and economic impacts, especially in high risks categories, such as Pilots, Air Traffic Controllers, or Surgeons. One of the current limitations of the standard training assessment procedures is the lack of information about the amount of cognitive resources requested by the user for the correct execution of the proposed task. In fact, even if the task is accomplished achieving the maximum performance, by the standard training assessment methods, it would not be possible to gather and evaluate information about cognitive resources available for dealing with unexpected events or emergency conditions. Therefore, a metric based on the brain activity (neurometric) able to provide the Instructor such a kind of information should be very important. As a first step in this direction, the Electroencephalogram (EEG) and the performance of 10 participants were collected along a training period of 3 weeks, while learning the execution of a new task. Specific indexes have been estimated from the behavioral and EEG signal to objectively assess the users' training progress. Furthermore, we proposed a neurometric based on a machine learning algorithm to quantify the user's training level within each session by considering the level of task execution, and both the behavioral and cognitive stabilities between consecutive sessions. The results demonstrated that the proposed methodology and neurometric could quantify and track the users' progresses, and provide the Instructor information for a more objective evaluation and better tailoring of training programs.

Keywords: EEG; brain activity; human factor; human machine interaction; machine learning; training assessment.


Figures

Figure 1
Figure 1
NASA Multi Attribute Task Battery (MATB) interface. Emergency lights task (SYSM) in the blue rectangle; Tracking task (TRCK) in the red rectangle; Radio Communication (COMM) in the green rectangle, and Fuel managing task (RMAN) in the orange rectangle (A–F are the fuel tanks).
Figure 2
Figure 2
The images reports an example of triangle by which is possible to quantify the training level of the user. In particular, the area of the triangle, defined by considering the Mean Performance, Performance Stability, and Cognitive Stability as vertices, has been calculated as the sum of the areas of three sub-triangles (Area Triangle #1, Area Triangle #2, and Area Triangle #3). Such triangles were identified by the three indexes and the origin of the coordinate system.
Figure 3
Figure 3
Task performance values over 3 weeks of training. The ANOVA showed a significant (p < 10−5) improvement of performance from T1 to T5, and then no differences were found between the rest of the sessions. Such results indicated that the subjects reached the task saturation in the session T5. “**” Means that the statistical significance level (p) is lower than 0.01. Vertical bars denote 0.95 confidence intervals (CI).
Figure 4
Figure 4
Cognitive Stability Index over 3 weeks of training. The ANOVA showed significant differences (p < 10−4) among the first sessions (T1÷T7), while no differences were found among the last ones (T7÷T12). Such results indicated that the subjects reached the cognitive stability in the session T7. “**” Means that the statistical significance level (p) is lower than 0.01. Vertical bars denote 0.95 confidence intervals (CI).
Figure 5
Figure 5
Scatter-plots of the correlation between the Mean Performance and the Cognitive Stability. The Pearson's analysis reported significant (p = 0.039) and high correlation (|R| > 0.89) between the measures, as demonstration that their integration could provide the Instructor objective data for the training assessment.
Figure 6
Figure 6
Training metric over 3 weeks of training. The proposed metric takes into account the level of task execution (performance), and both the behavioral and cognitive stabilities. The ANOVA showed significant differences (p < 10−5) among the first sessions (T1÷T7), while no differences were found among the last ones (T7÷T12). Such results indicated that the subjects reached a training stability in the session T7. “**” Means that the statistical significance level (p) is lower than 0.01. Vertical bars denote 0.95 confidence intervals (CI).
Figure 7
Figure 7
In order to quantify the users' training level along the training sessions, the behavioral and neurophysiological measures were integrated. Such measures were used to define the sides of a scalene triangle, and then the Area of such a triangle was calculated in each training session as measure of the training level. The Area was normalized with respect to its maximum with the aim to have as references of maximum training the value “1.”
Figure 8
Figure 8
The figure reports the Areas of a representative subject along the considered training sessions. It is possible to appreciate how the Subject 6 improved its behavioral and cognitive skills from the beginning (T1) to the end of the training period (T12).

References

    1. Aguinis H., Kraiger K. (2009). Benefits of training and development for individuals and teams, organizations, and society. Annu. Rev. Psychol. 60, 451–474. 10.1146/annurev.psych.60.110707.163505 - DOI - PubMed
    1. Anderson K. L., Rajagovindan R., Ghacibeh G. A., Meador K. J., Ding M. (2010). Theta oscillations mediate interaction between prefrontal cortex and medial temporal lobe in human memory. Cereb. Cortex 20, 1604–1612. 10.1093/cercor/bhp223 - DOI - PubMed
    1. Aricò P., Aloise F., Schettini F., Salinari S., Mattia D., Cincotti F. (2014). Influence of P300 latency jitter on event related potential-based brain-computer interface performance. J. Neural Eng. 11:035008. 10.1088/1741-2560/11/3/035008 - DOI - PubMed
    1. Aricò P., Borghini G., Di Flumeri G., Colosimo A., Bonelli S., Golfetti A., et al. . (2016a). Adaptive automation triggered by EEG-based mental workload index: a passive brain-computer interface application in realistic air traffic control environment. Front. Hum. Neurosci. 10:539. 10.3389/fnhum.2016.00539 - DOI - PMC - PubMed
    1. Aricò P., Borghini G., Di Flumeri G., Colosimo A., Pozzi S., Babiloni F. (2016b). A passive Brain-Computer Interface (p-BCI) application for the mental workload assessment on professional Air Traffic Controllers (ATCOs) during realistic ATC tasks. Prog. Brain Res. Press. 228, 295–328. 10.1016/bs.pbr.2016.04.021 - DOI - PubMed