

Risk-Conferring Glutamatergic Genes and Brain Glutamate Plus Glutamine in Schizophrenia
- PMID: 28659829
- PMCID: PMC5466972
- DOI: 10.3389/fpsyt.2017.00079
Risk-Conferring Glutamatergic Genes and Brain Glutamate Plus Glutamine in Schizophrenia
Abstract
Background: The proton magnetic resonance spectroscopy (1H-MRS) signals from glutamate (or the combined glutamate and glutamine signal-Glx) have been found to be greater in various brain regions in people with schizophrenia. Recently, the Psychiatric Genetics Consortium reported that several common single-nucleotide polymorphisms (SNPs) in glutamate-related genes confer increased risk of schizophrenia. Here, we examined the relationship between presence of these risk polymorphisms and brain Glx levels in schizophrenia.
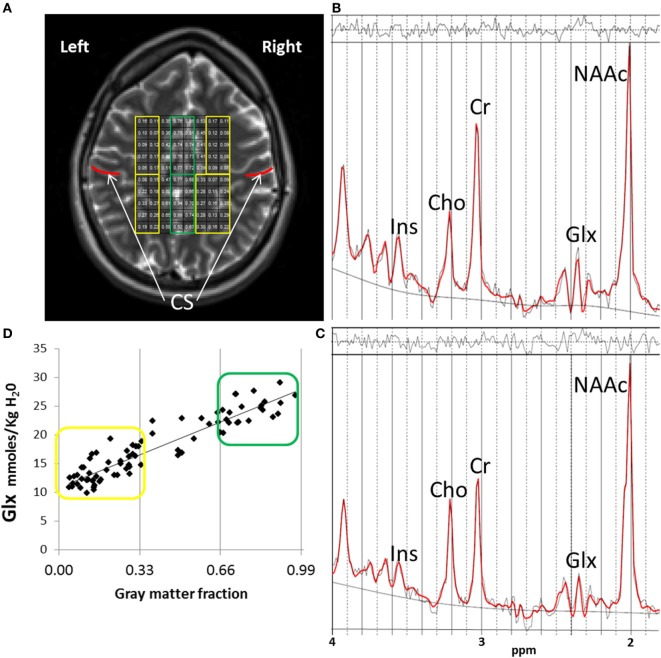
Methods: 1H-MRS imaging data from an axial, supraventricular tissue slab were acquired in 56 schizophrenia patients and 67 healthy subjects. Glx was measured in gray matter (GM) and white matter (WM) regions. The genetic data included six polymorphisms genotyped across an Illumina 5M SNP array. Only three of six glutamate as well as calcium-related SNPs were available for examination. These included three glutamate-related polymorphisms (rs10520163 in CLCN3, rs12704290 in GRM3, and rs12325245 in SLC38A7), and three calcium signaling polymorphisms (rs1339227 in RIMS1, rs7893279 in CACNB2, and rs2007044 in CACNA1C). Summary risk scores for the three glutamate and the three calcium polymorphisms were calculated.
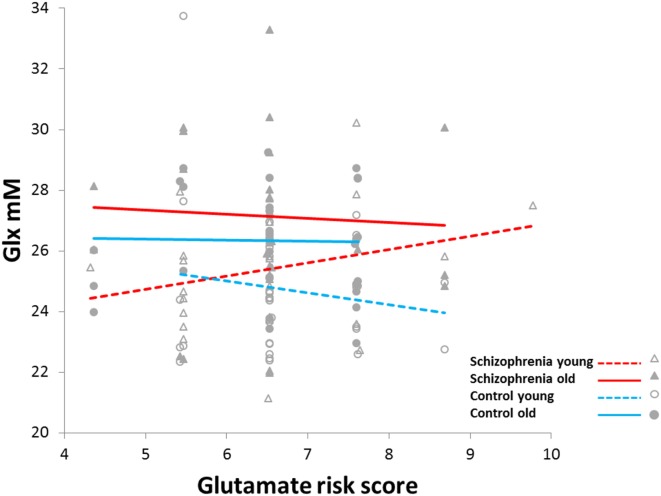
Results: Glx levels in GM positively correlated with glutamate-related genetic risk score but only in younger (≤36 years) schizophrenia patients (p = 0.01). Glx levels did not correlate with calcium risk scores. Glx was higher in the schizophrenia group compared to levels in controls in GM and WM regardless of age (p < 0.001).
Conclusion: Elevations in brain Glx are in part, related to common allelic variants of glutamate-related genes known to increase the risk for schizophrenia. Since the glutamate risk scores did not differ between groups, some other genetic or environmental factors likely interact with the variability in glutamate-related risk SNPs to contribute to an increase in brain Glx early in the illness.
Keywords: genetics; glutamate; schizophrenia; single-nucleotide polymorphisms; spectroscopy.
Figures
References
-
- de la Fuente-Sandoval C, Leon-Ortiz P, Azcarraga M, Stephano S, Favila R, Diaz-Galvis L, et al. Glutamate levels in the associative striatum before and after 4 weeks of antipsychotic treatment in first-episode psychosis: a longitudinal proton magnetic resonance spectroscopy study. JAMA Psychiatry (2013) 70(10):1057–66.10.1001/jamapsychiatry.2013.289 - DOI - PMC - PubMed
Grants and funding
LinkOut - more resources
Full Text Sources
Other Literature Sources