

Predicting Species-Resolved Macronutrient Acquisition during Succession in a Model Phototrophic Biofilm Using an Integrated 'Omics Approach
- PMID: 28659875
- PMCID: PMC5468372
- DOI: 10.3389/fmicb.2017.01020
Predicting Species-Resolved Macronutrient Acquisition during Succession in a Model Phototrophic Biofilm Using an Integrated 'Omics Approach
Abstract
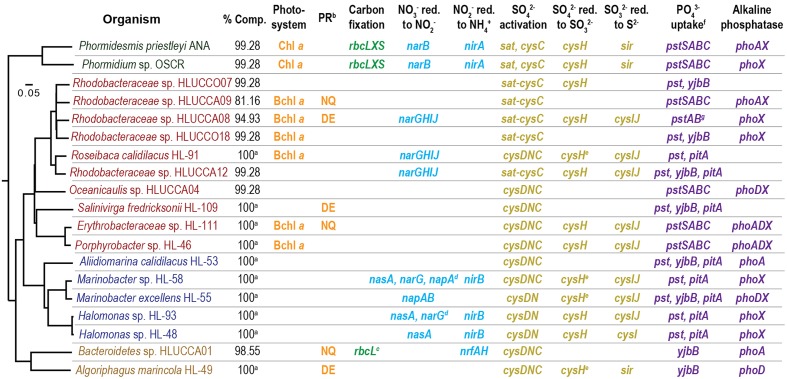
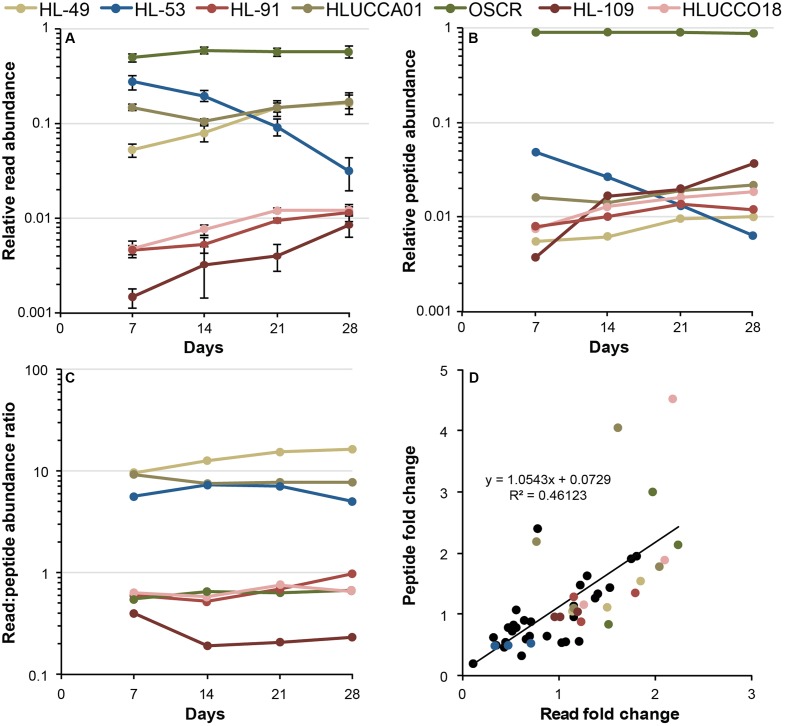
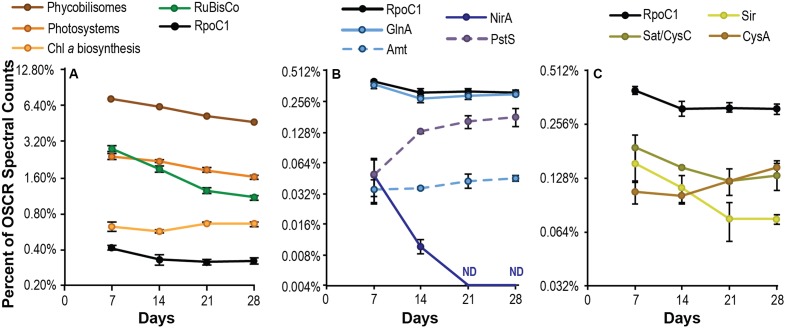
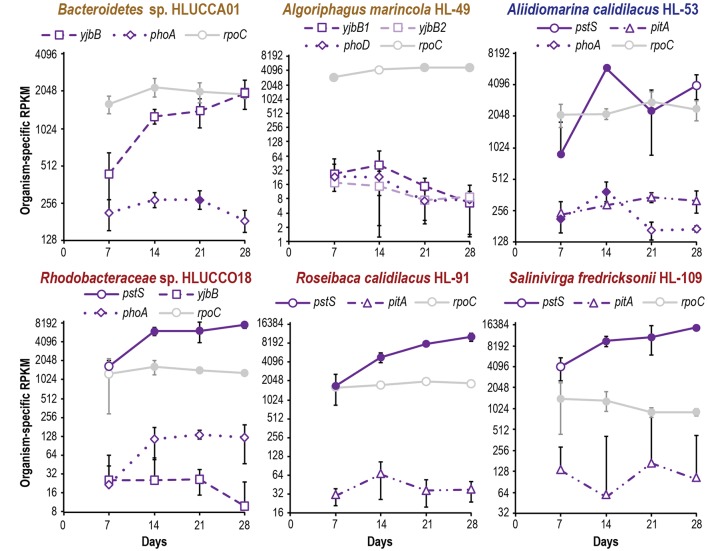
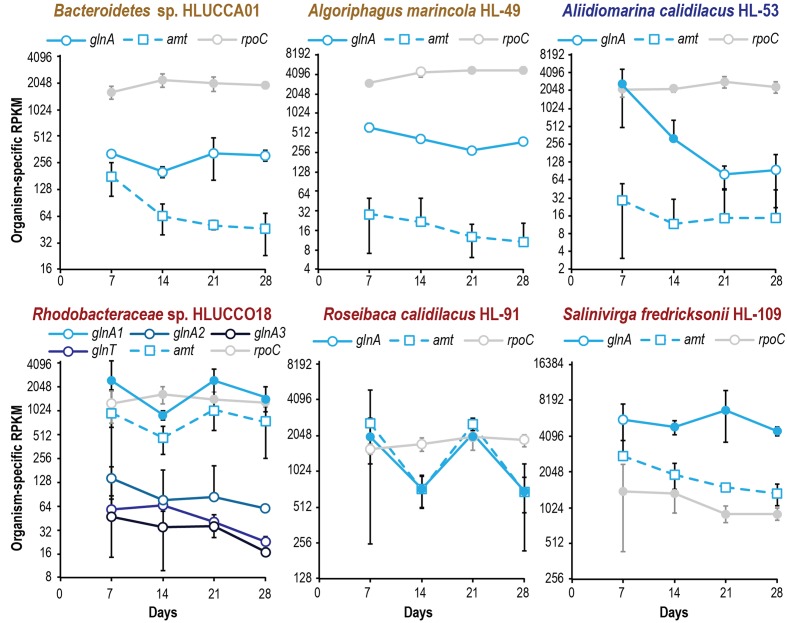
The principles governing acquisition and interspecies exchange of nutrients in microbial communities and how those exchanges impact community productivity are poorly understood. Here, we examine energy and macronutrient acquisition in unicyanobacterial consortia for which species-resolved genome information exists for all members, allowing us to use multi-omic approaches to predict species' abilities to acquire resources and examine expression of resource-acquisition genes during succession. Metabolic reconstruction indicated that a majority of heterotrophic community members lacked the genes required to directly acquire the inorganic nutrients provided in culture medium, suggesting high metabolic interdependency. The sole primary producer in consortium UCC-O, cyanobacterium Phormidium sp. OSCR, displayed declining expression of energy harvest, carbon fixation, and nitrate and sulfate reduction proteins but sharply increasing phosphate transporter expression over 28 days. Most heterotrophic members likewise exhibited signs of phosphorus starvation during succession. Though similar in their responses to phosphorus limitation, heterotrophs displayed species-specific expression of nitrogen acquisition genes. These results suggest niche partitioning around nitrogen sources may structure the community when organisms directly compete for limited phosphate. Such niche complementarity around nitrogen sources may increase community diversity and productivity in phosphate-limited phototrophic communities.
Keywords: carbon fixation; metagenomics; metaproteomics; metatranscriptomics; nitrate reduction; periphyton; phosphate transport; sulfate reduction.
Figures
Similar articles
-
Phototrophic biofilm assembly in microbial-mat-derived unicyanobacterial consortia: model systems for the study of autotroph-heterotroph interactions.Front Microbiol. 2014 Apr 7;5:109. doi: 10.3389/fmicb.2014.00109. eCollection 2014. Front Microbiol. 2014. PMID: 24778628 Free PMC article.
-
Indirect Interspecies Regulation: Transcriptional and Physiological Responses of a Cyanobacterium to Heterotrophic Partnership.mSystems. 2017 Mar 7;2(2):e00181-16. doi: 10.1128/mSystems.00181-16. eCollection 2017 Mar-Apr. mSystems. 2017. PMID: 28289730 Free PMC article.
-
The effect of carbon subsidies on marine planktonic niche partitioning and recruitment during biofilm assembly.Front Microbiol. 2015 Jul 14;6:703. doi: 10.3389/fmicb.2015.00703. eCollection 2015. Front Microbiol. 2015. PMID: 26236289 Free PMC article.
-
Metaproteomics: Sample Preparation and Methodological Considerations.Adv Exp Med Biol. 2019;1073:187-215. doi: 10.1007/978-3-030-12298-0_8. Adv Exp Med Biol. 2019. PMID: 31236844 Review.
-
Phosphorus physiological ecology and molecular mechanisms in marine phytoplankton.J Phycol. 2016 Feb;52(1):10-36. doi: 10.1111/jpy.12365. Epub 2016 Jan 11. J Phycol. 2016. PMID: 26987085 Review.
Cited by
-
Comparative genomics of the genus Roseburia reveals divergent biosynthetic pathways that may influence colonic competition among species.Microb Genom. 2020 Jul;6(7):mgen000399. doi: 10.1099/mgen.0.000399. Microb Genom. 2020. PMID: 32589566 Free PMC article.
-
New Methods, New Concepts: What Can Be Applied to Freshwater Periphyton?Front Microbiol. 2020 Jun 23;11:1275. doi: 10.3389/fmicb.2020.01275. eCollection 2020. Front Microbiol. 2020. PMID: 32670226 Free PMC article. Review.
-
The Microbial Mechanisms of a Novel Photosensitive Material (Treated Rape Pollen) in Anti-Biofilm Process under Marine Environment.Int J Mol Sci. 2022 Mar 30;23(7):3837. doi: 10.3390/ijms23073837. Int J Mol Sci. 2022. PMID: 35409199 Free PMC article.
-
Light availability impacts structure and function of phototrophic stream biofilms across domains and trophic levels.Mol Ecol. 2018 Jul;27(14):2913-2925. doi: 10.1111/mec.14696. Epub 2018 Jun 4. Mol Ecol. 2018. PMID: 29679511 Free PMC article.
-
MetFish: a Metabolomics Pipeline for Studying Microbial Communities in Chemically Extreme Environments.mSystems. 2021 Jun 29;6(3):e0105820. doi: 10.1128/mSystems.01058-20. Epub 2021 May 26. mSystems. 2021. PMID: 34061574 Free PMC article.
References
LinkOut - more resources
Full Text Sources
Other Literature Sources
Molecular Biology Databases