. 2017 Jun 12:8:671.
doi: 10.3389/fimmu.2017.00671. eCollection 2017.

Cell Polarization and Epigenetic Status Shape the Heterogeneous Response to Type III Interferons in Intestinal Epithelial Cells

Affiliations

Cell Polarization and Epigenetic Status Shape the Heterogeneous Response to Type III Interferons in Intestinal Epithelial Cells

Sudeep Bhushal et al. Front Immunol. .

Abstract

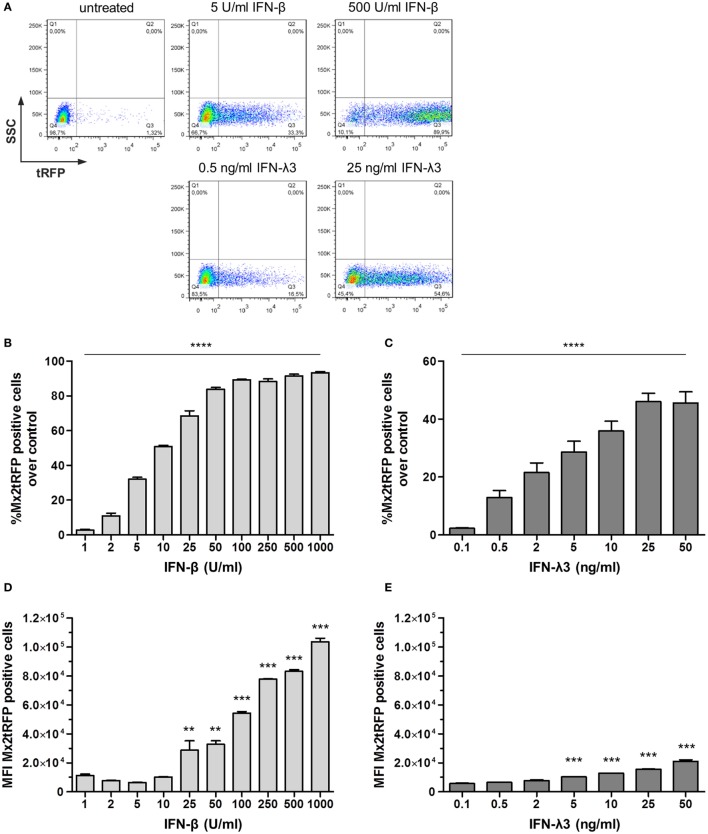
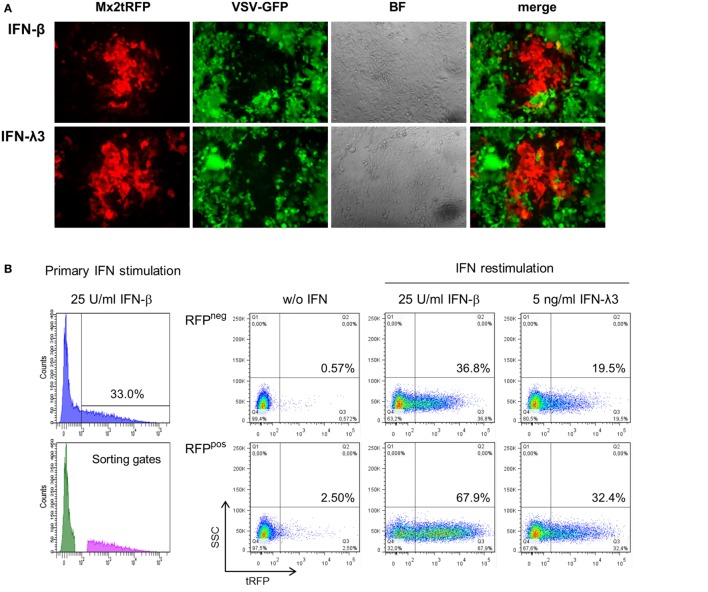
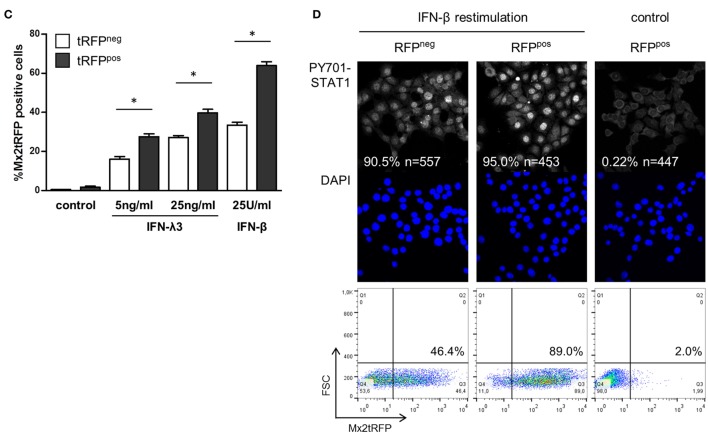
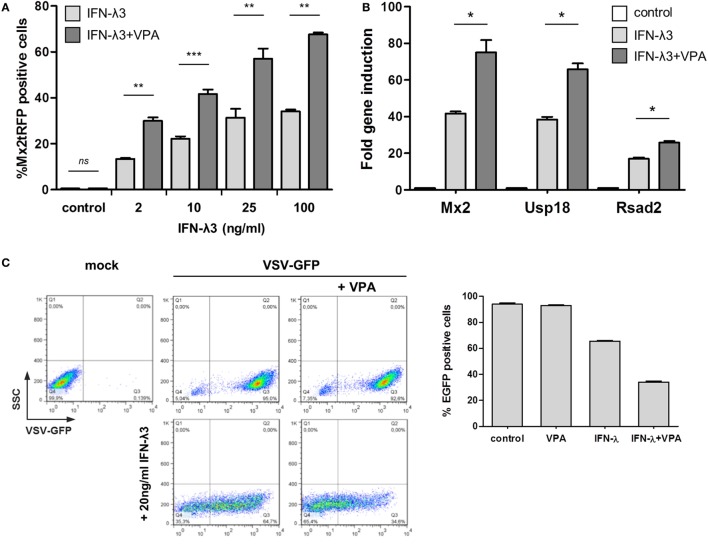
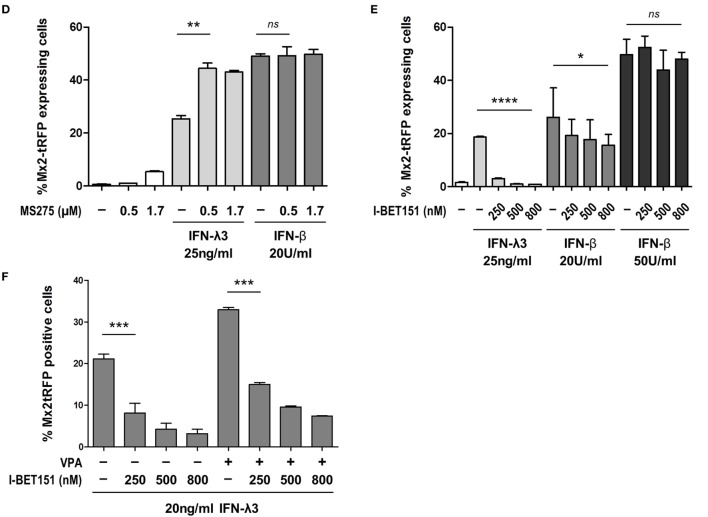
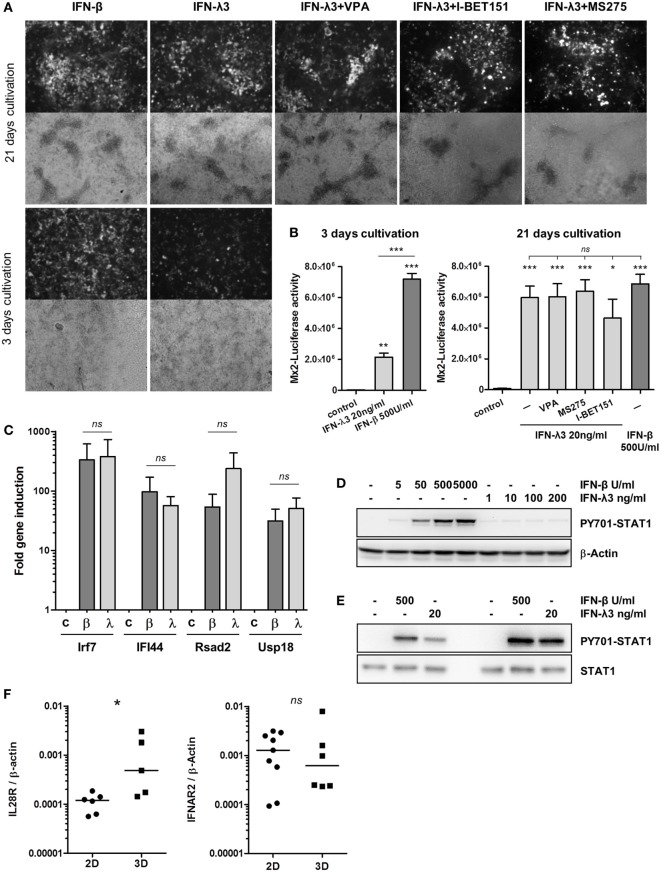
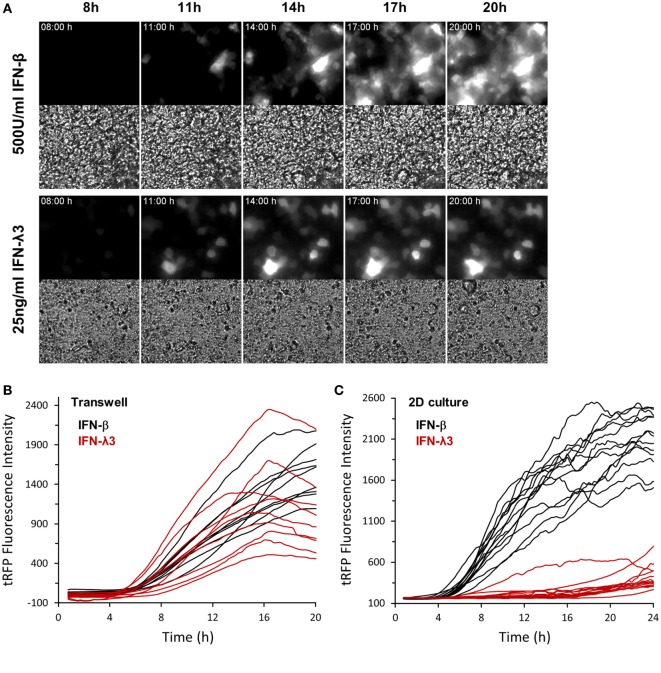
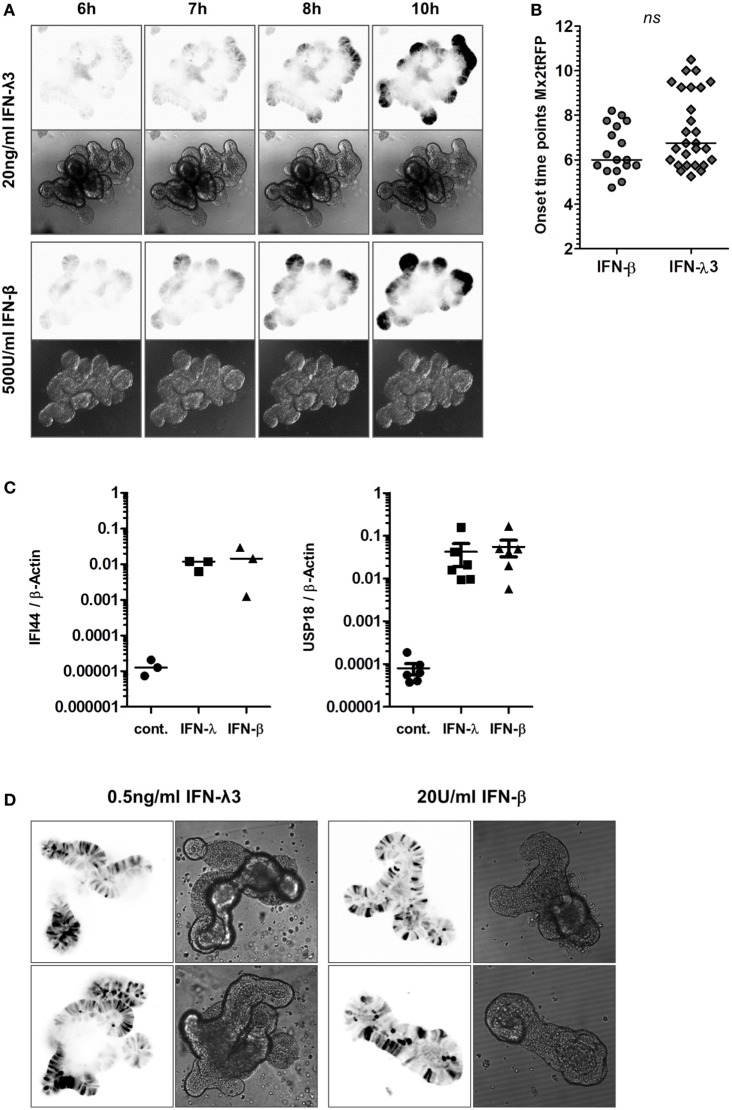
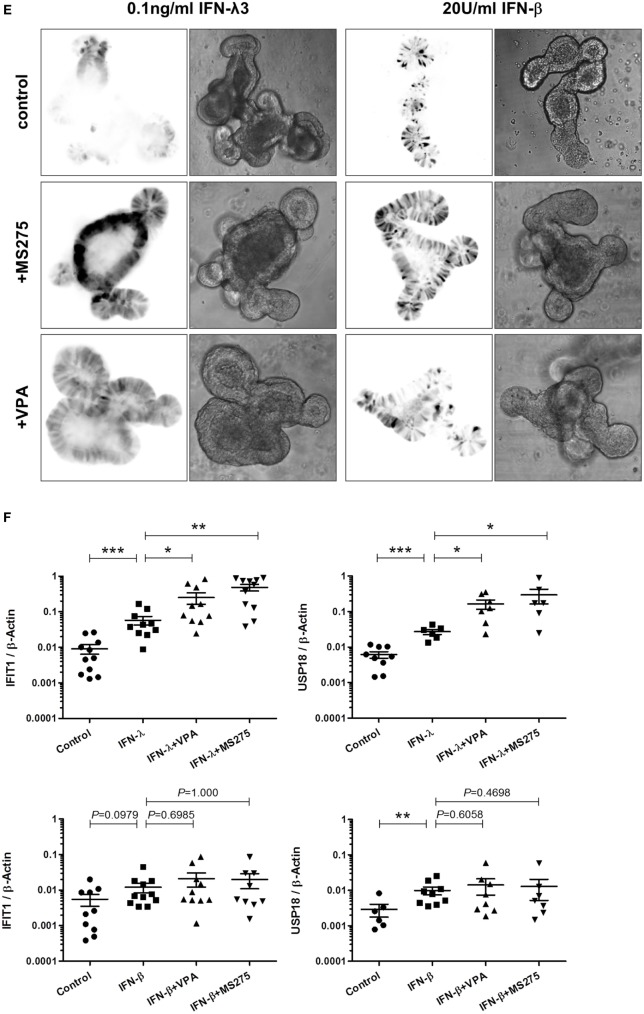
Type I and type III interferons (IFNs) are crucial components of the first-line antiviral host response. While specific receptors for both IFN types exist, intracellular signaling shares the same Jak-STAT pathway. Due to its receptor expression, IFN-λ responsiveness is restricted mainly to epithelial cells. Here, we display IFN-stimulated gene induction at the single cell level to comparatively analyze the activities of both IFN types in intestinal epithelial cells and mini-gut organoids. Initially, we noticed that the response to both types of IFNs at low concentrations is based on a single cell decision-making determining the total cell intrinsic antiviral activity. We identified histone deacetylase (HDAC) activity as a crucial restriction factor controlling the cell frequency of IFN-stimulated gene (ISG) induction upon IFN-λ but not IFN-β stimulation. Consistently, HDAC blockade confers antiviral activity to an elsewise non-responding subpopulation. Second, in contrast to the type I IFN system, polarization of intestinal epithelial cells strongly enhances their ability to respond to IFN-λ signaling and raises the kinetics of gene induction. Finally, we show that ISG induction in mini-gut organoids by low amounts of IFN is characterized by a scattered heterogeneous responsiveness of the epithelial cells and HDAC activity fine-tunes exclusively IFN-λ activity. This study provides a comprehensive description of the differential response to type I and type III IFNs and demonstrates that cell polarization in gut epithelial cells specifically increases IFN-λ activity.

Keywords: cell polarization; epithelial cell line; heterogeneous gene expression; interferon-lambda; small intestinal organoids.


Figures

Figure 1
Figure 1
Bimodal nature of gene expression toward type I and type III interferon (IFN) stimulation. Intestinal epithelial cell lines harboring the bacterial artificial chromosome construct Mx2tRFP were stimulated with different concentrations of IFN-β and IFN-λ3 for 20 h. Expression of the tRFP reporter was measured by flow cytometry (n = 5–7, mean ± SEM). (A) Representative dot plots show Mx2tRFP expression at high and low concentrations of IFN-β and IFN-λ3. (B,C) Percentage of Mx2tRFP-positive cells for all used concentrations of IFN-β and IFN-λ3. P values were calculated by one-way ANOVA. (D,E) Mean fluorescence intensity (MFI) of Mx2tRFP-postive cells. P values were calculated by one-way ANOVA, followed by Tukey’s Multiple Comparison Test (*P ≤ 0.05, **P ≤ 0.01, ***P ≤ 0.001). P values are given for differences among each stimulated group and control group.
Figure 2
Figure 2
“Memory” effect in IFN-stimulated cells. (A) Intestinal epithelial cell lines (IECs) harboring Mx2tRFP were stimulated with either 10 U/ml interferon (IFN)-β or 25 ng/ml IFN-λ3 for 20 h. Cells were infected with vesicular stomatitis virus-GFP (MOI 0.02) for 1 h and imaged by confocal microscopy 20 h post-infection. Representative pictures are shown. Data are representative of three independent experiments. (B) IECs were stimulated for 24 h with 25 U/ml IFN-β, and Mx2tRFP-positive and -negative populations were separated by cell sorting. Cells were cultured for 48 h in the absence of IFN, and responder and non-responder populations were restimulated for 20 h with the indicated concentrations of IFN-β and IFN-λ3. Mx2-driven tRFP expression was measured by flow cytometry. Representative FACS dot plots are shown. (C) Frequencies of Mx2tRFP expression in responder and non-responder populations upon IFN restimulation were calculated from two independent experiments (n = 4, mean ± SEM). P values were calculated by Mann–Whitney U test (*P ≤ 0.05). (D) Sorted Mx2tRFP-negative and Mx2tRFP-positive cell populations were cultured for 48 h in the absence of IFN. Both populations were stimulated for 1 h with 50 U/ml IFN-β, fixed, and processed by immunofluorescence staining against P-Y701 STAT1. Control column represents Mx2tRFP-positive cells without IFN treatment. Images were obtained by confocal microscopy, and the percentage of cells showing activated STAT1 in the nucleus was calculated (n indicates the number of analyzed cells). Representative pictures are shown. DAPI staining indicates localization of cell nuclei. Dot plots show representative Mx2tRFP expression analysis from (B) after restimulation with 50 U/ml IFN-β for 20 h.
Figure 2
Figure 2
“Memory” effect in IFN-stimulated cells. (A) Intestinal epithelial cell lines (IECs) harboring Mx2tRFP were stimulated with either 10 U/ml interferon (IFN)-β or 25 ng/ml IFN-λ3 for 20 h. Cells were infected with vesicular stomatitis virus-GFP (MOI 0.02) for 1 h and imaged by confocal microscopy 20 h post-infection. Representative pictures are shown. Data are representative of three independent experiments. (B) IECs were stimulated for 24 h with 25 U/ml IFN-β, and Mx2tRFP-positive and -negative populations were separated by cell sorting. Cells were cultured for 48 h in the absence of IFN, and responder and non-responder populations were restimulated for 20 h with the indicated concentrations of IFN-β and IFN-λ3. Mx2-driven tRFP expression was measured by flow cytometry. Representative FACS dot plots are shown. (C) Frequencies of Mx2tRFP expression in responder and non-responder populations upon IFN restimulation were calculated from two independent experiments (n = 4, mean ± SEM). P values were calculated by Mann–Whitney U test (*P ≤ 0.05). (D) Sorted Mx2tRFP-negative and Mx2tRFP-positive cell populations were cultured for 48 h in the absence of IFN. Both populations were stimulated for 1 h with 50 U/ml IFN-β, fixed, and processed by immunofluorescence staining against P-Y701 STAT1. Control column represents Mx2tRFP-positive cells without IFN treatment. Images were obtained by confocal microscopy, and the percentage of cells showing activated STAT1 in the nucleus was calculated (n indicates the number of analyzed cells). Representative pictures are shown. DAPI staining indicates localization of cell nuclei. Dot plots show representative Mx2tRFP expression analysis from (B) after restimulation with 50 U/ml IFN-β for 20 h.
Figure 3
Figure 3
Differential sensitivity of type I and type III interferons (IFNs) to inhibition of histone deacetylase and BRD3/4. (A) Intestinal epithelial cell lines (IECs) harboring Mx2tRFP were stimulated with increasing concentrations of IFN-λ3 in the absence or presence of 750 µM valproic acid (VPA). Frequency of Mx2tRFP expression was determined by flow cytometry after 24 h (n = 3–6, mean ± SEM). P values were calculated by paired t-test (*P ≤ 0.05, **P ≤ 0.01, ***P ≤ 0.001). (B) IECs were either untreated or treated with 10 ng/ml IFN-λ3 in the absence or presence of 750 µM VPA for 16 h. RNA was isolated, and qRT-PCR was used to determine the expression of Mx2, Usp18, and Rsad2. IFN-stimulated gene expression was normalized to β-Actin (n = 3, mean ± SEM). *P ≤ 0.05 by Mann–Whitney U test. (C) IECs were stimulated with 20 ng/ml IFN-λ3 in the absence or presence of 750 µM VPA for 20 h (lower panel). Control cells were not treated with IFN-λ (upper panel). Cells were infected with vesicular stomatitis virus-GFP (MOI 1) for 1 h and analyzed for eGFP expression by flow cytometry 8 h post-infection. Representative FACS dot plots show the percentage of eGFP-expressing cells. Graph represents mean eGFP frequency for each condition (n = 3, mean ± SEM). (D) IECs harboring Mx2tRFP were stimulated with 20 U/ml IFN-β or 25 ng/ml IFN-λ3 in the absence or presence of the indicated concentrations of MS275. Frequency of Mx2tRFP expression was determined by flow cytometry after 24 h (n = 3, mean ± SEM). **P ≤ 0.01 by paired t-test. (E) IECs were stimulated with IFN in the absence or presence of the indicated concentrations of I-BET151. Percentages of Mx2tRFP-positive cells are given (n = 3–9, mean ± SEM). P values were calculated by one-way ANOVA (*P ≤ 0.05, ****P ≤ 0.0001). (F) IECs harboring Mx2tRFP were stimulated with 20 ng/ml IFN-λ3 in the absence or presence of 750 µm VPA. As indicated, different concentrations of I-BET151 were added during stimulation, and flow cytometry was performed after 24 h (n = 3, mean ± SEM). P values were calculated by one-way ANOVA, followed by Tukey’s Multiple Comparison Test (***P ≤ 0.001).
Figure 3
Figure 3
Differential sensitivity of type I and type III interferons (IFNs) to inhibition of histone deacetylase and BRD3/4. (A) Intestinal epithelial cell lines (IECs) harboring Mx2tRFP were stimulated with increasing concentrations of IFN-λ3 in the absence or presence of 750 µM valproic acid (VPA). Frequency of Mx2tRFP expression was determined by flow cytometry after 24 h (n = 3–6, mean ± SEM). P values were calculated by paired t-test (*P ≤ 0.05, **P ≤ 0.01, ***P ≤ 0.001). (B) IECs were either untreated or treated with 10 ng/ml IFN-λ3 in the absence or presence of 750 µM VPA for 16 h. RNA was isolated, and qRT-PCR was used to determine the expression of Mx2, Usp18, and Rsad2. IFN-stimulated gene expression was normalized to β-Actin (n = 3, mean ± SEM). *P ≤ 0.05 by Mann–Whitney U test. (C) IECs were stimulated with 20 ng/ml IFN-λ3 in the absence or presence of 750 µM VPA for 20 h (lower panel). Control cells were not treated with IFN-λ (upper panel). Cells were infected with vesicular stomatitis virus-GFP (MOI 1) for 1 h and analyzed for eGFP expression by flow cytometry 8 h post-infection. Representative FACS dot plots show the percentage of eGFP-expressing cells. Graph represents mean eGFP frequency for each condition (n = 3, mean ± SEM). (D) IECs harboring Mx2tRFP were stimulated with 20 U/ml IFN-β or 25 ng/ml IFN-λ3 in the absence or presence of the indicated concentrations of MS275. Frequency of Mx2tRFP expression was determined by flow cytometry after 24 h (n = 3, mean ± SEM). **P ≤ 0.01 by paired t-test. (E) IECs were stimulated with IFN in the absence or presence of the indicated concentrations of I-BET151. Percentages of Mx2tRFP-positive cells are given (n = 3–9, mean ± SEM). P values were calculated by one-way ANOVA (*P ≤ 0.05, ****P ≤ 0.0001). (F) IECs harboring Mx2tRFP were stimulated with 20 ng/ml IFN-λ3 in the absence or presence of 750 µm VPA. As indicated, different concentrations of I-BET151 were added during stimulation, and flow cytometry was performed after 24 h (n = 3, mean ± SEM). P values were calculated by one-way ANOVA, followed by Tukey’s Multiple Comparison Test (***P ≤ 0.001).
Figure 4
Figure 4
Cell polarization increases the responsiveness to interferon (IFN)-λ. (A) intestinal epithelial cell lines (IECs) harboring Mx2tRFP were cultured on transwell inserts for 3 and 21 days. Cells were treated with 500 U/ml IFN-β or 20 ng/ml IFN-λ3. As indicated, IFN-λ3 stimulation was done together with 750 µM valproic acid (VPA), 500 nM MS275, and 500 nM I-BET151. Mx2tRFP expression was determined 24 h after stimulation by fluorescence microscopy. Representative images are shown. Data are representative of three independent experiments. (B) IEC-Mx2Luc-10 cells containing the Mx2-Luciferase reporter were cultured on transwell inserts for 3 and 21 days as indicated. Cells were treated with 500 U/ml IFN-β or 20 ng/ml IFN-λ3. IFN-λ3 stimulation was done together with 750 µM VPA, 500 nM MS275, and 500 nM I-BET151 as indicated. Luciferase activity was determined 20 h after stimulation (n = 3, mean ± SEM). P values were calculated by one-way ANOVA, followed by Tukey’s Multiple Comparison Test (*P ≤ 0.05, **P ≤ 0.01, ***P ≤ 0.001). P values are given for differences among stimulated groups and control group (directly above columns) and between IFN-stimulated groups. (C) IECs cultured on transwell inserts for 21 days were treated with 500 U/ml IFN-β (β) and 20 ng/ml IFN-λ3 (λ) for 16 h. RNA was isolated, and qRT-PCR was used to determine the expression of ISGs. Fold induction after normalization to β-Actin is depicted (n = 3, mean ± SEM). P values were calculated by Mann–Whitney U test (ns, not significant). (D) IECs cultured on standard cultures dishes were treated with increasing concentrations of IFN-β and IFN-λ3 for 1 h. Western blot analysis was performed using antibodies directed against P-Y701 STAT1 and β-Actin. (E) IECs cultured on transwell inserts were treated with 500 U/ml IFN-β and 20 ng/ml IFN-λ3 for 1 h. Cells were lysed, and protein extracts were analyzed by Western blotting using antibodies directed against P-Y701 STAT1 and total STAT1 protein. Results of two independent experiments are shown. (F) IECs were cultured on standard plastic dishes (2D) or on transwell inserts (3D) for 21 days. RNA was isolated, and qRT-PCR was used to determine the expression of IL28R and IFNAR2. Receptor expression was normalized to β-Actin. P values were calculated by Mann–Whitney U test (*P ≤ 0.05).
Figure 5
Figure 5
Cell polarization abrogates differential expression kinetics of type I and type III interferons (IFNs). Intestinal epithelial cell lines (IECs) harboring Mx2tRFP were cultured on transwell inserts for 21 days. Cells were treated with 500 U/ml IFN-β and 25 ng/ml IFN-λ3. Time-lapse fluorescence microscopy was used to follow the induction of Mx2tRFP in live cells. (A) Representative fluorescence and corresponding bright field images at selected time points are shown. (B) Mx2tRFP fluorescence intensities were quantified using ImageJ software. (C) IECs grown on standard culture dishes (2D) were treated with 500 U/ml IFN-β and 25 ng/ml IFN-λ3 and subjected to time-lapse fluorescence microscopy. Mx2tRFP fluorescence intensities were quantified over time using ImageJ software.
Figure 6
Figure 6
High responsiveness to interferon (IFN)-λ in intestinal organoids. Murine small intestinal crypts were isolated from Mx2tRFP transgenic mice. Mature organoids were obtained after incubating small intestinal crypts for 9–10 days in Matrigel. (A) Mx2tRFP organoids were treated with 20 ng/ml IFN-λ3 or 500 U/ml IFN-β and subjected to time-lapse confocal microscopy. Optical sections were acquired using identical acquisition settings for both types of IFNs. Mx2tRFP expression is shown at selected time points. Fluorescent images were inverted using ImageJ software. (B) Onset time points of Mx2tRFP expression were determined from time series after IFN-β and IFN-λ3 stimulation. P value was calculated by Mann–Whitney U test; ns, not significant. (C) Mx2tRFP organoids were treated with 20 ng/ml IFN-λ2 and 500 U/ml IFN-β for 9 h. RNA was isolated, and qRT-PCR was used to determine the expression of IFI44 and USP18. IFN-stimulated gene expression was normalized to β-Actin. (D) Mx2tRFP organoids were treated with 0.5 ng/ml IFN-λ3 and 20 U/ml IFN-β for 20 h and subjected to confocal fluorescence microscopy. For both IFN treatments, two representative single plane images show Mx2tRFP expression from intact organoids. Fluorescent images were inverted using ImageJ software. (E) Mx2tRFP organoids were treated for 16 h with 0.1 ng/ml IFN-λ3 or 20 U/ml IFN-β in the absence or presence of 750 µM valproic acid (VPA) and 0.51 µM MS275. Confocal fluorescence microscopy was used to collect single plane images from intact organoids 20 h after stimulation. Optical sections were acquired using identical acquisition settings for each type of IFN. Gain and offset were adjusted to use the entire dynamic range of the detector and to avoid saturation of the tRFP signal. Fluorescent images have been inverted using ImageJ software, and representative images showing Mx2tRFP expression are presented. (F) Mx2tRFP organoids were treated with 0.1 ng/ml IFN-λ3 and 20 U/ml IFN-β in the absence or presence of 750 µM VPA and 0.51 µM MS275. mRNA levels for IFIT1 and USP18 were determined by quantitative real-time PCR and normalized to β-Actin. P values were calculated by Mann–Whitney U test (*P ≤ 0.05, **P ≤ 0.01, ***P ≤ 0.001).
Figure 6
Figure 6
High responsiveness to interferon (IFN)-λ in intestinal organoids. Murine small intestinal crypts were isolated from Mx2tRFP transgenic mice. Mature organoids were obtained after incubating small intestinal crypts for 9–10 days in Matrigel. (A) Mx2tRFP organoids were treated with 20 ng/ml IFN-λ3 or 500 U/ml IFN-β and subjected to time-lapse confocal microscopy. Optical sections were acquired using identical acquisition settings for both types of IFNs. Mx2tRFP expression is shown at selected time points. Fluorescent images were inverted using ImageJ software. (B) Onset time points of Mx2tRFP expression were determined from time series after IFN-β and IFN-λ3 stimulation. P value was calculated by Mann–Whitney U test; ns, not significant. (C) Mx2tRFP organoids were treated with 20 ng/ml IFN-λ2 and 500 U/ml IFN-β for 9 h. RNA was isolated, and qRT-PCR was used to determine the expression of IFI44 and USP18. IFN-stimulated gene expression was normalized to β-Actin. (D) Mx2tRFP organoids were treated with 0.5 ng/ml IFN-λ3 and 20 U/ml IFN-β for 20 h and subjected to confocal fluorescence microscopy. For both IFN treatments, two representative single plane images show Mx2tRFP expression from intact organoids. Fluorescent images were inverted using ImageJ software. (E) Mx2tRFP organoids were treated for 16 h with 0.1 ng/ml IFN-λ3 or 20 U/ml IFN-β in the absence or presence of 750 µM valproic acid (VPA) and 0.51 µM MS275. Confocal fluorescence microscopy was used to collect single plane images from intact organoids 20 h after stimulation. Optical sections were acquired using identical acquisition settings for each type of IFN. Gain and offset were adjusted to use the entire dynamic range of the detector and to avoid saturation of the tRFP signal. Fluorescent images have been inverted using ImageJ software, and representative images showing Mx2tRFP expression are presented. (F) Mx2tRFP organoids were treated with 0.1 ng/ml IFN-λ3 and 20 U/ml IFN-β in the absence or presence of 750 µM VPA and 0.51 µM MS275. mRNA levels for IFIT1 and USP18 were determined by quantitative real-time PCR and normalized to β-Actin. P values were calculated by Mann–Whitney U test (*P ≤ 0.05, **P ≤ 0.01, ***P ≤ 0.001).

References

    1. Durbin RK, Kotenko SV, Durbin JE. Interferon induction and function at the mucosal surface. Immunol Rev (2013) 255:25–39. 10.1111/imr.12101 - DOI - PMC - PubMed
    1. Kotenko SV, Gallagher G, Baurin VV, Lewis-Antes A, Shen M, Shah NK, et al. IFN-lambdas mediate antiviral protection through a distinct class II cytokine receptor complex. Nat Immunol (2003) 4:69–77. 10.1038/ni875 - DOI - PubMed
    1. Sheppard P, Kindsvogel W, Xu W, Henderson K, Schlutsmeyer S, Whitmore TE, et al. IL-28, IL-29 and their class II cytokine receptor IL-28R. Nat Immunol (2003) 4:63–8. 10.1038/ni873 - DOI - PubMed
    1. Crouse J, Kalinke U, Oxenius A. Regulation of antiviral T cell responses by type I interferons. Nat Rev Immunol (2015) 15:231–42. 10.1038/nri3806 - DOI - PubMed
    1. Lazear HM, Nice TJ, Diamond MS. Interferon-λ: immune functions at barrier surfaces and beyond. Immunity (2015) 43:15–28. 10.1016/j.immuni.2015.07.001 - DOI - PMC - PubMed