. 2017 Jun 13:8:684.
doi: 10.3389/fimmu.2017.00684. eCollection 2017.

A Poly(Lactic- co-Glycolic) Acid Nanovaccine Based on Chimeric Peptides from Different Leishmania infantum Proteins Induces Dendritic Cells Maturation and Promotes Peptide-Specific IFNγ-Producing CD8+ T Cells Essential for the Protection against Experimental Visceral Leishmaniasis

Affiliations

A Poly(Lactic- co-Glycolic) Acid Nanovaccine Based on Chimeric Peptides from Different Leishmania infantum Proteins Induces Dendritic Cells Maturation and Promotes Peptide-Specific IFNγ-Producing CD8+ T Cells Essential for the Protection against Experimental Visceral Leishmaniasis

Evita Athanasiou et al. Front Immunol. .

Abstract

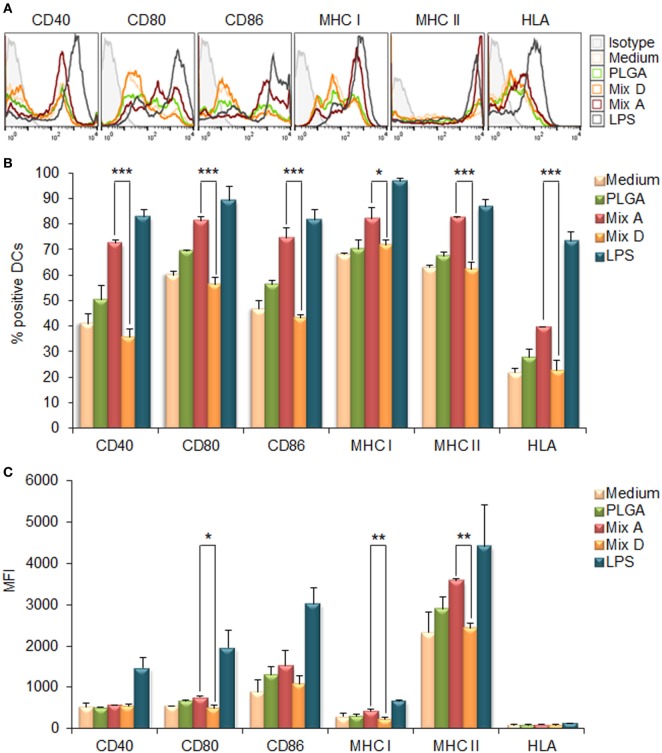
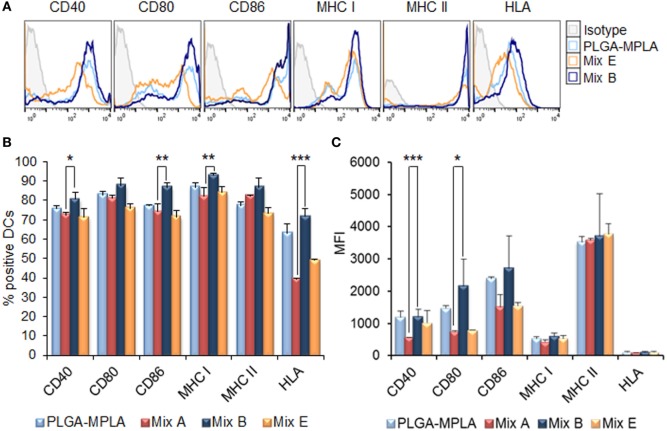
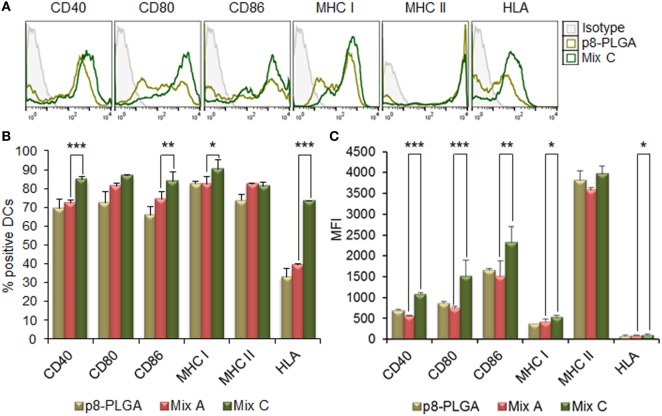
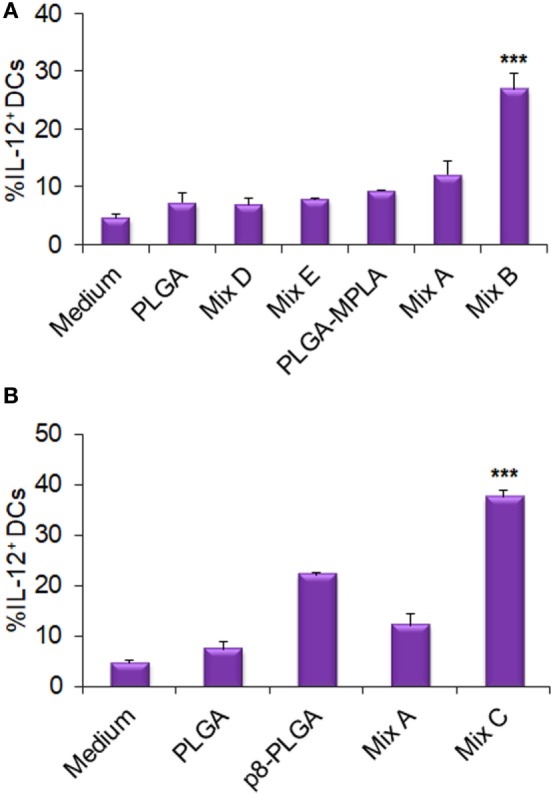
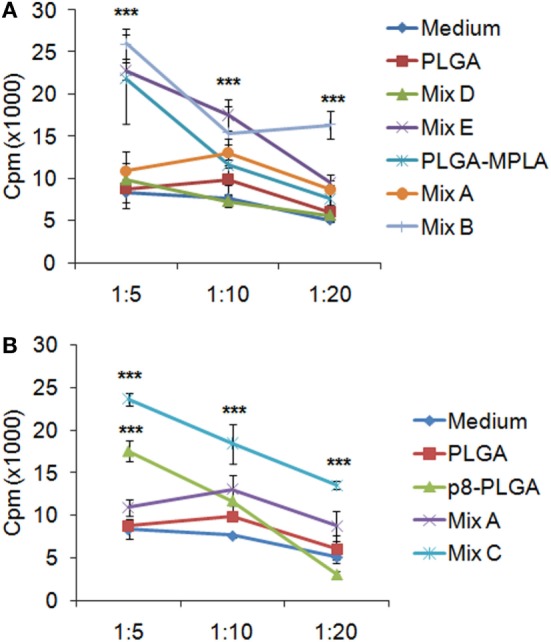
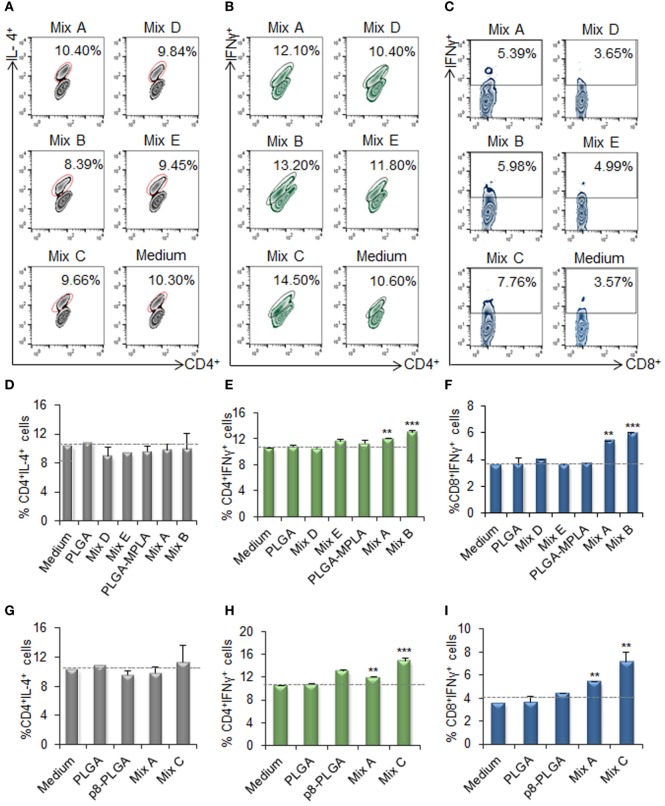
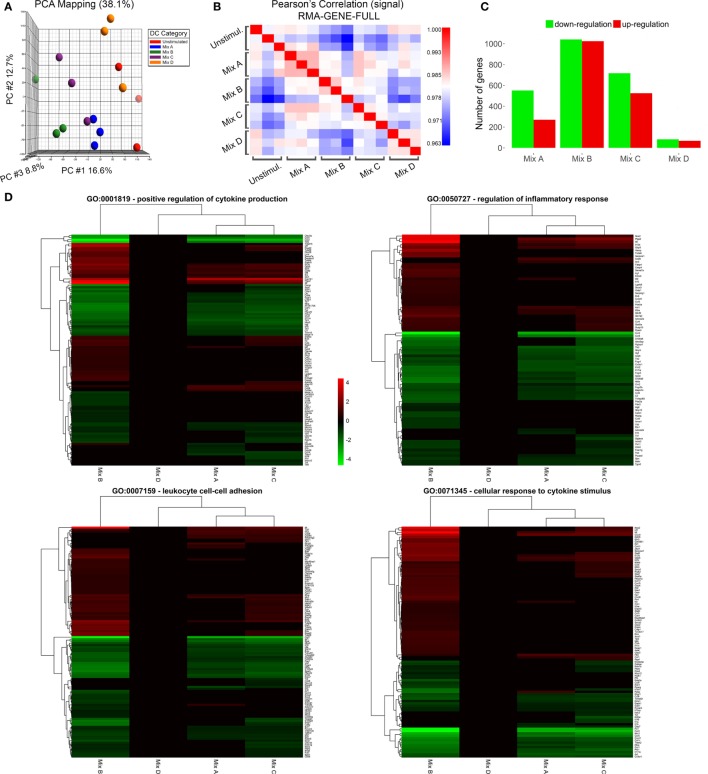
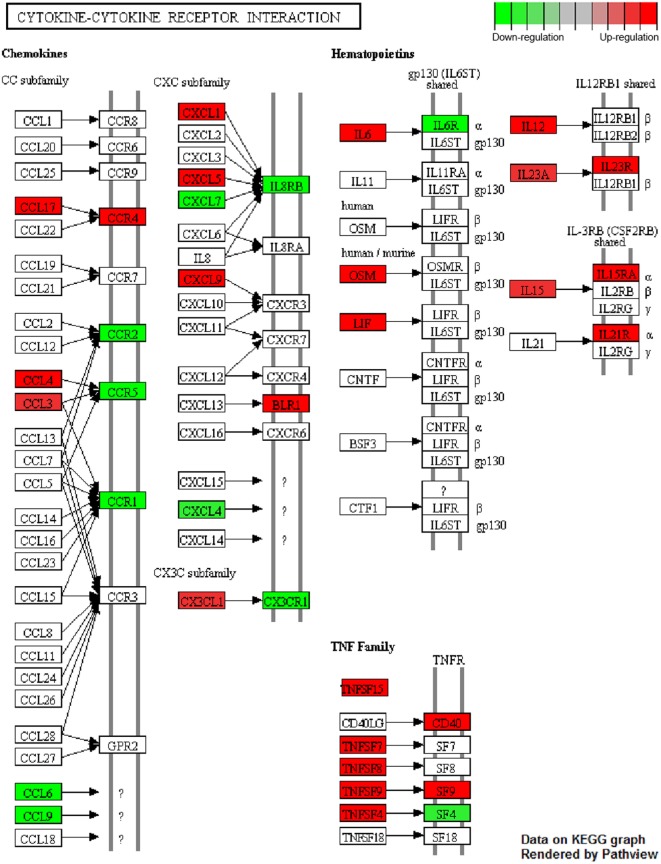
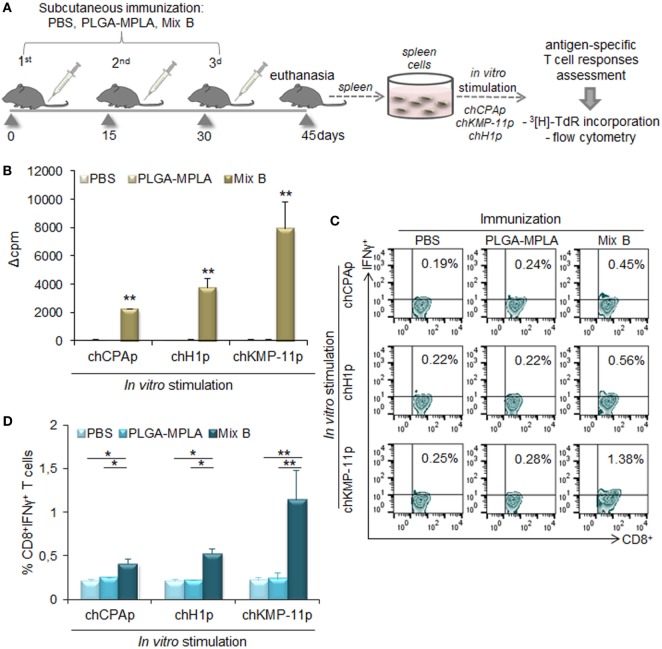
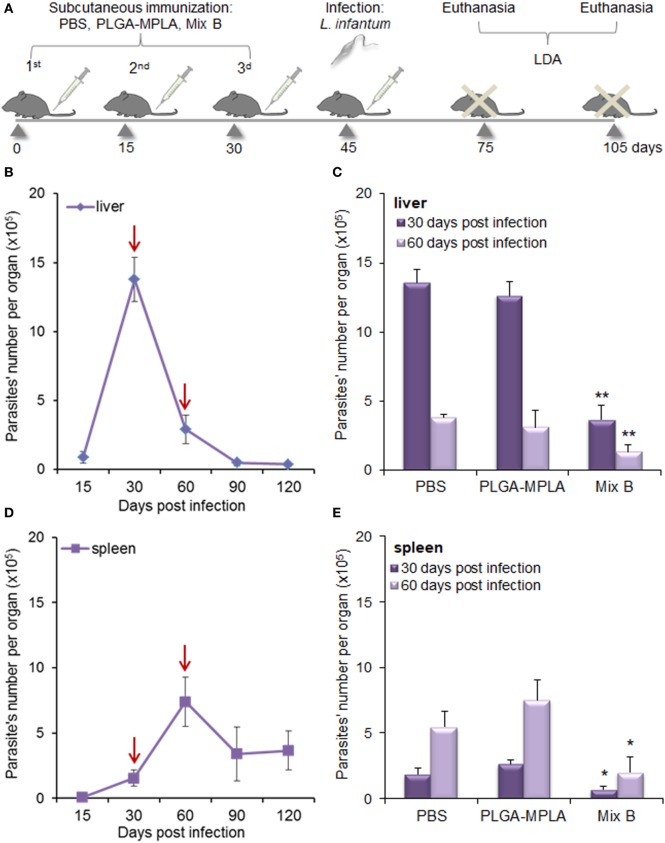
Visceral leishmaniasis, caused by Leishmania (L.) donovani and L. infantum protozoan parasites, can provoke overwhelming and protracted epidemics, with high case-fatality rates. An effective vaccine against the disease must rely on the generation of a strong and long-lasting T cell immunity, mediated by CD4+ TH1 and CD8+ T cells. Multi-epitope peptide-based vaccine development is manifesting as the new era of vaccination strategies against Leishmania infection. In this study, we designed chimeric peptides containing HLA-restricted epitopes from three immunogenic L. infantum proteins (cysteine peptidase A, histone H1, and kinetoplastid membrane protein 11), in order to be encapsulated in poly(lactic-co-glycolic) acid nanoparticles with or without the adjuvant monophosphoryl lipid A (MPLA) or surface modification with an octapeptide targeting the tumor necrosis factor receptor II. We aimed to construct differentially functionalized peptide-based nanovaccine candidates and investigate their capacity to stimulate the immunomodulatory properties of dendritic cells (DCs), which are critical regulators of adaptive immunity generated upon vaccination. According to our results, DCs stimulation with the peptide-based nanovaccine candidates with MPLA incorporation or surface modification induced an enhanced maturation profile with prominent IL-12 production, promoting allogeneic T cell proliferation and intracellular production of IFNγ by CD4+ and CD8+ T cell subsets. In addition, DCs stimulated with the peptide-based nanovaccine candidate with MPLA incorporation exhibited a robust transcriptional activation, characterized by upregulated genes indicative of vaccine-driven DCs differentiation toward type 1 phenotype. Immunization of HLA A2.1 transgenic mice with this peptide-based nanovaccine candidate induced peptide-specific IFNγ-producing CD8+ T cells and conferred significant protection against L. infantum infection. Concluding, our findings supported that encapsulation of more than one chimeric multi-epitope peptides from different immunogenic L. infantum proteins in a proper biocompatible delivery system with the right adjuvant is considered as an improved promising approach for the development of a vaccine against VL.

Keywords: Leishmania; chimeric peptides; dendritic cell transcriptome; peptide-based vaccine; poly(lactic-co-glycolic) acid nanoparticles.


Figures

Figure 1
Figure 1
In vitro release profile of the chimeric peptides from peptide-based poly(lactic-co-glycolic) acid (PLGA) nanoformulations. Time-dependent release of chCPAp and monophosphoryl lipid A (MPLA) adjuvant from PLGA-chCPAp-MPLA nanoformulations (A), chH1p and MPLA adjuvant from PLGA-chH1p-MPLA nanoformulations (B), and chKMP-11p and MPLA adjuvant from PLGA-chKMP-11p-MPLA nanoformulations (C) into PBS at 37°C. Data represent the mean ± SD of three independent experiments.
Figure 2
Figure 2
Encapsulation of chimeric peptides in poly(lactic-co-glycolic) acid (PLGA) nanoparticles (NPs) induced a strong maturation profile in dendritic cells (DCs) from HLA A2.1 transgenic mice. DCs were cultured for 24 h upon stimulation with the mix of PLGA-chCPAp, PLGA-chH1p, and PLGA-KMP-11p nanoformulations (mix A), the mix of soluble chimeric peptides (mix D), or empty PLGA NPs (control group). DCs cultured in medium alone or in the presence of 1 µg/ml LPS were used as negative and positive control, respectively. (A) Representative histogram plots of CD40, CD80, CD86, major histocompatibility complex (MHC) class I, and class II molecules levels. (B) Diagram demonstrating the percentage (%) of DCs expressing the co-stimulatory and MHC class I and class II molecules. (C) Diagram demonstrating the mean fluorescence index (MFI) of DCs expressing the co-stimulatory and MHC class I and class II molecules. Results are expressed as the mean ± SD of three independent experiments. Significant differences are indicated by *p < 0.05, **p < 0.01, or ***p < 0.001.
Figure 3
Figure 3
Monophosphoryl lipid A (MPLA) incorporation in peptide-based poly(lactic-co-glycolic) acid (PLGA) nanoformulations further enhanced the maturation of dendritic cells (DCs) from HLA A2.1 transgenic mice. DCs were cultured for 24 h upon stimulation with the mix of PLGA-chCPAp-MPLA, PLGA-chH1p-MPLA, and PLGA-KMP-11p-MPLA nanoformulations (mix B), the mix of soluble chimeric peptides with MPLA adjuvant (mix E), or PLGA nanoparticles with MPLA encapsulated. (A) Representative histogram plots of CD40, CD80, CD86, major histocompatibility complex (MHC) class I, and class II molecules levels. (B) Diagram demonstrating the percentage (%) of DCs expressing the co-stimulatory and MHC class I and class II molecules. (C) Diagram demonstrating the mean fluorescence index (MFI) of DCs expressing the co-stimulatory and MHC class I and class II molecules. Results are expressed as the mean ± SD of three independent experiments. Significant differences are indicated by *p < 0.05, **p < 0.01, or ***p < 0.001.
Figure 4
Figure 4
Surface modification of peptide-based poly(lactic-co-glycolic) acid (PLGA) nanoformulations with p8 also enhanced the maturation of dendritic cells (DCs) from HLA A2.1 transgenic mice. DCs were cultured for 24 h upon stimulation with the mix of p8-PLGA-chCPAp, p8-PLGA-chH1p, and p8-PLGA-KMP-11p nanoformulations (mix C) or PLGA nanoparticles surface modified with p8. (A) Representative histogram plots of CD40, CD80, CD86, major histocompatibility complex (MHC) class I, and class II molecules levels. (B) Diagram demonstrating the percentage (%) of DCs expressing the co-stimulatory and MHC class I and class II molecules. (C) Diagram demonstrating the mean fluorescence index (MFI) of DCs expressing the co-stimulatory and MHC class I and class II molecules. Results are expressed as the mean ± SD of three independent experiments. Significant differences are indicated by *p < 0.05, **p < 0.01, or ***p < 0.001.
Figure 5
Figure 5
Functional differentiation of dendritic cells (DCs) stimulated with the differentially functionalized peptide-based poly(lactic-co-glycolic) acid (PLGA) nanoformulations in terms of IL-12 production. DCs were cultured for 24 h upon stimulation with the mix of PLGA-chCPAp, PLGA-chH1p, and PLGA-chKMP-11p nanoformulations (mix A), the mix of PLGA-chCPAp-MPLA, PLGA-chH1p-MPLA, and PLGA-chKMP-11p-MPLA nanoformulations (mix B), the mix of p8-PLGA-chCPAp, p8-PLGA-chH1p, and p8-PLGA-chKMP-11p nanoformulations (mix C), the mix of soluble chimeric peptides (mix D), and the mix of soluble chimeric peptides plus MPLA (mix E). DCs cultured in medium alone were used as negative control. DCs were also stimulated with empty PLGA nanoparticles (NPs), PLGA NPs with MPLA encapsulated, and PLGA NPs surface modified with p8 as control groups. The diagrams indicate the effect of MPLA incorporation (A) or the effect of surface modification with p8 (B) in the percentage of DCs producing IL-12. Results are expressed as the mean ± SD of three independent experiments. Significant differences between DCs stimulated with the mix B or the mix C and DCs stimulated with the mix A are indicated by ***p < 0.001.
Figure 6
Figure 6
T cell priming induced by dendritic cells (DCs) stimulated with the differentially functionalized peptide-based poly(lactic-co-glycolic) acid (PLGA) nanoformulations. Spleen cells from naïve BALB/c mice were primed in vitro by DCs stimulated for 24 h with the mix of PLGA-chCPAp, PLGA-chH1p, and PLGA-KMP-11p nanoformulations (mix A), the mix of PLGA-chCPAp-MPLA, PLGA-chH1p-MPLA, and PLGA-KMP-11p-MPLA nanoformulations (mix B), the mix of p8-PLGA-chCPAp, p8-PLGA-chH1p, and p8-PLGA-KMP-11p nanoformulations (mix C), the mix of soluble chimeric peptides (mix D), and the mix of soluble chimeric peptides plus MPLA (mix E). Cultures were pulsed for the last 18 h with 1 μCi of 3[H]-TdR, and the proliferative potential was measured by 3[H]-TdR incorporation. The diagrams indicate the effect of MPLA incorporation (A) or the effect of surface modification with p8 (B) in the capacity of DCs stimulated with the mix B or the mix C to induce T cell priming. Samples were run in triplicates. Results are depicted as cpm ± SD from three independent experiments. Significant differences are indicated by ***p < 0.001.
Figure 7
Figure 7
IFNγ-producing CD4+ and CD8+ T cells among the spleen cell populations primed by dendritic cells (DCs) stimulated with the mix B or C. Spleen cells from naïve BALB/c mice were primed in vitro by DCs stimulated for 24 h with the different mixes of differentially functionalized nanoformulations (mix A, mix B, and mix C), the mix of soluble chimeric peptides (mix D), and the mix of soluble chimeric peptides plus monophosphoryl lipid A (MPLA) (mix E). Then, spleen cells were stained and analyzed by flow cytometry. The representative contour plots depict IL-4-producing CD4+ T cells (A), and IFNγ-producing CD4+ (B), and CD8+ (C) T cells. Diagram showing the percentage of (D,G) IL-4-producing CD4+ T cells, (E,H) IFNγ-producing CD4+, and (F,I) IFNγ-producing CD8+ T cells. Results are expressed as the mean ± SD and significant differences between T cells activated by DCs stimulated with mix A, mix B or mix C and T cells activated by unstimulated DCs are indicated by **p < 0.01, or ***p < 0.001.
Figure 8
Figure 8
Microarray sample quality control and differential expression analysis. (A) Principal component analysis clustering of microarray samples and (B) sample-sample correlation heat map depicting relationship between replicates and/or samples. (C) Barplot of differentially up- and downregulated genes of dendritic cells (DCs) stimulated with the mix of poly(lactic-co-glycolic) acid (PLGA)-chCPAp, PLGA-chH1p, and PLGA-KMP-11p nanoformulations (mix A), the mix of PLGA-chCPAp-monophosphoryl lipid A (MPLA), PLGA-chH1p-MPLA, and PLGA-KMP-11p-MPLA nanoformulations (mix B), the mix of p8-PLGA-chCPAp, p8-PLGA-chH1p, and p8-PLGA-KMP-11p nanoformulations (mix C), or the mix of soluble chimeric peptides (mix D) vs. unstimulated DCs. (D) Heatmap representations of differentially expressed genes included in GO terms GO:0001819—positive regulation of cytokine production, GO:0050727—regulation of inflammatory response, GO:0007159—leukocyte cell–cell adhesion and GO:0071345—cellular response to cytokine stimulus. Instances with −0.585 < log2(fold change) < 0.585 and/or p-value >0.05 significance threshold are not colored. A p-value threshold of 0.05 and a log2 (fold change) threshold of ±0.585 (at least1.5-fold change) was used to determine differentially expressed genes of samples Mix A–D vs. unstimulated DCs.
Figure 9
Figure 9
Cytokine–cytokine receptor interaction pathway. Genes found to be differentially up- (red) and downregulated (green) in dendritic cells (DCs) stimulated with the mix of PLGA-chCPAp-MPLA, PLGA-chH1p-MPLA, and PLGA-KMP-11p-MPLA nanoformulations (mix B) compared to unstimulated DCs. “Cytokine-cytokine receptor interaction” (mmu04060) KEGG pathway was adapted in order to place emphasis specifically on the deregulated genes (p < 0.05, 1.5-fold upregulation or downregulation), as dictated by the microarray experiments. Pathview package was utilized to color nodes of differentially expressed genes.
Figure 10
Figure 10
Immunization with the mix of peptide-based poly(lactic-co-glycolic) acid (PLGA) nanoformulations with monophosphoryl lipid A (MPLA) incorporation induced peptide-specific T cell responses in HLA A2.1 transgenic mice. (A) Immunization scheme. Mice were subcutaneously immunized with the mix of PLGA-chCPAp-MPLA, PLGA-chH1p-MPLA, and PLGA-KMP-11p-MPLA nanoformulations (mix B), PLGA-MPLA nanoformulations or only PBS. Two weeks after the last boosting dose, the spleen of each mouse was aseptically removed and spleen cells were stimulated in vitro with each of the chimeric peptides (chCPAp, chH1p, and chKMP-11p) in order to assess induced peptide-specific T cell responses. (B) Peptide-specific T cell expansion was measured by 3[H]-TdR incorporation. Samples were run in triplicates. Results are represented as Δcpm ± SD (cpm of stimulated spleen cells—cpm of unstimulated spleen cells), and significant differences are indicated by **p < 0.01. (C,D) In vitro-stimulated spleen cells were stained with fluorochrome-labeled anti-CD3, anti-CD8, and anti-IFNγ monoclonal antibodies and analyzed with flow cytometry. (C) The representative contour plots depict the peptide-specific IFNγ-producing CD8+ T cells. (D) The diagrams show the percentage of peptide-specific IFNγ-producing CD8+ T cells. Results are expressed as the mean ± SD and significant differences between spleen cells from mice immunized with mix B and spleen cells from mice immunized with PLGA-MPLA or PBS are indicated by *p < 0.05 or **p < 0.01.
Figure 11
Figure 11
Immunization with the mix of peptide-based poly(lactic-co-glycolic) acid (PLGA) nanoformulations with monophosphoryl lipid A (MPLA) incorporation conferred significant protection against Leishmania infantum infection in HLA A2.1 transgenic mice. (A) Immunization and infection scheme. Mice were subcutaneously immunized with the mix of PLGA-chCPAp-MPLA, PLGA-chH1p-MPLA, and PLGA-KMP-11p-MPLA nanoformulations (mix B), PLGA-MPLA nanoformulations or only PBS. Two weeks after the last boosting dose, immunized and non-immunized mice were infected intravenously with 2 × 107 L. infantum promastigotes and parasite burden was evaluated 1 and 2 months post-infection with a limiting dilution assay. (B,D) Time course of infection in liver (B) and spleen (D) of HLA A2.1 transgenic mice infected with L. infantum promastigotes. Red arrows indicate the time points selected for the evaluation of immunization’s protective effect. (C,E) Parasite burden in the liver (C) and the spleen (E) of immunized and non-immunized mice 1 and 2 months post-infection with L. infantum. Results are presented as the mean ± SD of five individual mice per group and significant differences between the parasite burden of immunized with mix B mice and the parasite burden of non-immunized mice are indicated by *p < 0.05 or **p < 0.01.

References

    1. World Health Organization. Visceral Leishmaniasis: Control Strategies and Epidemiological Situation Update in East Africa, Report of a WHO Bi-Regional Consultation Addis Ababa, Ethiopia. (2015). Available from: http://www.who.int/leishmaniasis/resources/978924150965/en/
    1. Alvar J, Vélez ID, Bern C, Herrero M, Desjeux P, Cano J, et al. WHO leishmaniasis control team leishmaniasis worldwide and global estimates of its incidence. PLoS One (2012) 7(5):e35671. 10.1371/journal.pone.0035671 - DOI - PMC - PubMed
    1. Ready PD. Epidemiology of visceral leishmaniasis. Clin Epidemiol (2014) 6:147–54. 10.2147/CLEP.S44267 - DOI - PMC - PubMed
    1. Kaye P, Scott P. Leishmaniasis: complexity at the host-pathogen interface. Nat Rev Microbiol (2011) 9:604–15. 10.1038/nrmicro2608 - DOI - PubMed
    1. Rodrigues V, Cordeiro-da-Silva A, Laforge M, Silvestre R, Estaquier J. Regulation of immunity during visceral Leishmania infection. Parasit Vectors (2016) 9:118. 10.1186/s13071-016-1412-x - DOI - PMC - PubMed