Review
. 2017 Jun 9:8:900.
doi: 10.3389/fpls.2017.00900. eCollection 2017.

Morphological Plant Modeling: Unleashing Geometric and Topological Potential within the Plant Sciences

Affiliations
Review

Morphological Plant Modeling: Unleashing Geometric and Topological Potential within the Plant Sciences

Alexander Bucksch et al. Front Plant Sci. .

Abstract

The geometries and topologies of leaves, flowers, roots, shoots, and their arrangements have fascinated plant biologists and mathematicians alike. As such, plant morphology is inherently mathematical in that it describes plant form and architecture with geometrical and topological techniques. Gaining an understanding of how to modify plant morphology, through molecular biology and breeding, aided by a mathematical perspective, is critical to improving agriculture, and the monitoring of ecosystems is vital to modeling a future with fewer natural resources. In this white paper, we begin with an overview in quantifying the form of plants and mathematical models of patterning in plants. We then explore the fundamental challenges that remain unanswered concerning plant morphology, from the barriers preventing the prediction of phenotype from genotype to modeling the movement of leaves in air streams. We end with a discussion concerning the education of plant morphology synthesizing biological and mathematical approaches and ways to facilitate research advances through outreach, cross-disciplinary training, and open science. Unleashing the potential of geometric and topological approaches in the plant sciences promises to transform our understanding of both plants and mathematics.

Keywords: mathematics; modeling; morphology; plant biology; plant science; topology.


Figures

FIGURE 1
FIGURE 1
Plant morphology from the perspective of biology. Adapted from Kaplan (2001). Plant morphology interfaces with all disciplines of plant biology—plant physiology, plant genetics, plant systematics, and plant ecology—influenced by both developmental and evolutionary forces.
FIGURE 2
FIGURE 2
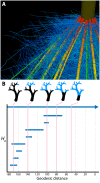
Plant morphology from the perspective of mathematics. (A) The topological complexity of plants requires a mathematical framework to describe and simulate plant morphology. Shown is the top of a maize crown root 42 days after planting. Color represents root diameter, revealing topology and different orders of root architecture. Image by Jennifer T. Yang and provided by JPL (Pennsylvania State University). (B) Persistent homology deforms a given plant morphology using functions to define self-similarity in a structure. In this example, a geodesic distance function is traversed to the ground level of a tree (that is, the shortest curved distance of each voxel to the base of the tree), as visualized in blue in successive images. The branching structure, as defined across scales of the geodesic distance function is recorded as an H0 (zero-order homology) barcode, which in persistent homology refers to connected components. As the branching structure is traversed by the function, connected components are “born” and “die” as terminal branches emerge and fuse together. Each of these components is indicated as a bar in the H0 barcode, and the correspondence of the barcode to different points in the function is indicated by vertical lines, in pink. Images provided by ML (Danforth Plant Science Center).
FIGURE 3
FIGURE 3
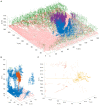
Terrestrial laser scanning creates a point cloud reconstruction of a Finnish forest. (A) Structure of a boreal forest site in Finland as seen with airborne (ALS) and terrestrial (TLS) laser scanning point clouds. The red (ground) and green (above-ground) points are obtained from National Land Survey of Finland national ALS point clouds that cover hundreds of thousands of square kilometers with about 1 point per square meter resolution. The blue and magenta point clouds are results of two individual TLS measurements and have over 20 million points each within an area of about 500 m2. TLS point density varies with range but can be thousands of points per square meter up to tens of meters away from the scanner position. (B) An excerpt from a single TLS point cloud (blue). The TLS point cloud is so dense that individual tree point clouds (orange) and parts from them (yellow) can be selected for detailed analysis. (C) A detail from a single TLS point cloud. Individual branches (yellow) 20 m above ground can be inspected from the point cloud with centimeter level resolution to estimate their length and thickness. Images provided by EP (Finnish Geospatial Research Institute in the National Land Survey of Finland). ALS data was obtained from the National Land Survey of Finland Topographic Database, 08/2012 (National Land Survey of Finland open data license, version 1.0).
FIGURE 4
FIGURE 4
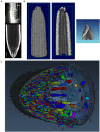
Imaging techniques to capture plant morphology. (A) Confocal sections of an Arabidopsis root. The upper panel shows a new lateral root primordium at an early stage of development (highlighted in yellow). At regular intervals new roots branch from the primary root. The lower panel shows the primary root meristem and the stem cell niche (highlighted in yellow) from which all cells derive. Scale bars: 100 μm. Images provided by AM (Heidelberg University). (B) Computational tomographic (CT) x-ray sections through a reconstructed maize ear (left and middle) and kernel (right). Images provided by CT (Donald Danforth Plant Science Center). (C) Laser ablation tomography (LAT) image of a nodal root from a mature, field-grown maize plant, with color segmentation showing definition of cortical cells, aerenchyma lacunae, and metaxylem vessels. Image by Jennifer T. Yang and provided by JPL (Pennsylvania State University).
FIGURE 5
FIGURE 5
The environmental basis of plant morphology. Root system architecture of Arabidopsis Col-0 plants expressing ProUBQ10:LUC2o growing in (A) control and (B) water-deficient conditions using the GLO-Roots system (Rellán-Álvarez et al., 2015). Images provided by RR-Á (Laboratorio Nacional de Genómica para la Biodiversidad, CINVESTAV) are a composite of a video originally published (Rellán-Álvarez et al., 2015).
FIGURE 6
FIGURE 6
Integration of tissue growth and reaction-diffusion models. (A) Vertex model of cellular layers (Prusinkiewicz and Lindenmayer, 1990). K, formula image, and formula image are the spring constant, current length, and rest length for wall a. KP is a constant and SA is the size of cell A. Δt is time step. Shown is a simulation of cell network growth. (B) Reaction diffusion model of the shoot apical meristem for WUSCHEL and CLAVATA interactions (Fujita et al., 2011). u = WUS, v = CLV, i = cell index, Φ is a sigmoid function. E, B, AS, Ad, C, D, um, Du, Dv are positive constants. Shown are the distributions of WUS and CLV levels within a dynamic cell network. Images provided by DB (Virginia Tech).
FIGURE 7
FIGURE 7
Modeling the interaction between plant morphology and fluid dynamics. (A) 3D immersed boundary simulations of flow past a flexible rectangular sheet (left) and disk with a cut from the center to edge (right). Both structures are attached to a flexible petiole, and the flow is from left to right. The contours show the magnitude of vorticity (the rotation in the air). The circular disk reconfigures into a cone shape, similar to many broad leaves. (B) Reconfiguration of tulip poplar leaves in 3 m/s (left) and 15 m/s flow (right). The leaves typically flutter at lower wind speeds and reconfigure into stable cones at high wind speeds. (C) A cluster of redbud leaves in wind moving from right to left. The wind speed is increased from 3 m/s (left) to 6 m/s (middle) and 12 m/s (right). Note that the entire cluster reconfigures into a cone shape. This is different from the case of tulip poplars and maples where each leaf individually reconfigures into a conic shape. Images provided by LM (University of North Carolina, Chapel Hill, NC, United States).
FIGURE 8
FIGURE 8
Milestones to accelerate the infusion of math into the plant sciences. Group photo of the authors from the National Institute for Mathematical and Biological Synthesis (NIMBioS) meeting on plant morphological models (University of Tennessee, Knoxville, September 2–4, 2015) that inspired this manuscript. Workshops such as these, bringing mathematicians and plant biologists together, will be necessary to create a new synthesis of plant morphology.

References

    1. Aiteanu F., Klein R. (2014). Hybrid tree reconstruction from inhomogeneous point clouds. Visual Comput. 30 763–771. 10.1007/s00371-014-0977-7 - DOI
    1. Baldazzi V., Bertin N., De Jong H., Génard M. (2012). Towards multiscale plant models: integrating cellular networks. Trends Plant Sci. 17 728–736. 10.1016/j.tplants.2012.06.012 - DOI - PubMed
    1. Band L. R., Fozard J. A., Godin C., Jensen O. E., Pridmore T., Bennett M. J., et al. (2012). Multiscale systems analysis of root growth and development: modeling beyond the network and cellular scales. Plant Cell 24 3892–3906. 10.1105/tpc.112.101550 - DOI - PMC - PubMed
    1. Band L. R., King J. R. (2012). Multiscale modelling of auxin transport in the plant-root elongation zone. J. Math. Biol. 65 743–785. 10.1007/s00285-011-0472-y - DOI - PubMed
    1. Bao Y., Aggarwal P., Robbins N. E., Sturrock C. J., Thompson M. C., Tan H. Q., et al. (2014). Plant roots use a patterning mechanism to position lateral root branches toward available water. Proc. Natl. Acad. Sci. U.S.A. 111 9319–9324. 10.1073/pnas.1400966111 - DOI - PMC - PubMed