. 2017 Jun 14:8:1037.
doi: 10.3389/fpls.2017.01037. eCollection 2017.

Transcription Factor Repertoire of Necrotrophic Fungal Phytopathogen Ascochyta rabiei: Predominance of MYB Transcription Factors As Potential Regulators of Secretome

Affiliations

Transcription Factor Repertoire of Necrotrophic Fungal Phytopathogen Ascochyta rabiei: Predominance of MYB Transcription Factors As Potential Regulators of Secretome

Sandhya Verma et al. Front Plant Sci. .

Abstract

Transcription factors (TFs) are the key players in gene expression and their study is highly significant for shedding light on the molecular mechanisms and evolutionary history of organisms. During host-pathogen interaction, extensive reprogramming of gene expression facilitated by TFs is likely to occur in both host and pathogen. To date, the knowledge about TF repertoire in filamentous fungi is in infancy. The necrotrophic fungus Ascochyta rabiei, that causes destructive Ascochyta blight (AB) disease of chickpea (Cicer arietinum), demands more comprehensive study for better understanding of Ascochyta-legume pathosystem. In the present study, we performed the genome-wide identification and analysis of TFs in A. rabiei. Taking advantage of A. rabiei genome sequence, we used a bioinformatic approach to predict the TF repertoire of A. rabiei. For identification and classification of A. rabiei TFs, we designed a comprehensive pipeline using a combination of BLAST and InterProScan software. A total of 381 A. rabiei TFs were predicted and divided into 32 fungal specific families of TFs. The gene structure, domain organization and phylogenetic analysis of abundant families of A. rabiei TFs were also carried out. Comparative study of A. rabiei TFs with that of other necrotrophic, biotrophic, hemibiotrophic, symbiotic, and saprotrophic fungi was performed. It suggested presence of both conserved as well as unique features among them. Moreover, cis-acting elements on promoter sequences of earlier predicted A. rabiei secretome were also identified. With the help of published A. rabiei transcriptome data, the differential expression of TF and secretory protein coding genes was analyzed. Furthermore, comprehensive expression analysis of few selected A. rabiei TFs using quantitative real-time polymerase chain reaction revealed variety of expression patterns during host colonization. These genes were expressed in at least one of the time points tested post infection. Overall, this study illustrates the first genome-wide identification and analysis of TF repertoire of A. rabiei. This work would provide the basis for further studies to dissect role of TFs in the molecular mechanisms during A. rabiei-chickpea interactions.

Keywords: Ascochyta rabiei; cis-acting elements; necrotrophic fungi; plant–pathogen interaction; secretome; transcription factors.


Figures

FIGURE 1
FIGURE 1
Overview of the computational pipeline used to identify the putative TFs of A. rabiei. Based on sequence similarity with characterized TFs from other fungi and the presence of conserved DNA-binding domain regions, proteins were assigned as TFs. A set of 381 putative TFs were predicted in the genome of A. rabiei.
FIGURE 2
FIGURE 2
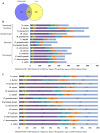
Distribution of A. rabiei putative TFs among different structural categories. (A) Out of 381 putative TFs predicted, 142 had significant matches with fungi specific 12 superfamilies and 76 had similarities with fungi specific 37 PFAM families (Shelest, 2008). Whereas 163 proteins showed matches in both SUPERFAMILY and PFAM family database. (B) The A. rabiei putative TFs were compared with TF repertoire of other necrotrophs, biotrophs, hemibiotrophs, symbiont, and saprotroph. The DNA binding domains considered for comparison were winged helix repressor DNA-binding, C2H2 zinc finger, [Zn(II)2Cys6], Myb, bZIP, and bHLH domains. The less represented DNA binding domains were categorized under others. (C) The relative abundance of each of the selected TF families across the fungal species is shown. The numbers inside the bars of graph are the absolute number of TFs in that family.
FIGURE 3
FIGURE 3
Gene structure analysis. The exon–intron organization is shown for (A) winged helix repressor DNA-binding, and (B) Myb family of A. rabiei putative TFs. Exons and introns are represented by blue rectangles and black lines, respectively. The numbers 0, 1, and 2 represent the intron phase.
FIGURE 4
FIGURE 4
Structural analysis of putative TFs. The protein domains of (A) Myb, (B) bHLH, and (C) bZIP family of A. rabiei putative TFs are shown. The domains are denoted by black outlined hollow rectangles, whereas coiled coil regions and low complexity regions are represented by green and pink rectangles, respectively.
FIGURE 5
FIGURE 5
Phylogenetic analysis of Myb family of putative TFs. (A) The evolutionary relationship of Myb family of A. rabiei putative TFs was compared to that of (B) C. heterostrophus, (C) P. tritici-repentis, and (D) P. nodorum based on Bayesian inference analysis. Each clade is highlighted by colored rectangular block. The Bayesian posterior probabilities are indicated at the nodes.
FIGURE 6
FIGURE 6
Phylogenetic analysis of bHLH family of putative TFs. (A) The evolutionary relationship of bHLH family of A. rabiei putative TFs was compared to that of (B) C. heterostrophus, (C) P. tritici-repentis, and (D) P. nodorum based on Bayesian inference analysis. Each clade is highlighted by colored rectangular block. The Bayesian posterior probabilities are indicated at the nodes.
FIGURE 7
FIGURE 7
Phylogenetic analysis of bZIP family of putative TFs. (A) The evolutionary relationship of bZIP family of A. rabiei putative TFs was compared to that of (B) C. heterostrophus, (C) P. tritici-repentis, and (D) P. nodorum based on Bayesian inference analysis. Each clade is highlighted by colored rectangular block. The Bayesian posterior probabilities are indicated at the nodes.
FIGURE 8
FIGURE 8
The most enriched cis-regulatory elements in the promoter sequences of secretory protein coding genes. Ten most abundant motifs in the promoter sequences of genes encoding A. rabiei secretory proteins are shown, as identified by RSAT suite for fungi (Regulatory Sequence Analysis).
FIGURE 9
FIGURE 9
Heat map representation of A. rabiei putative TFs. The expression of A. rabiei putative TF genes is shown during vegetative growth (in medium) and host invasion [12, 36, and 96 hours post inoculation (hpi)]. For this, A. rabiei transcriptome data was utilized (Fondevilla et al., 2015). Expression of putative TFs genes are denoted in the terms of FPKM values. Values with asterisk represent P-value < 0.005 at which differentially expressed genes (DEGs) were found.
FIGURE 10
FIGURE 10
Heat map representation of A. rabiei putative secretory protein coding genes. The expression pattern of genes encoding A. rabiei putative secretory proteins is shown during vegetative growth (in medium) and host invasion (12, 36, and 96 hpi). For this, A. rabiei transcriptome data was utilized (Fondevilla et al., 2015). Expression of putative secretory protein coding genes are denoted in the terms of FPKM values. Values with asterisk represent P-value < 0.05 at which DEGs were found.
FIGURE 11
FIGURE 11
Expression profiles of putative TF genes assayed by qRT-PCR during host colonization. Bar diagrams representing the expression pattern of seven putative TF genes are shown as the fold-change compared to the control. Expression was analyzed in A. rabiei-infected chickpea samples at 12, 24, 72, and 144 hpi. ArEF1a gene was used as an internal reference gene. Asterisks denote significant difference compared with the expression level at 0 hpi (p < 0.05).

Similar articles

Cited by

References

    1. Adebali O., Ortega D. R., Zhulin I. B. (2015). CDvist: a webserver for identification and visualization of conserved domains in protein sequences. Bioinformatics 31 1475–1477. 10.1093/bioinformatics/btu836 - DOI - PMC - PubMed
    1. Adryan B., Teichmann S. A. (2006). FlyTF: a systematic review of site-specific transcription factors in the fruit fly Drosophila melanogaster. Bioinformatics 22 1532–1533. - PubMed
    1. Arratia-Quijada J., Sánchez O., Scazzocchio C., Aguirre J. (2012). FlbD, a Myb transcription factor of Aspergillus nidulans, is uniquely involved in both asexual and sexual differentiation. Eukaryot. Cell 11 1132–1142. 10.1128/EC.00101-12 - DOI - PMC - PubMed
    1. Asano Y., Hagiwara D., Yamashino T., Mizuno T. (2007). Characterization of the bZip-type transcription factor NapA with reference to oxidative stress response in Aspergillus nidulans. Biosci. Biotechnol. Biochem. 71 1800–1803. - PubMed
    1. Bok J. W., Wiemann P., Garvey G. S., Lim F. Y., Haas B., Wortman J., et al. (2014). Illumina identification of RsrA, a conserved C2H2 transcription factor coordinating the NapA mediated oxidative stress signaling pathway in Aspergillus. BMC Genomics 15:1011 10.1186/1471-2164-15-1011 - DOI - PMC - PubMed