. 2017 Jun 12:4:84.
doi: 10.3389/fvets.2017.00084. eCollection 2017.

Transforming Growth Factor-β2 Downregulates Major Histocompatibility Complex (MHC) I and MHC II Surface Expression on Equine Bone Marrow-Derived Mesenchymal Stem Cells Without Altering Other Phenotypic Cell Surface Markers

Affiliations

Transforming Growth Factor-β2 Downregulates Major Histocompatibility Complex (MHC) I and MHC II Surface Expression on Equine Bone Marrow-Derived Mesenchymal Stem Cells Without Altering Other Phenotypic Cell Surface Markers

Alix K Berglund et al. Front Vet Sci. .

Abstract

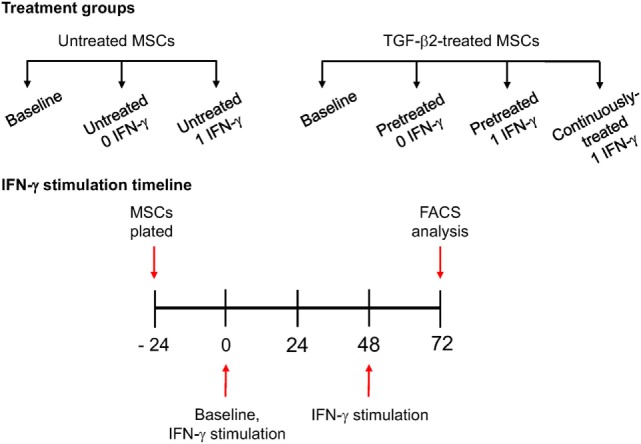
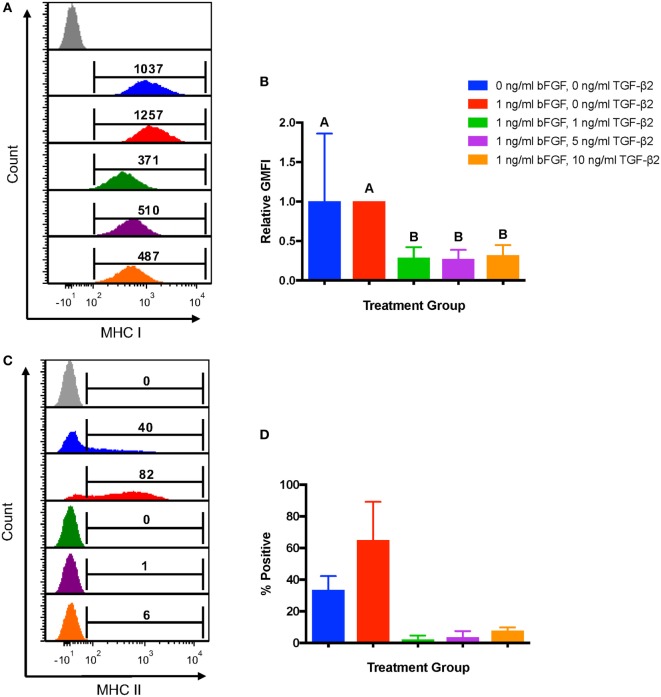
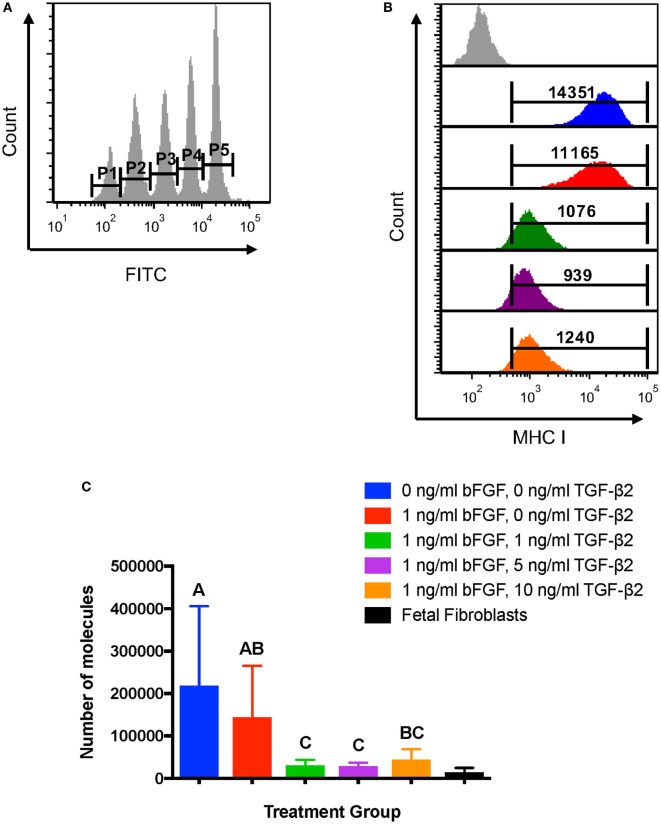
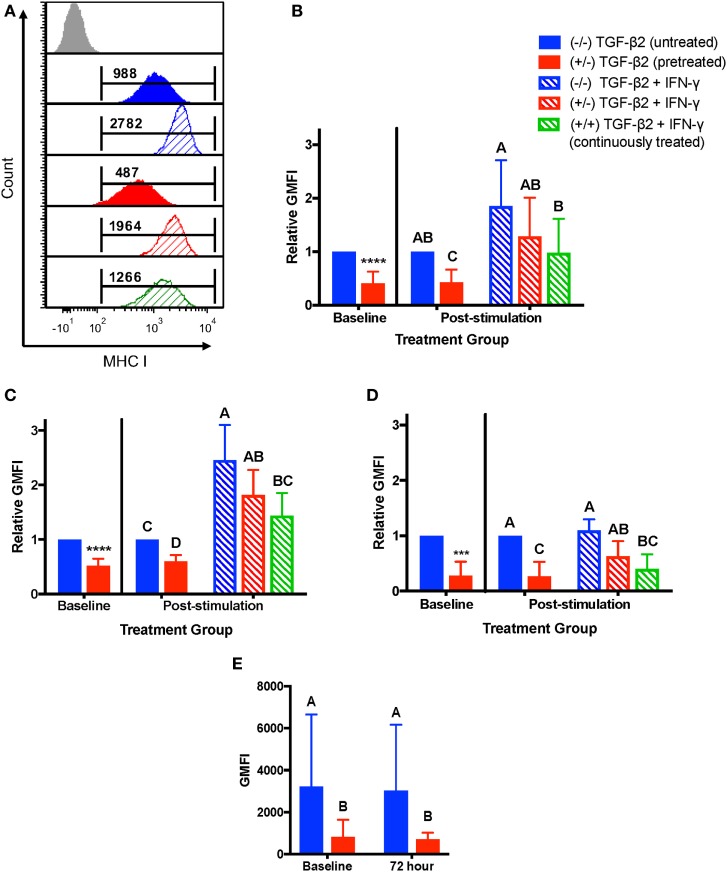
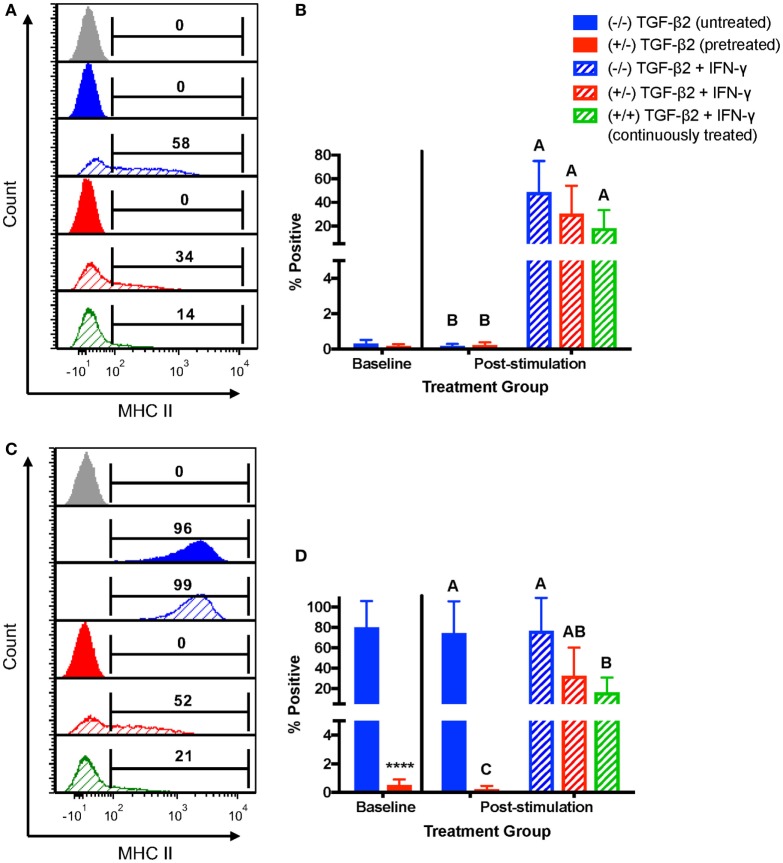
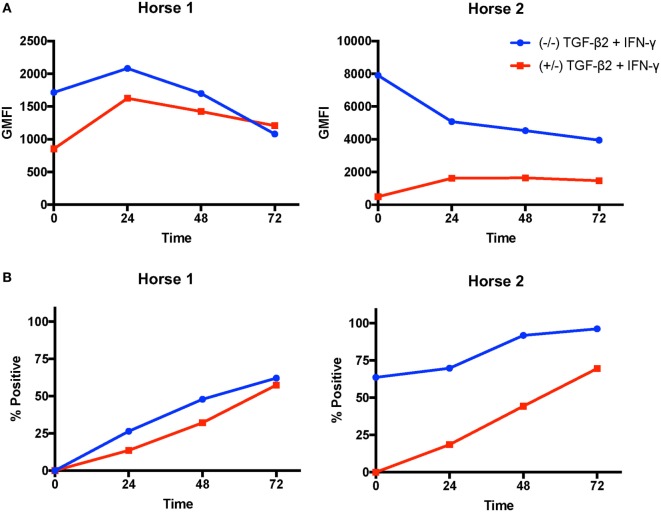
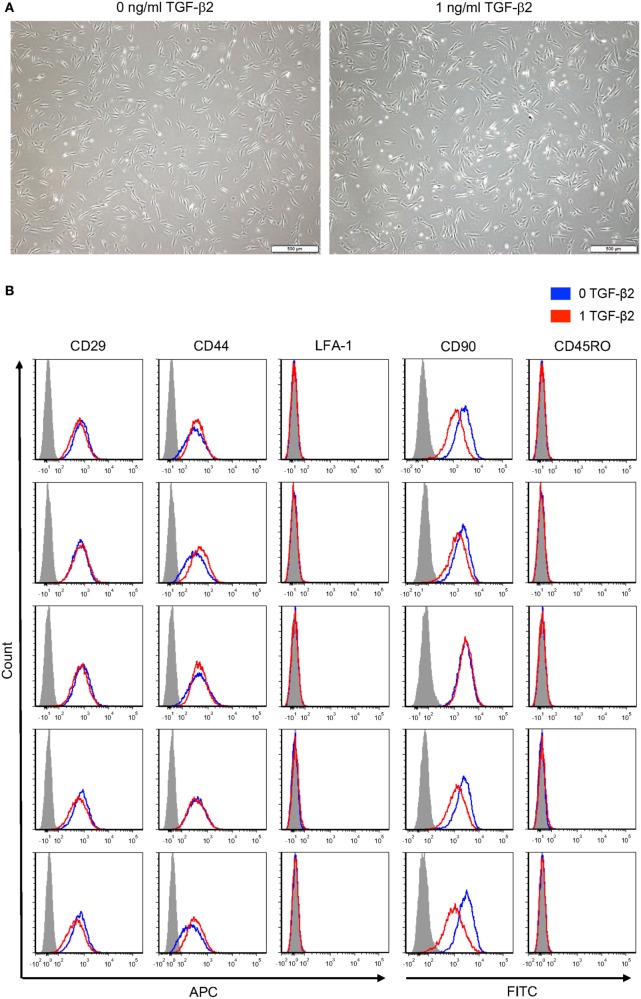
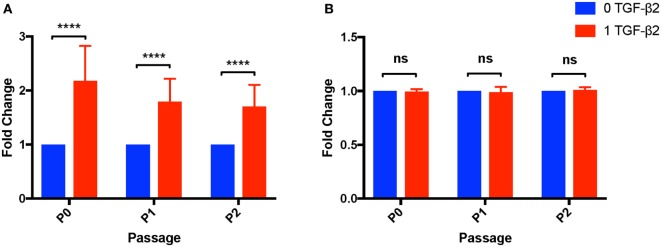
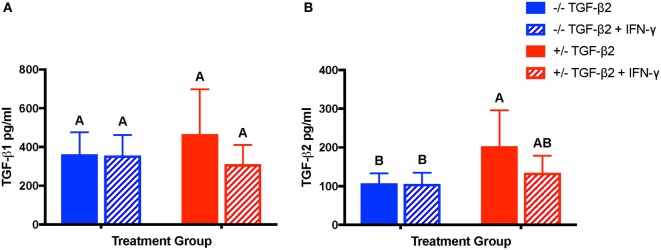
Allogeneic mesenchymal stem cells (MSCs) are a promising cell source for treating musculoskeletal injuries in horses. Effective and safe allogeneic therapy may be hindered, however, by recipient immune recognition and rejection of major histocompatibility complex (MHC)-mismatched MSCs. Development of strategies to prevent immune rejection of MHC-mismatched MSCs in vivo is necessary to enhance cell survival and potentially increase the efficacy and safety of allogeneic MSC therapy. The purposes of this study were to evaluate if transforming growth factor-β2 (TGF-β2) downregulated MHC expression on equine MSCs and to determine if TGF-β2 treatment altered the phenotype of MSCs. Equine bone marrow-derived MSCs from 12 horses were treated with 1, 5, or 10 ng/ml TGF-β2 from initial isolation until MHC expression analysis. TGF-β2-treated MSCs had reduced MHC I and MHC II surface expression compared to untreated controls. TGF-β2 treatment also partially blocked IFN-γ-induced upregulation of MHC I and MHC II. Constitutive and IFN-γ-induced MHC I and MHC II expression on equine MSCs was dynamic and highly variable, and the effect of TGF-β2 was significantly dependent on the donor animal and baseline MHC expression. TGF-β2 treatment did not appear to change morphology, surface marker expression, MSC viability, or secretion of TGF-β1, but did significantly increase the number of cells obtained from culture. These results indicate that TGF-β2 treatment has promise for regulating MHC expression on MSCs to facilitate allogeneic therapy, but further work is needed to maintain MHC stability when exposed to an inflammatory stimulus.

Keywords: IFN-γ; allogeneic; equine; major histocompatibility complex; mesenchymal stem cell; transforming growth factor-β2.


Figures

Figure 1
Figure 1
IFN-γ stimulation methods. P3 untreated [−/− transforming growth factor-β2 (TGF-β2)], pretreated (+/− TGF-β2), and continuously treated (+/+ TGF-β2) mesenchymal stem cells (MSCs) were stimulated with 1 ng/ml equine IFN-γ over a 72-h period. Untreated and pretreated MSCs not stimulated with IFN-γ were used as controls. Major histocompatibility complex (MHC) I and MHC II expression was measured via FACS following stimulation. Baseline MHC expression was obtained by freezing cells from each treatment group just prior to IFN-γ stimulation.
Figure 2
Figure 2
Major histocompatibility complex (MHC) I and MHC II surface expression on untreated and transforming growth factor-β2 (TGF-β2)-treated mesenchymal stem cells (MSCs). Equine MSCs were cultured in media containing 0 ng/ml basic fibroblastic growth factor (bFGF) and 0 ng/ml TGF-β2 (negative control group), 1 ng/ml bFGF and 0 ng/ml TGF-β2 (traditional control group) or 1 ng/ml bFGF and 1, 5, or 10 ng/ml TGF-β2 from initial isolation to P2. MHC I and MHC II expression was measured via FACS analysis. Superscript letters indicate significant differences between groups. (A) Representative histograms from one horse of MHC I expression for all treatment groups. Numbers above gates represent population geometric mean fluorescence intensity (GMFI) compared to MHC I negative control (gray). (B) MHC I expression shown as the average fold change in GMFI relative to the traditional control group. Data shown are mean ± SD of n = 8, p < 0.0001. (C) Representative histograms from one horse of MHC II expression for all treatment groups. Numbers above gates represent the percent of the parent population positive for MHC II compared to the negative control. (D) MHC II expression shown as the average percent of MSCs positive for MHC II. Data shown are mean ± SD of n = 2.
Figure 3
Figure 3
Quantification of major histocompatibility complex (MHC) I surface expression on untreated and transforming growth factor-β2-treated mesenchymal stem cells (MSCs). The QIFIKIT® assay was used to quantify the average number of MHC I surface molecules on passage 2 MSCs based on the population geometric mean fluorescence intensity (GMFI). Superscript letters indicate significant differences between groups. (A) Calibration bead populations were gated to obtain GMFI for linear regression analysis. (B) Representative histograms from one horse showing MHC I expression and population GMFI for all treatment groups. (C) Average number of MHC I molecules as determined by linear regression analysis for all treatment groups. Data shown are mean ± SD of n = 7, p = 0.0003. Fetal fibroblasts are included as a MHC Ilow reference cell.
Figure 4
Figure 4
Major histocompatibility complex (MHC) I surface expression on untreated and transforming growth factor-β2 (TGF-β2)-treated mesenchymal stem cells (MSCs) following IFN-γ stimulation. P3 untreated (−/−), TGF-β2-pretreated (+/−), and TGF-β2 continuously treated (+/+) MSCs were stimulated with 1 ng/ml IFN-γ for 72 h before MHC I expression analysis via FACS. Untreated and pretreated MSCs not stimulated with IFN-γ were used as controls. Superscript letters indicate significant differences between groups. (A) Representative histograms from one horse of MHC I expression for all treatment groups. Numbers above gates represent population geometric mean fluorescence intensity (GMFI) compared to MHC I negative control (gray). (B) MHC I expression shown as the average fold change in GMFI relative to the control group (−/− TGF-β2 untreated, solid blue bar). Data shown are mean ± SD of n = 9, *p < 0.0001 by t-test, p < 0.0001 by analysis of covariance (ANCOVA). (C) MHC I expression for MHC I low horses shown as the average fold change in GMFI relative to the control group (−/− TGF-β2 untreated, solid blue bar). Data shown are mean ± SD of n = 5, *p < 0.0001 by t-test, p < 0.0001 by ANCOVA. (D) MHC I expression for MHC I high horses shown as the average fold change in GMFI relative to the control group (−/− TGF-β2 untreated, solid blue bar). Data shown are mean ± SD of n = 4, *p = 0.0049 by t-test, p < 0.0001 by ANCOVA. (E) MHC I GMFI of baseline and unstimulated MSCs treatment groups. Data shown are mean ± SD of n = 9, p < 0.0001.
Figure 5
Figure 5
Major histocompatibility complex (MHC) II surface expression on untreated and transforming growth factor-β2 (TGF-β2)-treated mesenchymal stem cells (MSCs) following IFN-γ stimulation. P3 untreated (−/−), TGF-β2-pretreated (+/−), and TGF-β2 continuously treated (+/+) MSCs were stimulated with 1 ng/ml IFN-γ for 72 h before MHC II expression analysis via FACS. Untreated and pretreated MSCs not stimulated with IFN-γ were used as controls. Superscript letters indicate significant differences between groups. (A) Representative histograms from one MHC II baseline negative horse showing MHC II expression for all treatment groups. Numbers above gates represent the percent of the parent population positive for MHC II compared to the negative control (gray). (B) MHC II expression shown as the average percent of the parent population positive for MHC II relative to the control group (−/− TGF-β2 untreated, solid blue bar). Data shown are mean ± SD of n = 6, p < 0.0001. (C) Representative histograms from one MHC II baseline positive horse showing MHC II expression for all treatment groups. Numbers above gates represent the percent of the parent population positive for MHC II compared to the negative control (gray). (D) MHC II expression shown as the average percent of the parent population positive for MHC II relative to the control group (−/− TGF-β2 untreated, solid blue bar). Data shown are mean ± SD of n = 3, *p < 0.0001 by t-test, p < 0.0007 by analysis of covariance.
Figure 6
Figure 6
Major histocompatibility complex (MHC) I and MHC II surface expression kinetics on untreated and transforming growth factor-β2 (TGF-β2)-pretreated mesenchymal stem cells (MSCs) following IFN-γ stimulation. MHC I and MHC II expression were measured on untreated and TGF-β2-pretreated MSCs from two horses via FACS every 24 h for 72 h following IFN-γ stimulation. (A) MHC I expression shown as the geometric mean fluorescence intensity (GMFI) of MSCs in each treatment group over time. (B) MHC II expression shown as the percent of the parent MSC population positive for MHC II in each treatment group over time.
Figure 7
Figure 7
Phenotype of untreated and transforming growth factor-β2 (TGF-β2)-treated mesenchymal stem cells (MSCs). (A) P2 MSCs were imaged via phase microscopy, bar = 500 µM. (B) P3 untreated and TGF-β2-treated MSCs were stained for positive MSC surface markers CD29, CD44, and CD90 and negative surface markers LFA-1 and CD45RO. Expression is shown as FACS histograms from five horses.
Figure 8
Figure 8
Cell yield and viability of untreated and transforming growth factor-β2 (TGF-β2)-treated mesenchymal stem cells (MSCs). Cell yield and viability were determined at each passage using a Cellometer® Auto 2000 and ViaStain™ AOPI Staining Solution. (A) Cell yield is displayed as the average fold change in cell counts relative to untreated MSCs. Data shown are mean ± SD of n = 8, ****p < 0.0001 by t-test (B) Viability is displayed as the average fold change in percent viability of MSCs relative to untreated MSCs. Data shown are mean ± SD of n = 8.
Figure 9
Figure 9
Production of TGF-β1 and transforming growth factor-β2 (TGF-β2) by untreated and TGF-β2-treated mesenchymal stem cells (MSCs). TGF-β1 and TGF-β2 concentrations were measured in the supernatant of untreated (−/− TGF-β2), untreated and IFN-γ stimulated (−/− TGF-β2 + IFN-γ), TGF-β2-pretreated (+/− TGF-β2), and TGF-β2-pretreated and IFN-γ stimulated (+/− TGF-β2 + IFN-γ) MSCs using a TGF-β multiplex assay. Superscript letters indicate significant differences between groups. (A) TGF-β1 is displayed as the mean concentration ± SD of n = 7. (B) TGF-β2 is displayed as the mean concentration ± SD of n = 7, p = 0.0045 by analysis of covariance.

References

    1. Godwin EE, Young NJ, Dudhia J, Beamish IC, Smith RKW. Implantation of bone marrow-derived mesenchymal stem cells demonstrates improved outcome in horses with overstrain injury of the superficial digital flexor tendon. Equine Vet J (2012) 44:25–32.10.1111/j.2042-3306.2011.00363.x - DOI - PubMed
    1. da Silva Meirelles L, Fontes AM, Covas DT, Caplan AI. Mechanisms involved in the therapeutic properties of mesenchymal stem cells. Cytokine Growth Factor Rev (2009) 20:419–27.10.1016/j.cytogfr.2009.10.002 - DOI - PubMed
    1. Murphy KC, Fang SY, Leach JK. Human mesenchymal stem cell spheroids in fibrin hydrogels exhibit improved cell survival and potential for bone healing. Cell Tissue Res (2014) 357:91–9.10.1007/s00441-014-1830-z - DOI - PMC - PubMed
    1. Caplan AI, Sorrell JM. The MSC curtain that stops the immune system. Immunol Lett (2015) 168:136–9.10.1016/j.imlet.2015.06.005 - DOI - PubMed
    1. Ryan JM, Barry FP, Murphy JM, Mahon BP. Mesenchymal stem cells avoid allogeneic rejection. J Inflamm (Lond) (2005) 2:8.10.1186/1476-9255-2-8 - DOI - PMC - PubMed