. 2017 Aug;6(4):e00491.
doi: 10.1002/mbo3.491. Epub 2017 Jun 28.

Relative variations of gut microbiota in disordered cholesterol metabolism caused by high-cholesterol diet and host genetics

Affiliations

Relative variations of gut microbiota in disordered cholesterol metabolism caused by high-cholesterol diet and host genetics

Tao Bo et al. Microbiologyopen. 2017 Aug.

Abstract

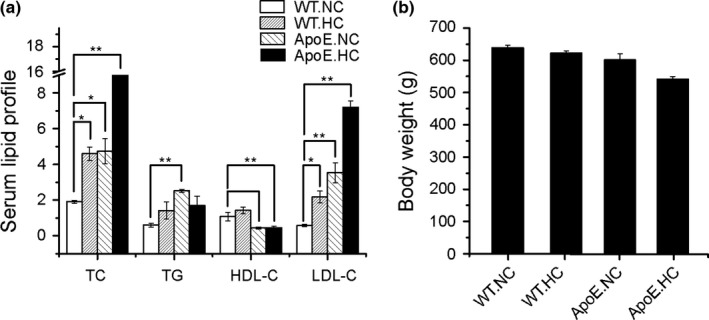
Recent studies performed provide mechanistic insight into effects of the microbiota on cholesterol metabolism, but less focus was given to how cholesterol impacts the gut microbiota. In this study, ApoE-/- Sprague Dawley (SD) rats and their wild-type counterparts (n = 12) were, respectively, allocated for two dietary condition groups (normal chow and high-cholesterol diet). Total 16S rDNA of fecal samples were extracted and sequenced by high-throughput sequencing to determine differences in microbiome composition. Data were collected and performed diversity analysis and phylogenetic analysis. The influence of cholesterol on gut microbiota was discussed by using cholesterol dietary treatment as exogenous cholesterol disorder factor and genetic modification as endogenous metabolic disorder factor. Relative microbial variations were compared to illustrate the causality and correlation of cholesterol and gut microbiota. It turned out comparing to genetically modified rats, exogenous cholesterol intake may play more effective role in changing gut microbiota profile, although the serum cholesterol level of genetically modified rats was even higher. Relative abundance of some representative species showed that the discrepancies due to dietary variation were more obvious, whereas some low abundance species changed because of genetic disorders. Our results partially demonstrated that gut microbiota are relatively more sensitive to dietary variation. Nevertheless, considering the important effect of bacteria in cholesterol metabolism, the influence to gut flora by "genetically caused cholesterol disorder" cannot be overlooked. Manipulation of gut microbiota might be an effective target for preventing cholesterol-related metabolic disorders.

Keywords: gut microbiota; high-cholesterol diet; metabolism disorder.


Figures

Figure 1
Figure 1
Phenotypes of different groups with different genotypes and dietary conditions. (a) The serum TC, TG, LDL‐C, HDL‐C levels of different groups; (b) body weight of different groups. The differences among the four groups were compared using nonparametric tests, *< .05 versus WT.NC group. **< .01 versus WT.NC group. Error bars are calculated as a standard error (SEM)
Figure 2
Figure 2
Alpha diversity analysis of different groups. (a) Rarefaction curve is generated by setting the number of sequence as x‐axis, and the number of observed species as y‐axis. The curve reflected the relationship between the quantity of observed species and sequences. The “plateaued” shape of the curve indicated that enough samples/sequences were obtained to cover the majority of species. (b) Species accumulation curve is generated by setting sample number as x‐axis, and the number of observed species as y‐axis. Species accumulation curves described the number of species along with the increase in sample size. (c) Rank abundance curve is generated by setting relative abundance of OTU as y‐axis, and OTU number as x‐axis. The spanning of the curve in x‐axis reflects the richness of the species does the sample has, while the smooth reflects the evenness of the species. (d) Each circle in the Venn diagram represented one group noted by the name of same color. The numbers located in the overlapping area represented the number of OTUs share with respective groups. The numbers located in the individual area represented the number of OTUs peculiar to the representative group
Figure 3
Figure 3
Beta diversity analysis of different groups. (a) Shannon index box plot; (b) PCA; (c) and (d) unweighted unifrac PCoA and weighted unifrac PCoA. PC1 and PC2 in x‐ and y‐axis represented two principle discrepancy components between groups, and the percentage in bracket means contribution value to the discrepancies by the component. Dots represent samples. Samples in same group share same color
Figure 4
Figure 4
UPGMA analysis of different groups. (a) UPGMA clustering tree based on unweighted unifrac distance. (b) UPGMA clustering tree based on weighted unifrac distance. Left side of the diagram is the structure of clustering tree. Right side is the relative abundance of different phylum. The difference between unweighted unifrac and weighted unifrac is that the former only including the factor of species classification and evolutionary relationship, while the latter bringing the species abundance factor into calculation
Figure 5
Figure 5
The heat map of relative abundance of different phylum. Samples information is transverse listed, and species annotations are longitudinal shown. The left clustering tree is species‐related clustering tree, and the upper tree is sample‐related clustering tree. The heat map was performed by discrepancies of species‐relative abundance between samples, with colors gradually changed from deep red to deep blue, in accordance with high relative abundance to low. The data were “Z” value, which were calculated based on standardized relative abundance
Figure 6
Figure 6
Relative abundance analysis of some metabolic representative species. (a) Relative abundance of Firmucutes and Bacteroidetes of different groups; (b) F/B ratio of different groups; (c) relative abundance of the phylum of Euryarchaeota, Spirochaetes, Fibrobacteres of different groups; (d) relative abundance of the genus of Prevotella, Oscillospira, Ruminococcus, Bacteriodes of different groups; (e) relative abundance of some low abundance species with apparent differences derived from dietary conditions; (f) relative abundance of some low abundance species with apparent differences in ApoE groups. The differences among groups were compared using nonparametric tests. *< .05 versus respective species in WT.NC group; #< .05 versus respective species in WT.HC group; △< .05 versus respective species in ApoE.NC group. Error bars are calculated as a standard error (SEM)

References

    1. Antal, G. M. , Lukehart, S. A. , & Meheus, A. Z. (2002). The endemic treponematoses. Microbes and Infection, 4, 83–94. - PubMed
    1. Barns, S. M. , Cain, E. C. , Sommerville, L. , & Kuske, C. R. (2007). Acidobacteria phylum sequences in uranium‐contaminated subsurface sediments greatly expand the known diversity within the phylum. Applied and Environment Microbiology, 73, 3113–3116. - PMC - PubMed
    1. Cani, P. D. , Amar, J. , Iglesias, M. A. , Poggi, M. , Knauf, C. , Bastelica, D. , … Burcelin, R. (2007). Metabolic endotoxemia initiates obesity and insulin resistance. Diabetes, 56, 1761–1772. - PubMed
    1. Claus, S. P. , Ellero, S. L. , Berger, B. , Krause, L. , Bruttin, A. , Molina, J. , … Nicholson, J. K. (2011). Colonization‐induced host‐gut microbial metabolic interaction.MBio, 2, e00271–10. - PMC - PubMed
    1. Conway de Macario, E. , & Macario, A. J . (2009). Methanogenic archaea in health and disease: A novel paradigm of microbial pathogenesis. International Journal of Medical Microbiology 299, 99–108. - PubMed

Publication types

LinkOut - more resources