

Chlorogenic Acid Ameliorates Experimental Colitis by Promoting Growth of Akkermansia in Mice
- PMID: 28661454
- PMCID: PMC5537792
- DOI: 10.3390/nu9070677
Chlorogenic Acid Ameliorates Experimental Colitis by Promoting Growth of Akkermansia in Mice
Abstract
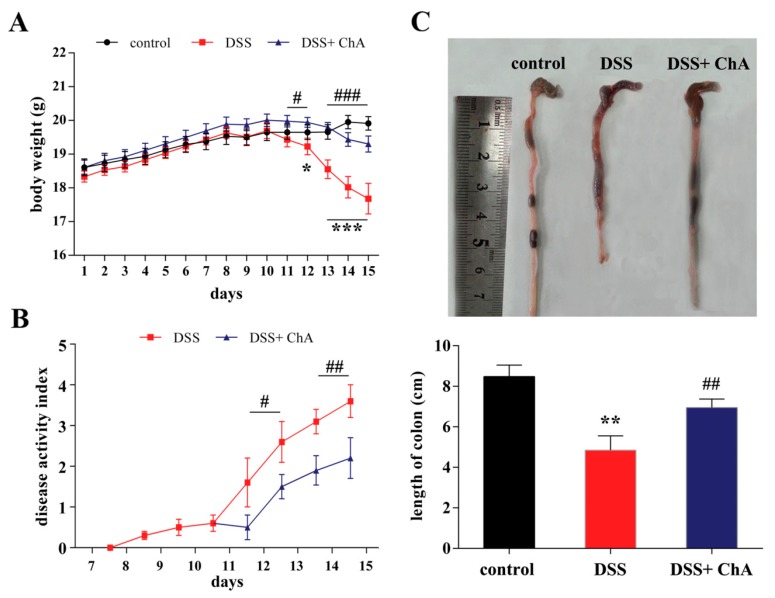
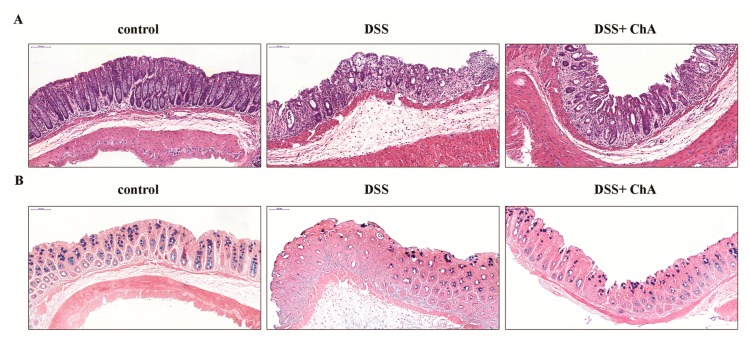
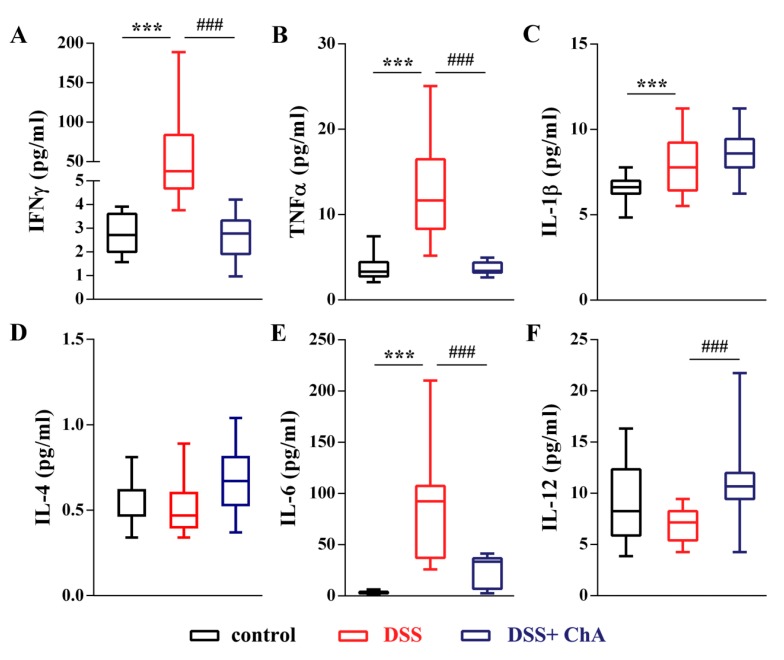
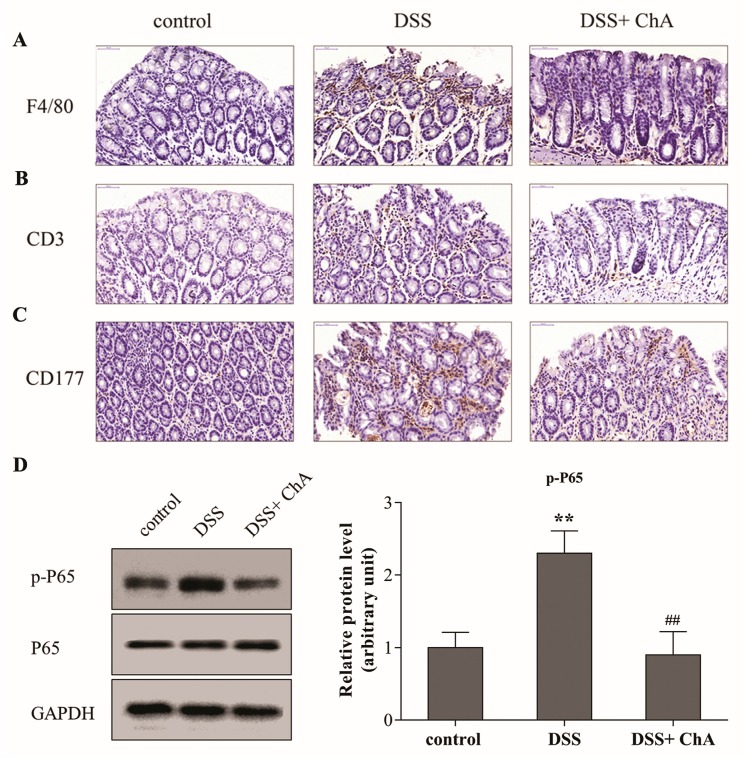
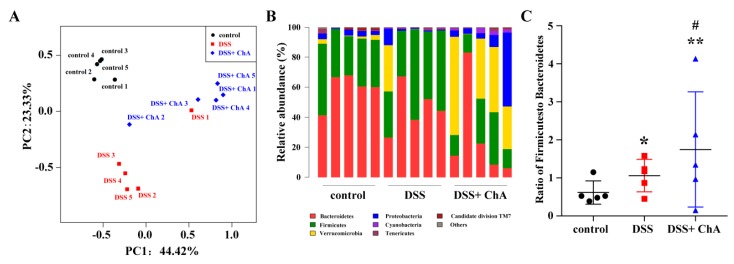
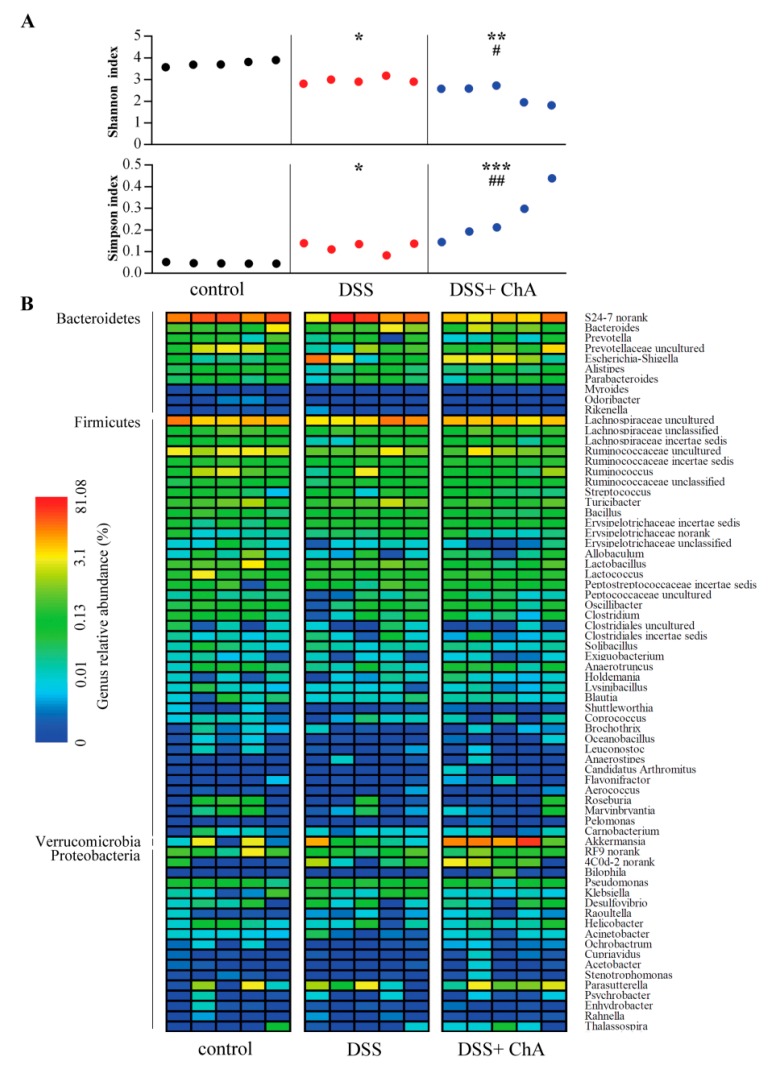
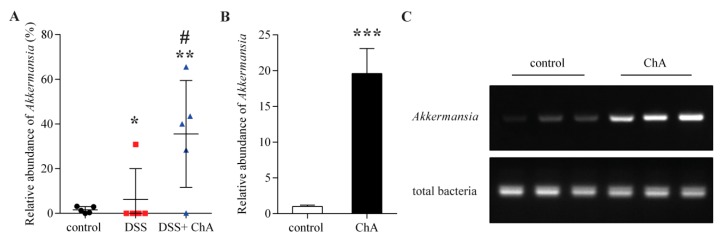
Chlorogenic acid (ChA)-one of the most abundant polyphenol compounds in the human diet-exerts anti-inflammatory activities. The aim of this study was to investigate the effect of ChA on gut microbiota in ulcerative colitis (UC). Colitis was induced by 2.5% dextran sulfate sodium (DSS) in C57BL/6 mice, which were on a control diet or diet with ChA (1 mM). The histopathological changes and inflammation were evaluated. Fecal samples were analyzed by 16S rRNA gene sequencing. ChA attenuated several effects of DSS-induced colitis, including weight loss, increased disease activity index, and improved mucosal damage. Moreover, ChA could significantly suppress the secretion of IFNγ, TNFα, and IL-6 and the colonic infiltration of F4/80⁺ macrophages, CD3⁺ T cells, and CD177⁺ neutrophils via inhibition of the active NF-κB signaling pathway. In addition, ChA decreased the proportion of Firmicutes and Bacteroidetes. ChA also enhanced a reduction in fecal microbiota diversity in DSS treated mice. Interestingly, ChA treatment markedly increased the proportion of the mucin-degrading bacterium Akkermansia in colitis mice. ChA acted as the intestine-modifying gut microbial community structure, resulting in a lower intestinal and systemic inflammation and also improving the course of the DSS-induced colitis, which is associated with a proportional increase in Akkermansia.
Keywords: Akkermansia; chlorogenic acid; colitis; gut microbiota; inflammation.
Conflict of interest statement
The authors have declared no conflict of interest.
Figures
Similar articles
-
Caffeic acid ameliorates colitis in association with increased Akkermansia population in the gut microbiota of mice.Oncotarget. 2016 May 31;7(22):31790-9. doi: 10.18632/oncotarget.9306. Oncotarget. 2016. PMID: 27177331 Free PMC article.
-
Anti-inflammatory effect of chlorogenic acid on the IL-8 production in Caco-2 cells and the dextran sulphate sodium-induced colitis symptoms in C57BL/6 mice.Food Chem. 2015 Feb 1;168:167-75. doi: 10.1016/j.foodchem.2014.06.100. Epub 2014 Jul 11. Food Chem. 2015. PMID: 25172696
-
Chlorogenic acid ameliorates experimental colitis in mice by suppressing signaling pathways involved in inflammatory response and apoptosis.Food Chem Toxicol. 2018 Nov;121:140-150. doi: 10.1016/j.fct.2018.08.061. Epub 2018 Aug 27. Food Chem Toxicol. 2018. PMID: 30165128
-
Grape seed proanthocyanidin extract ameliorates dextran sulfate sodium-induced colitis through intestinal barrier improvement, oxidative stress reduction, and inflammatory cytokines and gut microbiota modulation.Food Funct. 2020 Sep 23;11(9):7817-7829. doi: 10.1039/d0fo01418d. Food Funct. 2020. PMID: 32808642
-
EPA and DHA differentially coordinate the crosstalk between host and gut microbiota and block DSS-induced colitis in mice by a reinforced colonic mucus barrier.Food Funct. 2022 Apr 20;13(8):4399-4420. doi: 10.1039/d1fo03815j. Food Funct. 2022. PMID: 35297435
Cited by
-
Akkermansia muciniphila strain ATCC BAA-835 does not promote short-term intestinal inflammation in gnotobiotic interleukin-10-deficient mice.Gut Microbes. 2019;10(2):188-203. doi: 10.1080/19490976.2018.1511663. Epub 2018 Sep 25. Gut Microbes. 2019. PMID: 30252588 Free PMC article.
-
Chlorogenic acid and its role in biological functions: an up to date.EXCLI J. 2019 Jun 6;18:310-316. doi: 10.17179/excli2019-1404. eCollection 2019. EXCLI J. 2019. PMID: 31338004 Free PMC article. No abstract available.
-
Effects of ginsenoside compound K on colitis-associated colorectal cancer and gut microbiota profiles in mice.Ann Transl Med. 2022 Apr;10(7):408. doi: 10.21037/atm-22-793. Ann Transl Med. 2022. PMID: 35530961 Free PMC article.
-
The protective effect of Buzhong Yiqi decoction on ischemic stroke mice and the mechanism of gut microbiota.Front Neurosci. 2022 Dec 15;16:956620. doi: 10.3389/fnins.2022.956620. eCollection 2022. Front Neurosci. 2022. PMID: 36590298 Free PMC article.
-
Gut microbiota and intestinal immunity interaction in ulcerative colitis and its application in treatment.Front Cell Infect Microbiol. 2025 Apr 9;15:1565082. doi: 10.3389/fcimb.2025.1565082. eCollection 2025. Front Cell Infect Microbiol. 2025. PMID: 40292216 Free PMC article. Review.
References
-
- Fuentes S., Rossen N.G., van der Spek M.J., Hartman J.H., Huuskonen L., Korpela K., Salojarvi J., Aalvink S., de Vos W.M., D’Haens G.R., et al. Microbial shifts and signatures of long-term remission in ulcerative colitis after faecal microbiota transplantation. ISME J. 2017 doi: 10.1038/ismej.2017.44. - DOI - PMC - PubMed
MeSH terms
Substances
LinkOut - more resources
Full Text Sources
Other Literature Sources
