. 2017 Jun 29;8(6):e2902.
doi: 10.1038/cddis.2017.287.

Osteoblastic heparan sulfate glycosaminoglycans control bone remodeling by regulating Wnt signaling and the crosstalk between bone surface and marrow cells

Affiliations

Osteoblastic heparan sulfate glycosaminoglycans control bone remodeling by regulating Wnt signaling and the crosstalk between bone surface and marrow cells

Rafik Mansouri et al. Cell Death Dis. .

Erratum in

Abstract

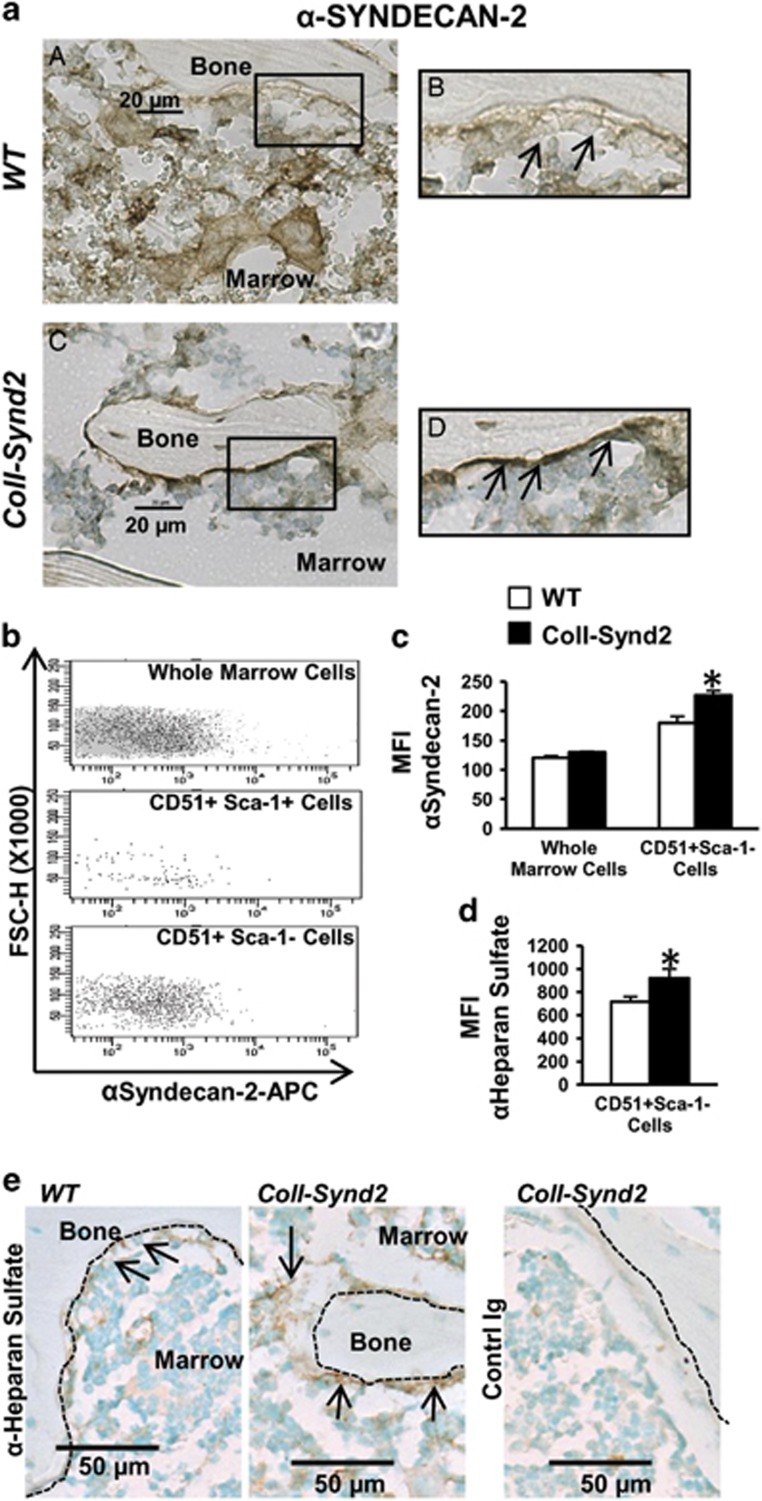
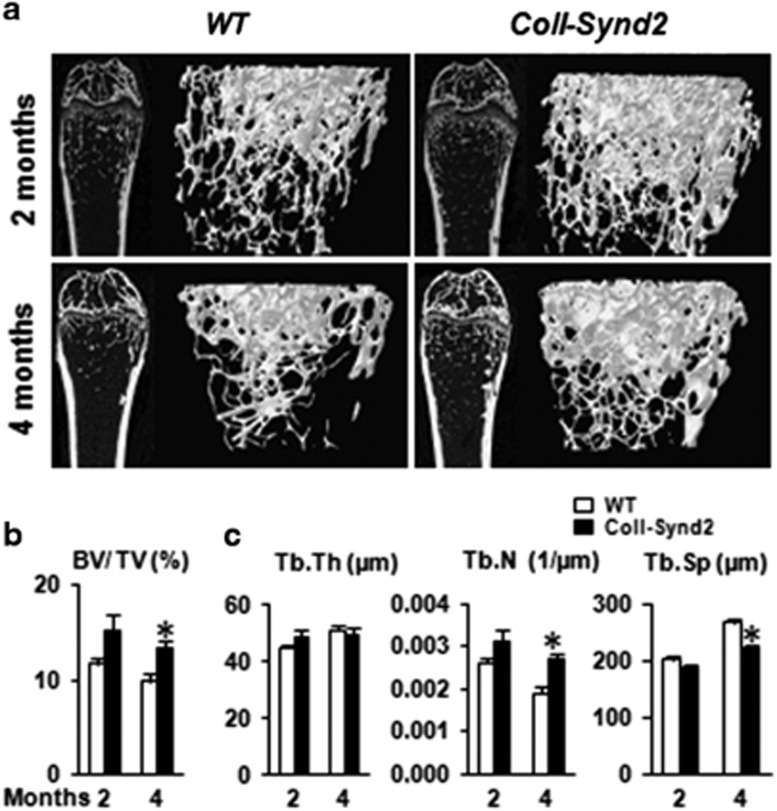
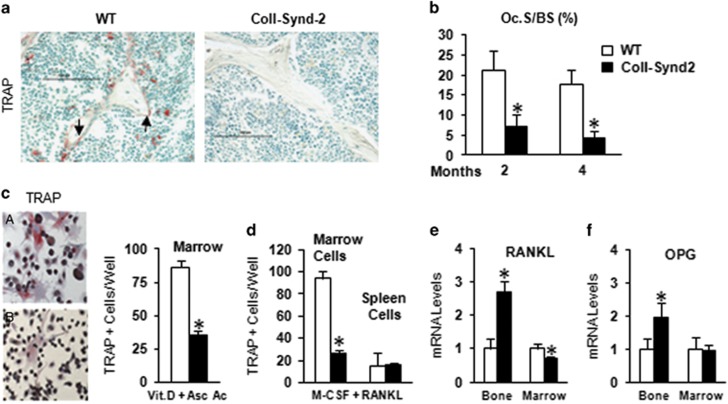
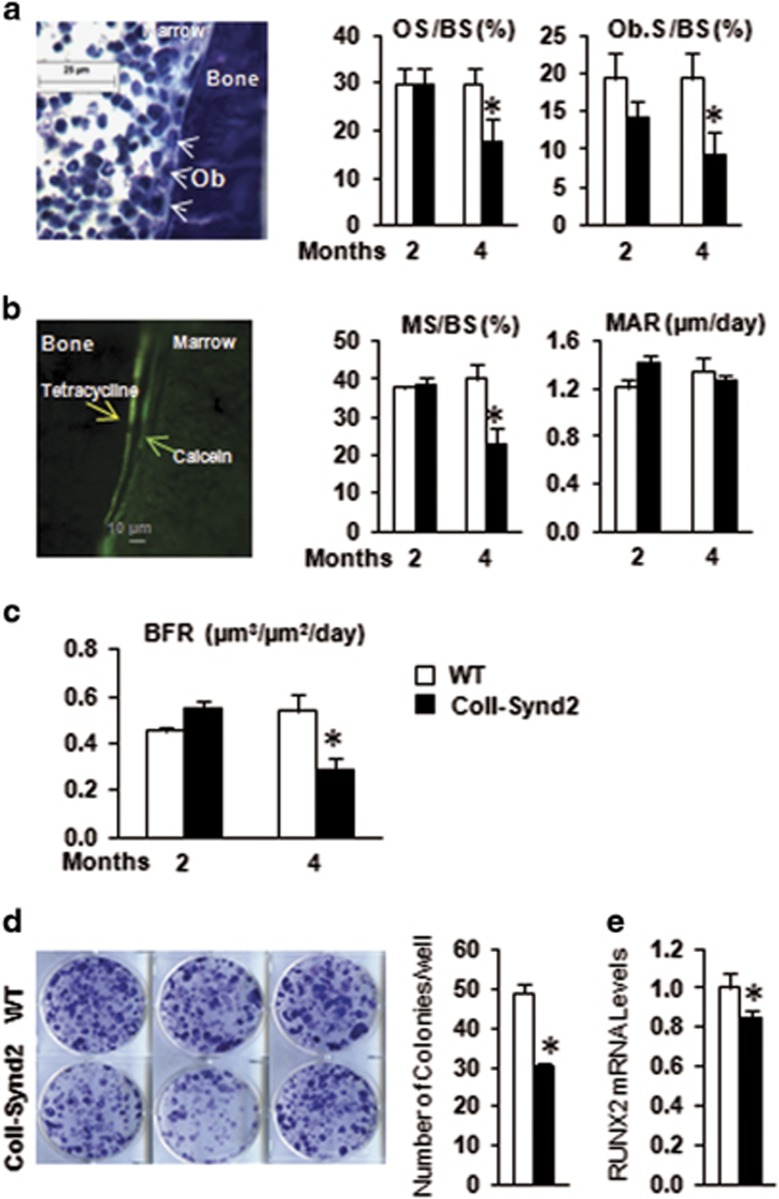
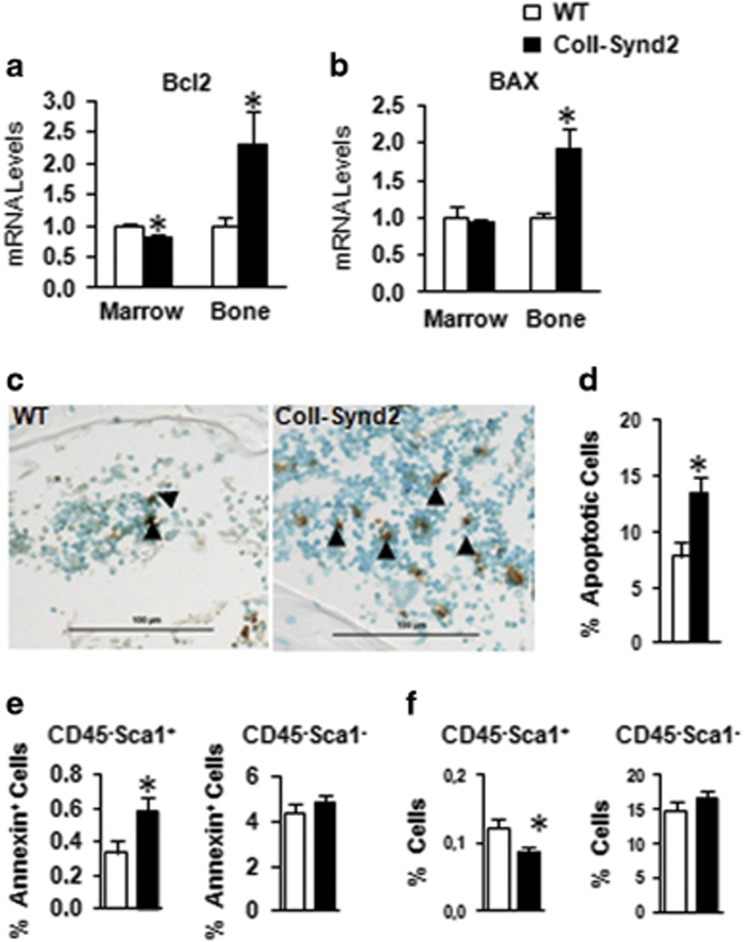
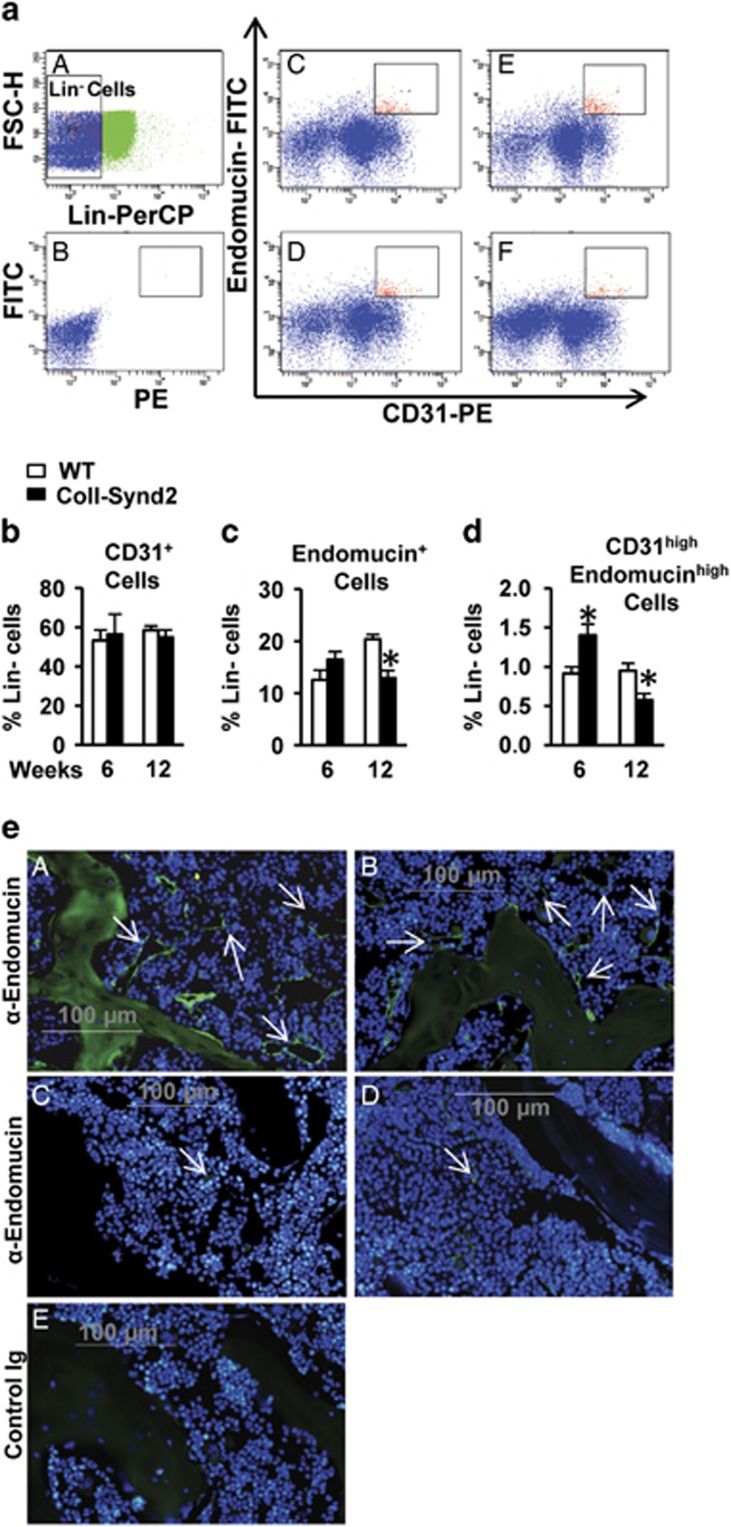
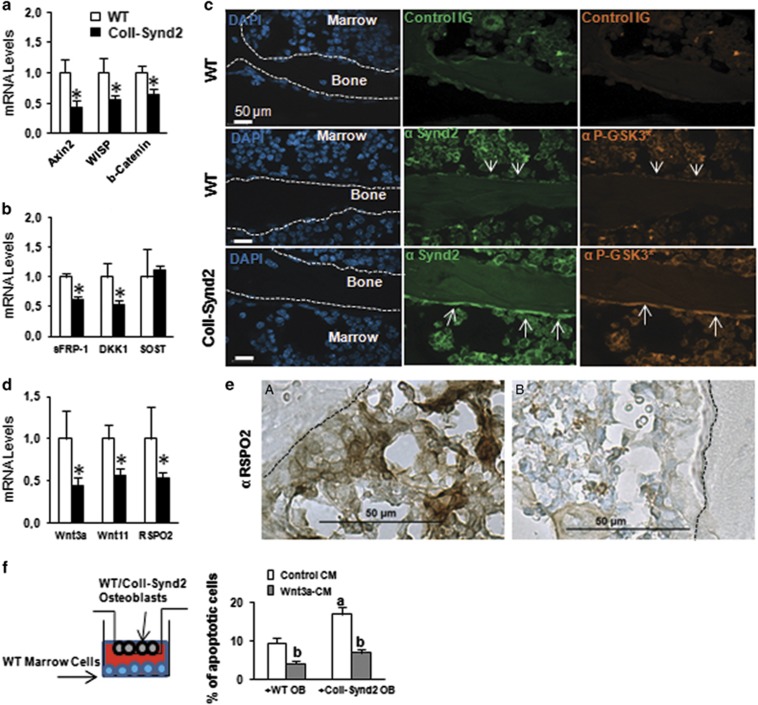
Stimulating bone formation is an important challenge for bone anabolism in osteoporotic patients or to repair bone defects. The osteogenic properties of matrix glycosaminoglycans (GAGs) have been explored; however, the functions of GAGs at the surface of bone-forming cells are less documented. Syndecan-2 is a membrane heparan sulfate proteoglycan that is associated with osteoblastic differentiation. We used a transgenic mouse model with high syndecan-2 expression in osteoblasts to enrich the bone surface with cellular GAGs. Bone mass was increased in these transgenic mice. Syndecan-2 overexpression reduced the expression of receptor activator of NF-kB ligand (RANKL) in bone marrow cells and strongly inhibited bone resorption. Osteoblast activity was not modified in the transgenic mice, but bone formation was decreased in 4-month-old transgenic mice because of reduced osteoblast number. Increased proteoglycan expression at the bone surface resulted in decreased osteoblastic and osteoclastic precursors in bone marrow. Indeed, syndecan-2 overexpression increased apoptosis of mesenchymal precursors within the bone marrow. However, syndecan-2 specifically promoted the vasculature characterized by high expression of CD31 and Endomucin in 6-week-old transgenic mice, but this was reduced in 12-week-old transgenic mice. Finally, syndecan-2 functions as an inhibitor of Wnt-β-catenin-T-cell factor signaling pathway, activating glycogen synthase kinase 3 and then decreasing the Wnt-dependent production of Wnt ligands and R-spondin. In conclusion, our results show that GAG supply may improve osteogenesis, but also interfere with the crosstalk between the bone surface and marrow cells, altering the supporting function of osteoblasts.


Conflict of interest statement

The authors declare no conflict of interest.

Figures

Figure 1
Figure 1
Syndecan-2 overexpression enriched bone surface with heparan sulfate glycosaminoglycans. (a) Immunohistological analysis of syndecan-2 in paraffin-embedded vertebra from 2-month-old WT (a and b) or ColI-Synd2 (c and d) mice. (b) Flow cytometry analysis of syndecan-2 expression. Marrow cells from 6-week-old mice were flushed from long bones and labeled with surface markers to select osteoblast precursors (CD51+Sca-1+ cells) or osteoblasts (CD51+Sca-1 cells). Fluorescence intensity versus structural parameter of the cells (FSC-H) was plotted. (c) The median fluorescence intensity (MFI) of syndecan-2 labeling was recorded in different cell populations from WT or ColI-Synd2 mice. Data are mean±S.E.M. (n=7 WT and three ColI-Synd2 mice). (d) The MFI of heparan sulfate labeling was recorded in CD51+Sca-1 cells from the marrow of WT or ColI-Synd2 mice. Data are mean±S.E.M. (n=4 WT and four ColI-Synd2 mice). (e) Immunohistological analysis of heparan sulfate chains in paraffin-embedded vertebra from 2-month-old WT or ColI-Synd2 mice. The photos presented are representative views of syndecan-2 or heparan sulfate staining. Arrows indicate syndecan-2- or heparan sulfate-expressing cells. Dashed lines indicate bone surfaces. *Indicates significant difference between WT and ColI-Synd2 (P<0.05)
Figure 2
Figure 2
Syndecan-2 overexpression in osteoblasts resulted in higher bone mass. Micro-CT analysis of femurs. (a) Representative sections and 3D images of trabecular bone in femurs from male mice. Variations in trabecular bone volume corrected by tissue volume (BV/TV; b) and trabecular thickness (Tb.Th), separation (Tb.Sp) and number (Tb.N; c) in 2- and 4-month-old mice. Data are mean±S.E.M. (n=5 at 2 months; n=10 at 4 months). * indicates significant difference between WT and ColI-Synd2 (P<0.05)
Figure 3
Figure 3
Syndecan-2 overexpression in osteoblasts inhibited bone resorption. (a) Detection of osteoclasts positive for TRAP (red cells) in femur sections from 10-week-old WT or ColI-Synd2 mice. (b) Quantification of proportion of bone surface with active osteoclasts (Oc.S/BS). Data are mean±S.E.M. (n=5 mice in each group). * indicates significant difference compared to controls (P<0.05). (c and d) Multinucleate TRAP-positive cells counted in bone marrow or spleen cells cultured with Vitamin D and ascorbic acid (c) or recombinant macrophage-colony-stimulating factor and RANKL (d) as indicated. Data are mean±S.E.M. from four different cultures. * indicates significant difference compared to controls (P<0.05). (e and f) RT-qPCR analysis of mRNA expression of RANKL and OPG in bone marrow cells from long bones or marrow-free bone tissue. Data are mean±S.E.M. (n=8 mice in each group). * indicates significant difference between WT and ColI-Synd2 (P<0.05). Arrows indicate TRAP positive osteoclasts
Figure 4
Figure 4
Syndecan-2 overexpression altered bone formation depending on mouse age. (a) Histomorphometric analysis of trabecular bone of male femurs in 2- and 4-month-old mice. Proportion of osteoid surface (OS/BS) and surface of active osteoblasts corrected by bone surface (Ob.S/BS) in femurs stained with toluidine blue. (b) Dynamic histomorphometric measurements of bone formation after calcein and tetracycline staining. (c) The extent of double labels and distance between the two stainings allowed for calculating the extent of mineralized surfaces (MS/BS), mineral apposition rate (MAR) and bone formation rate (BFR). Data are mean±S.E.M. (n=5 mice). (d) BMCs from WT or ColI-Synd2 mice were cultured for 11 days and stained for alkaline phosphatase activity for colony-formation unit (CFU)ALP+ assay. Data are mean±S.E.M. number of colonies per well (n=5 independent cultures from five mice). (e) RT-qPCR analysis of RUNX2 mRNA expression in BMCS from long bones. Data are mean±S.E.M. (n=5 mice). * indicates significant difference between WT and ColI-Synd2 (P<0.05)
Figure 5
Figure 5
Osteoblastic syndecan-2 affected osteogenic precursor apoptosis. RT-qPCR analysis of mRNA expression of Bcl2 (a) and BAX (b) in BMCs or bone extracts from 4-month-old mice. Data are mean±S.E.M. (n=5 mice in each group). (c and d) TUNEL analysis of apoptosis in vertebra sections of 4-month-old mice. The results are the mean±S.E.M. of the % of TUNEL-positive BMCs in vertebra sections from three mice. (e and f) Quantified flow cytometry of apoptotic Annexin+ (e) and BMC populations (f) of stromal precursors (CD45Sca-1+) and stromal mature cells (CD45Sca-1). Data are mean±S.D. percentage (n=5 mice). (f) Quantification of percentage of stromal precursors (CD45Sca-1+) and mature stromal cells (CD45Sca-1). * indicates significant difference compared to controls (P<0.05). Arrowheads indicate apoptotic cells
Figure 6
Figure 6
Syndecan-2 overexpression altered angiogenesis. Flow cytometric analysis of CD31 and Endomucin-stained marrow cells. (a) Cells that did not express the markers of hematopoietic lineages (blue gate, Lin) have been selected for the analysis of CD31 and Endomucin expression. (B and F) Representative dot plots of CD31 and Endomucin staining in WT (C and D) or transgenic mice (E and F) at 6 weeks (C and E) or 12 weeks (D and F) of age. P5 gate was placed arbitrarily to select cells with the higher levels of CD31 and Endomucin. (b) Quantification of the % of Lin cells with CD31 staining. (c) Quantification of the % of Lin cells with Endomucin staining. (d) Quantification of the % of Lin cells that expressed high levels of CD31 and Endomucin (P5 gate). Results are the mean %±S.E.M. (seven WT and three ColI-Synd2 for 6-week-old mice; four WT and four ColI-Synd2 for 12-week-old mice). * indicates significant difference between WT and ColI-Synd2 (P<0.05). (e) Representative photos of analysis of Endomucin-expressing vessels within the bone marrow of 6-week-old (A and B) or 4-month-old (C and D) mice. Sections of paraffin-embedded vertebra from WT (A and C) or transgenic (B and D) mice were stained with an anti-endomucin antibody and green fluorescence-conjugated secondary antibody. DAPI was used to stain the nuclei. Control sections were incubated with rat Ig (E). Arrows indicate the vessels with Endomucin+ cells
Figure 7
Figure 7
Syndecan-2 overexpression decreased Wnt/β-catenin signaling in osteoblasts. RT-qPCR analysis of Wnt target genes (a) and Wnt inhibitors (b) in bone extracts. Data are mean±S.E.M. (n=6 mice). * Indicates significant difference from controls (P<0.05). Immunofluorescence analysis of syndecan-2 expression and GSK3 activation in vertebra with the antibodies anti-syndecan-2 (α-synd2) and anti-phospho-GSK3 (Tyr279/Tyr216; α-PGSK3*). Cell nuclei were stained with DAPI. (d) RT-qPCR analysis of Wnt ligands and RSPO-2. (e) Expression of RSPO-2 in vertebra sections. Dashed lines indicate bone surface. (f) BMCs from WT mice were cultured with porous inserts containing WT or ColI-Synd2 osteoblasts with and without 15% Wnt3a-containing medium (Wnt3a-CM). Apoptotic BMCs were stained with the Sytox probe and counted. Data are mean±S.E.M. of the % of apoptotic cells (n=6 WT and 6 ColI-Synd2 OB cultures). a indicates a significant difference between culture with WT and ColI-Synd2 osteoblasts. b indicates a significant difference between Wnt3a-treated and non-treated cells. SOST, sclerostin

References

    1. Salbach-Hirsch J, Ziegler N, Thiele S, Moeller S, Schnabelrauch M, Hintze V et al. Sulfated glycosaminoglycans support osteoblast functions and concurrently suppress osteoclasts. J Cell Biochem 2014; 115: 1101–1111. - PubMed
    1. Salbach J, Rachner TD, Rauner M, Hempel U, Anderegg U, Franz S et al. Regenerative potential of glycosaminoglycans for skin and bone. J Mol Med 2012; 90: 625–635. - PubMed
    1. Banka S, Cain Sa, Carim S, Daly SB, Urquhart JE, Erdem G et al. Leri’s pleonosteosis, a congenital rheumatic disease, results from microduplication at 8q22.1 encompassing GDF6 and SDC2 and provides insight into systemic sclerosis pathogenesis. Ann Rheum Dis 2014; 74: 1249–1256. - PubMed
    1. Kingma SDK, Wagemans T, IJlst L, Bronckers ALJJ, van Kuppevelt TH, Everts V et al. Altered interaction and distribution of glycosaminoglycans and growth factors in mucopolysaccharidosis type I bone disease. Bone 2016; 88: 92–100. - PubMed
    1. Picke A-K, Salbach-Hirsch J, Hintze V, Rother S, Rauner M, Kascholke C et al. Sulfated hyaluronan improves bone regeneration of diabetic rats by binding sclerostin and enhancing osteoblast function. Biomaterials 2016; 96: 11–23. - PubMed

MeSH terms

LinkOut - more resources