

Effects of the probiotic Bifidobacterium animalis subsp. lactis on the non-surgical treatment of periodontitis. A histomorphometric, microtomographic and immunohistochemical study in rats
- PMID: 28662142
- PMCID: PMC5491108
- DOI: 10.1371/journal.pone.0179946
Effects of the probiotic Bifidobacterium animalis subsp. lactis on the non-surgical treatment of periodontitis. A histomorphometric, microtomographic and immunohistochemical study in rats
Abstract
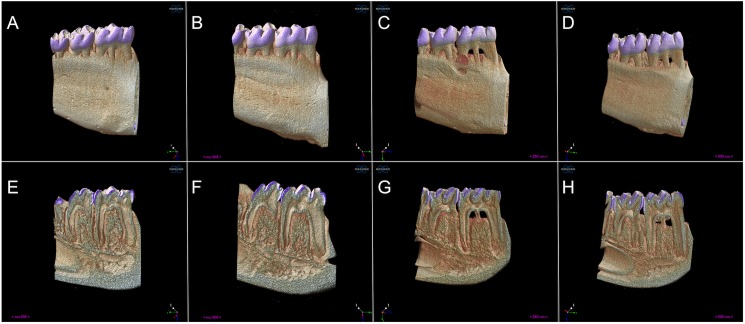
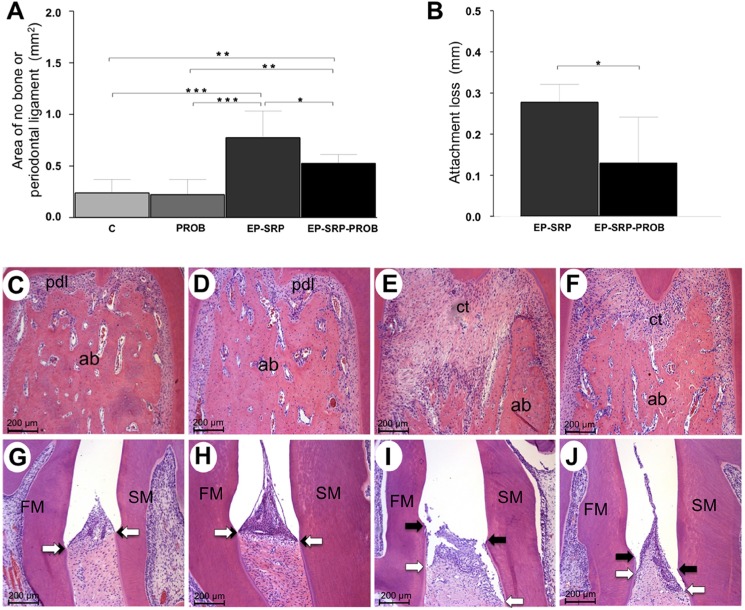
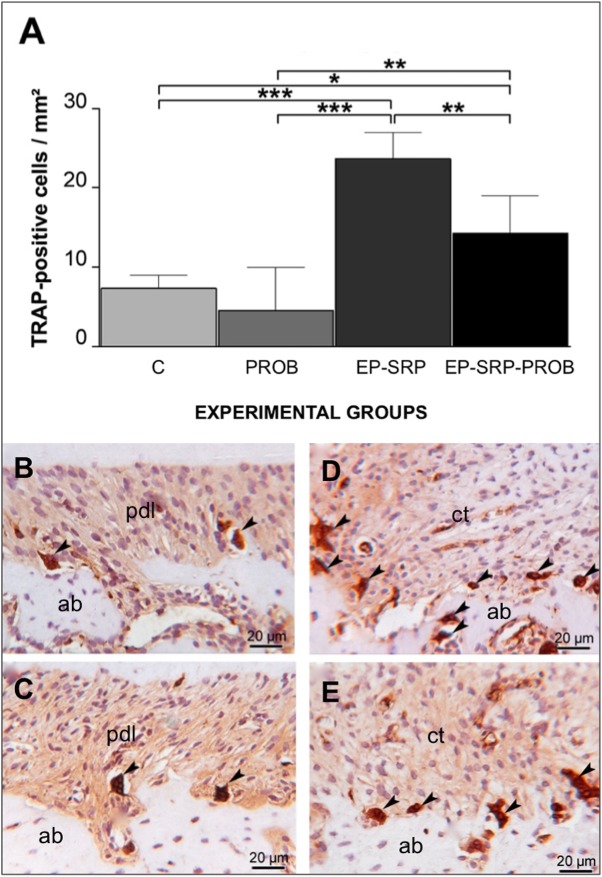
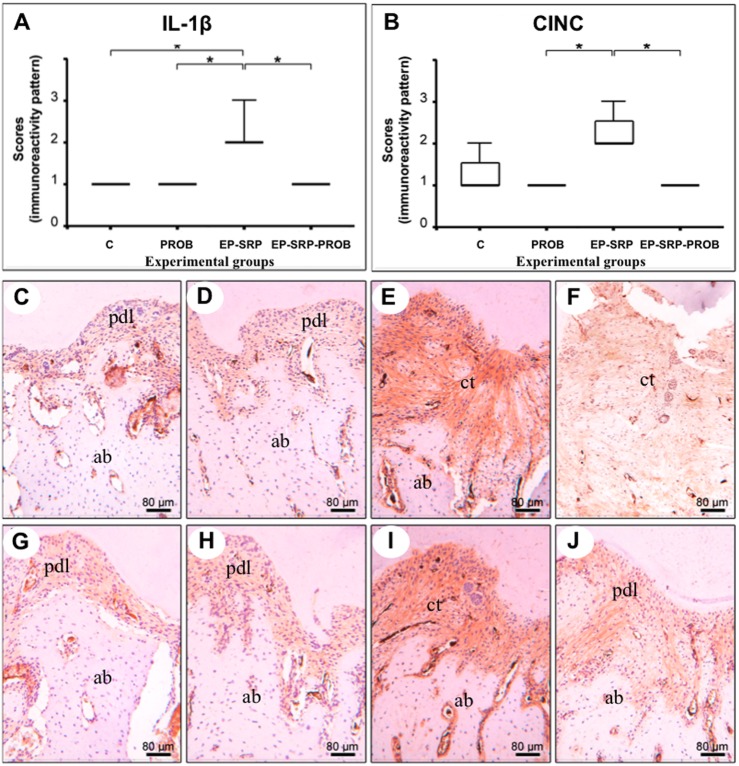
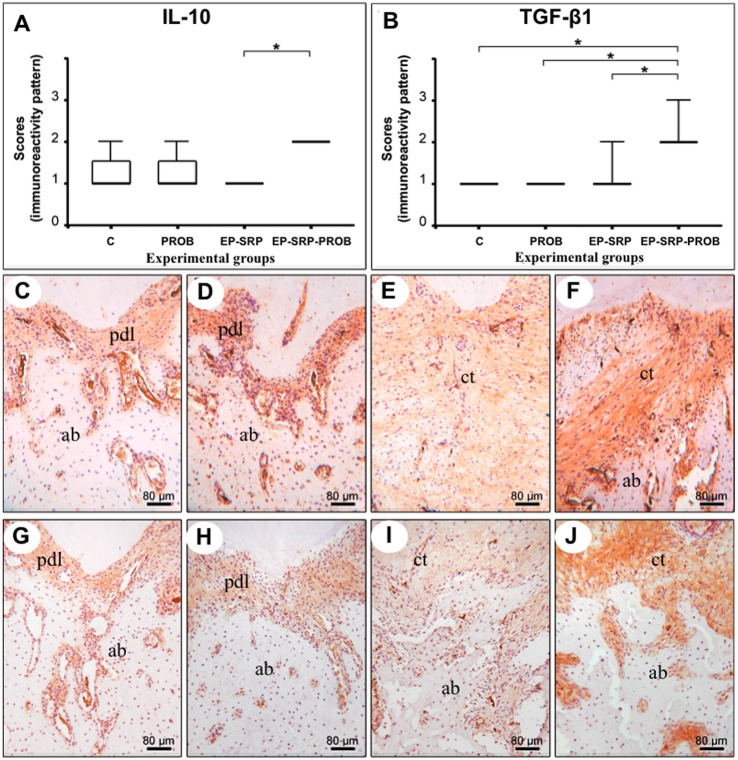
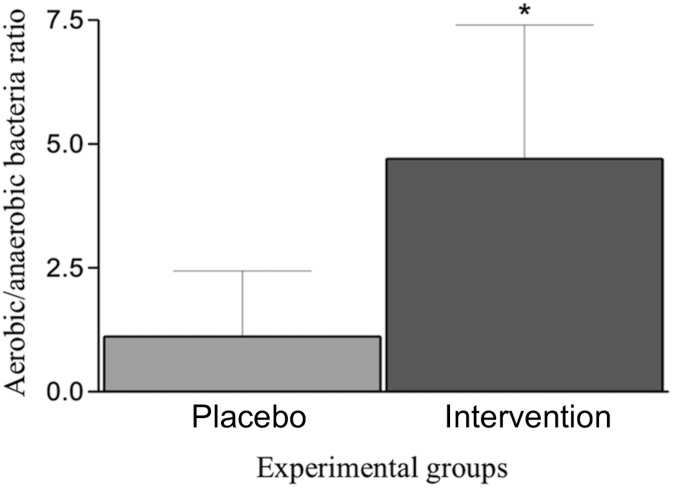
Lactobacillus probiotics have been investigated in periodontitis. However, the effects of the genus Bifidobacterium on periodontitis are hardly known. This study evaluated the effects of the probiotic (PROB) Bifidobacterium animalis subsp. lactis (B. lactis) HN019 as an adjunct to scaling and root planing (SRP) in rats with experimental periodontitis (EP). At baseline, 32 rats were assigned to 4 groups: C (control), PROB, EP-SRP and EP-SRP-PROB. In groups EP-SRP and EP-SRP-PROB, the mandibular first molars of the animals received a ligature. At day 14, the ligatures were removed and SRP was performed. Animals of groups PROB and EP-SRP-PROB were orally administered with 10 mL/day of 109 colony forming units of B. lactis HN019 for 15 days, starting at day 14. Animals were euthanized at day 29. Histomorphometric, microtomographic and immunohistochemical analyses were performed. Microbiological effects of B. lactis on biofilm were also evaluated. Data were statistically analyzed (ANOVA, Tukey; Kruskal-Wallis, Dunn's; Two-tailed t-test; p<0.05). Group EP-SRP-PROB presented reduced alveolar bone resorption and attachment loss when compared with Group EP-SRP (p<0.05). Group EP-SRP-PROB showed significantly fewer osteoclasts, increased expression of anti-inflammatory cytokines and reduced expression of proinflammatory cytokines compared with Group EP-SRP (p<0.05). B. lactis promoted a higher ratio between aerobic and anaerobic bacteria in biofilm samples (p<0.05). B. lactis HN019 may have a role in the treatment of EP in rats, as an adjunct to SRP.
Conflict of interest statement
Figures
Similar articles
-
Effects of Bifidobacterium animalis subsp. lactis HN019 on ligature-induced periodontitis in rats with experimental rheumatoid arthritis.Benef Microbes. 2020 Feb 19;11(1):33-46. doi: 10.3920/BM2019.0038. Epub 2019 Dec 17. Benef Microbes. 2020. PMID: 32066256
-
Benefits of Bifidobacterium animalis subsp. lactis Probiotic in Experimental Periodontitis.J Periodontol. 2017 Feb;88(2):197-208. doi: 10.1902/jop.2016.160217. Epub 2016 Sep 23. J Periodontol. 2017. PMID: 27660886
-
Probiotic consumption can modify the resilience of periodontal tissues in rats under experimental periodontitis.J Periodontol. 2023 Feb;94(2):217-229. doi: 10.1002/JPER.21-0555. Epub 2022 Dec 27. J Periodontol. 2023. PMID: 35690993
-
Use of the Probiotic Bifidobacterium animalis subsp. lactis HN019 in Oral Diseases.Int J Mol Sci. 2022 Aug 19;23(16):9334. doi: 10.3390/ijms23169334. Int J Mol Sci. 2022. PMID: 36012597 Free PMC article. Review.
-
In vitro Cholesterol Assimilation by Bifidobacterium animalis subsp. lactis (BPL1) Probiotic Bacteria Under Intestinal Conditions.Endocr Metab Immune Disord Drug Targets. 2022;22(4):433-439. doi: 10.2174/1871530321666210908124848. Endocr Metab Immune Disord Drug Targets. 2022. PMID: 34496737 Review.
Cited by
-
Can Probiotics Emerge as Effective Therapeutic Agents in Apical Periodontitis? A Review.Probiotics Antimicrob Proteins. 2021 Apr;13(2):299-314. doi: 10.1007/s12602-021-09750-2. Epub 2021 Feb 13. Probiotics Antimicrob Proteins. 2021. PMID: 33580864 Review.
-
Probiotic-based irrigation solution reduces neutrophil extracellular trap formation and stimulates CRAMP antimicrobial peptide expression in rat teeth with induced periapical lesions.Clin Oral Investig. 2025 May 28;29(6):317. doi: 10.1007/s00784-025-06383-5. Clin Oral Investig. 2025. PMID: 40434654
-
Probiotics During the Therapeutic Management of Periodontitis.Adv Exp Med Biol. 2022;1373:353-375. doi: 10.1007/978-3-030-96881-6_19. Adv Exp Med Biol. 2022. PMID: 35612808 Review.
-
The effects of Lactobacillus reuteri on the inflammation and periodontal tissue repair in rats: A pilot study.Saudi Dent J. 2022 Sep;34(6):516-526. doi: 10.1016/j.sdentj.2022.05.004. Epub 2022 May 20. Saudi Dent J. 2022. PMID: 36092517 Free PMC article.
-
Bifidobacterium animalis subsp. lactis as adjunct to non-surgical periodontal treatment in periodontitis: a randomized controlled clinical trial.Clin Oral Investig. 2023 May;27(5):1965-1972. doi: 10.1007/s00784-023-04870-1. Epub 2023 Jan 25. Clin Oral Investig. 2023. PMID: 36697840 Clinical Trial.
References
-
- Maekawa T, Hajishengallis G. Topical treatment with probiotic Lactobacillus brevis CD2 inhibits experimental periodontal inflammation and bone loss. J Periodontal Res. 2014;49(6): 785–791. doi: 10.1111/jre.12164 - DOI - PMC - PubMed
-
- Teughels W, Durukan A, Ozcelik O, Pauwels M, Quirynen M, Haytac MC. Clinical and microbiological effects of Lactobacillus reuteri probiotics in the treatment of chronic periodontitis: a randomized placebo-controlled study. J Clin Periodontol. 2013;40(11): 1025–1035. doi: 10.1111/jcpe.12155 - DOI - PMC - PubMed
-
- Araya M, Morelli L, Reid G, Sanders ME, Stanton C. Joint FAO/WHO Working Group Report on Drafting Guidelines for the Evaluation of Probiotics in Food. 2002. Available from: www.who.int/entity/foodsafety/fs_management/en/probiotic_guidelines.pdf.
-
- Hemarajata P, Versalovic J. Effects of probiotics on gut microbiota: mechanisms of intestinal immunomodulation and neuromodulation. Therap Adv Gastroenterol. 2013;6(1): 39–51. doi: 10.1177/1756283X12459294 - DOI - PMC - PubMed
-
- Vivekananda MR, Vandana KL, Bhat KG. Effect of the probiotic Lactobacilli reuteri (Prodentis) in the management of periodontal disease: a preliminary randomized clinical trial. J Oral Microbiol. 2010; 2;2 doi: 10.3402/jom.v2i0.5344 - DOI - PMC - PubMed
MeSH terms
LinkOut - more resources
Full Text Sources
Other Literature Sources
Medical
Molecular Biology Databases
