. 2017 Jun 29;12(6):e0180429.
doi: 10.1371/journal.pone.0180429. eCollection 2017.

Does external pneumatic compression treatment between bouts of overreaching resistance training sessions exert differential effects on molecular signaling and performance-related variables compared to passive recovery? An exploratory study

Affiliations

Does external pneumatic compression treatment between bouts of overreaching resistance training sessions exert differential effects on molecular signaling and performance-related variables compared to passive recovery? An exploratory study

Cody T Haun et al. PLoS One. .

Abstract

Purpose: We sought to compare the effects of external pneumatic compression (EPC) and sham when used concurrently with resistance training on performance-related outcomes and molecular measures related to recovery.

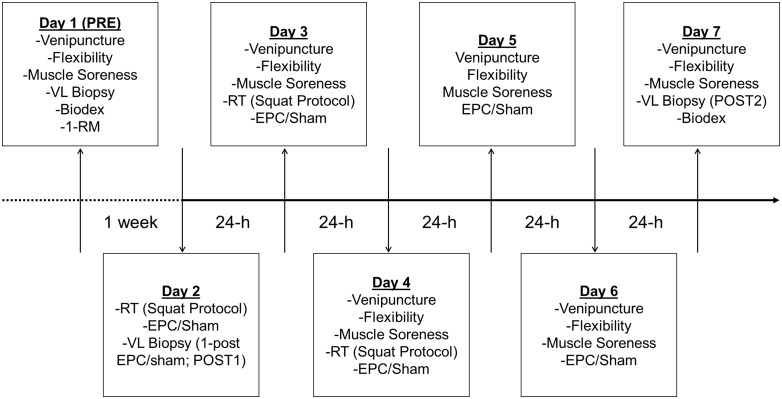
Methods: Twenty (N = 20) resistance-trained male participants (aged 21.6±2.4 years) were randomized to balanced sham or EPC intervention groups. The protocol consisted of 3 consecutive days of heavy, voluminous back squat exercise followed by EPC/sham treatment (Days2-4) and 3 consecutive days of recovery (Days5-7) with EPC/sham only on Days5-6. On Day1 (PRE), and Days3-7, venipuncture, flexibility and pressure-to-pain threshold (PPT) measures were performed. Vastsus lateralis muscle tissue was biopsied at PRE, 1-h post-EPC/sham treatment on Day2 (POST1) and 24-h post-EPC/sham treatment on Day7 (POST2). Isokinetic peak torque was assessed at PRE and POST2.

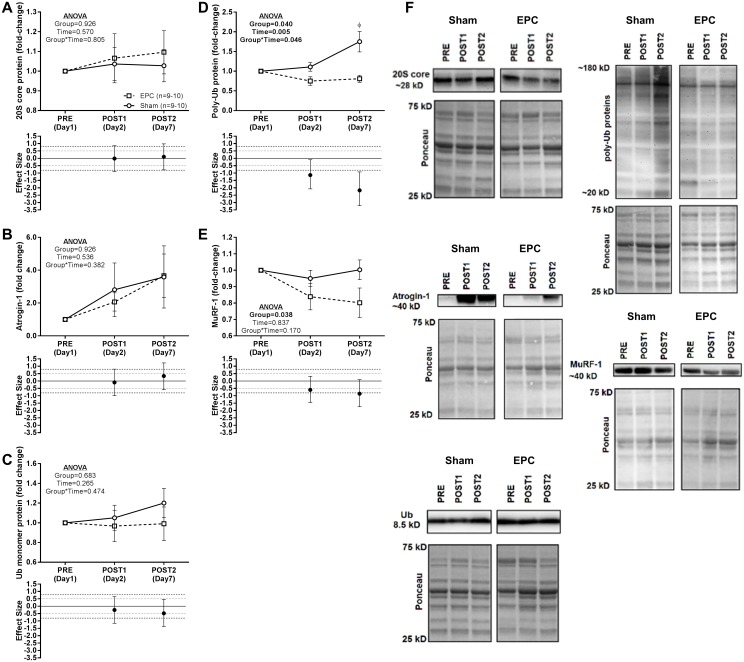
Results: Peak isokinetic strength did not change from PRE to POST2 in either group. The PPT was significantly lower on Days3-6 with sham, indicating greater muscle soreness, though this was largely abolished in the EPC group. A significant decrease in flexibility with sham was observed on Day3 (+16.2±4.6% knee joint angle; P<0.01) whereas there was no change with EPC (+2.8±3.8%; P>0.01). Vastus lateralis poly-ubiquitinated proteins significantly increased at the POST2 time point relative to PRE with sham (+66.6±24.6%; P<0.025) and were significantly greater (P<0.025) than those observed with EPC at the same time point (-18.6±8.5%). 4-hydroxynonenal values were significantly lower at POST2 relative to PRE with EPC (-16.2±5.6%; P<0.025) and were significantly lower (P<0.025) than those observed with sham at the same time point (+11.8±5.9%).

Conclusion: EPC mitigated a reduction in flexibility and PPT that occurred with sham. Moreover, EPC reduced select skeletal muscle oxidative stress and proteolysis markers during recovery from heavy resistance exercise.


Conflict of interest statement

Competing Interests: Partial reagent and participant compensation costs (50%) were paid through a contract awarded to J.S.M. by Normatec (Newton Centre, MA, USA). The funders did have a role in study design, but had no role in data collection and analysis, decision to publish, or preparation of the manuscript. This does not alter our adherence to PLOS ONE policies on sharing data and materials. Moreover, none of the authors have conflicts of interest and/or competing interests to disclose.

Figures

Fig 1
Fig 1. Time and events associated with the protocol utilized herein.
On what is termed as Day 1 (i.e., PRE), participants’ baseline right knee range of motion (i.e., flexibility), pressure-to-pain threshold in the right vastus lateralis (i.e., muscle soreness), and peak isokinetic right knee extensor torque (Biodex) values were established. In addition, venipuncture and a vastus lateralis biopsy of the left leg was performed for subsequent analyses. Finally, 1-RM back squat values were established for determination of training loads. Participants then reported to the laboratory exactly 1 week later (i.e. Day 2; POST1) and performed 10 sets of 5 reps of the back squat at 80% of their established 1-RM. This was immediately followed by randomization to either the external pneumatic compression (EPC) or sham treatment group. According to group assignment, immediately following resistance training, participants were treated for 1 h. 1 h following treatment a second biopsy of the left vastus lateralis was performed. On the next 2 consecutive days (Day 3 and 4) participants completed the same resistance training followed by respective treatment protocol. On these days, venipuncture and muscle soreness and flexibility assessments were performed prior to resistance training. On the next 2 consecutive days (Days 5–6) venipuncture and the muscle soreness and flexibility assessments were performed and were followed by treatment according to group assignment (no resistance training was performed). Finally, on Day 7 (i.e., POST2) participants reported to the lab for venipuncture and the muscle soreness and flexibility assessments. Thereafter, a third biopsy of the left vastus lateralis was performed and peak isokinetic right knee extensor torque was measured.
Fig 2
Fig 2. Representative image of the external pneumatic compression (EPC) device utilized herein.
Pictured is the external pneumatic compression (EPC) device and leg sleeves (right) and an illustration of the peristaltic pulse massage pattern (left).
Fig 3
Fig 3. Changes in right vastus lateralis pressure-to-pain threshold and flexibility about the right knee.
Pressure-to-pain threshold (PPT) along the right vastus lateralis at a proximal, medial and distal site is presented in Panels A-C. The PPT threshold was assessed via muscle algometry with pressure applied at a rate of ~5 N/s until the subject verbally indicated the pressure had turned into pain. Cyclical PPT measurements were made in triplicate. Flexibility assessed via right knee range of motion in a modified lunge position is presented in Panel D. For all panels data are presented as mean ± standard error and effect sizes for change from PRE are presented as d ± 95% confidence interval. Effect sizes were calculated as mean change from PRE in the EPC group less mean change from PRE in the sham group divided by the pooled standard deviation for each respective time point. Repeated measures MANOVA was performed with PRE values as a covariate and an α ≤ 0.05 required for statistical significance. Main effects of time and/or group are presented as emphasized p-values. Post-hoc testing for a main effect of time was performed using using Student’s paired t-tests and an α ≤ 0.01 was required for statistical significance. *, time point (collapsed across groups) significantly different from PRE.
Fig 4
Fig 4. Humoral markers of muscle damage and inflammation.
Creatine kinase (CK; Panel A), C-reactive protein (CRP; Panel B) and interleukin-6 (IL-6; Panel C) concentrations in the blood were measured at baseline (PRE/Day1) and on Days 3–7 of the protocol. Data are presented as mean respective concentrations ± standard error. Effect sizes were calculated as mean change from PRE in the EPC group less mean change from PRE in the sham group divided by the pooled standard deviation for each respective time point. Repeated measures MANOVA was performed with PRE values as a covariate and an α ≤ 0.05 required for statistical significance. Main effects of time and/or group are presented as emphasized p-values. Post-hoc testing for a main effect of time was performed using Student’s paired t-tests and an α ≤ 0.01 was required for statistical significance. *, time point (collapsed across groups) significantly different from PRE.
Fig 5
Fig 5. Protein expression patterns related to anabolic signaling.
At baseline (PRE), 1 h following a heavy back squat resistance training session and treatment with EPC or sham (POST1) and 24 h following 3 consecutive days of heavy back squat resistance training session and treatment with EPC or sham and 2 additional, consecutive days of treatment with EPC or sham (POST2) protein expression patterns related to anabolic signaling were probed. Western blot analysis of protein concentrations in vastus lateralis biopsy samples are presented for A) insulin-like growth factor (IGF-1), B) phosphorylated 4E-binding protein 1 (p-4EBP1), and C) phosphorylated p-70 S6 kinase (p-p70s6k). Representative images and respective Ponceau images for all proteins are presented in Panel D. Protein expression data are expressed as fold-change from PRE levels (mean ± standard error) and effect sizes for change from PRE are presented as d ± 95% confidence interval. Effect sizes were calculated as mean change from PRE in the EPC group less mean change from PRE in the sham group divided by the pooled standard deviation for each respective time point. Repeated measures MANOVA was performed with PRE values as a covariate and an α ≤ 0.05 required for statistical significance. All statistics were performed using the absolute expression values. Main effects of time are presented as emphasized p-values. Post-hoc testing for a main effect of time was performed using Student’s paired t-tests and an α ≤ 0.025 was required for statistical significance.
Fig 6
Fig 6. Protein expression patterns related to proteolytic signaling.
At baseline (PRE), 1 h following a heavy back squat resistance training session and treatment with EPC or sham (POST1) and 24 h following 3 consecutive days of heavy back squat resistance training session and treatment with EPC or sham and 2 additional, consecutive days of treatment with EPC or sham (POST2) protein expression patterns related to proteolytic signaling were probed. Western blot analysis of protein concentrations in vastus lateralis biopsy samples are presented in panels A) 20S core proteasome protein, B) atrogin-1, C) Ubiquitin (Ub) monomer protein, D) poly-ubiqutinated (poly-Ub) proteins, and E) MuRF-1. Representative images and respective Ponceau images for all proteins are presented in Panel F. Protein expression data are expressed as fold-change from PRE levels (mean ± standard error) and effect sizes for change from PRE are presented as d ± 95% confidence interval. Effect sizes were calculated as mean change from PRE in the EPC group less mean change from PRE in the sham group divided by the pooled standard deviation for each respective time point. Repeated measures MANOVA was performed with PRE values as a covariate and an α ≤ 0.05 required for statistical significance. All statistics were performed using the absolute expression values. Main effects and/or group*time interactions are presented as emphasized p-values. Post-hoc testing for between time point differences (independent of group) and between group differences at the POST1 and POST2 time points were performed using Student’s paired t-tests and an α ≤ 0.025 was required for statistical significance. ϕ, significantly different from sham at same time point.
Fig 7
Fig 7. Protein expression patterns related to inflammatory and oxidative stress signaling.
At baseline (PRE), 1 h following a heavy back squat resistance training session and treatment with EPC or sham (POST1) and 24 h following 3 consecutive days of heavy back squat resistance training session and treatment with EPC or sham and 2 additional, consecutive days of treatment with EPC or sham (POST2). Western blot analysis of protein concentrations in vastus lateralis biopsy samples are presented for A) pan-nuclear factor kappa-light change-enhancer of activated B cells (pan-NF-κB), B) pan-nuclear factor of kappa light polypeptide gene enhancer in B-cells inhibitor, alpha (pan-IκBα), C) catalase, D) superoxide dismutase 2 (SOD2), and E) 4-hydroxynonenal (4HNE). Representative images and respective Ponceau images for all proteins are presented in Panel F. Protein expression data are expressed as fold-change from PRE levels (mean ± standard error) and effect sizes for change from PRE are presented as d ± 95% confidence interval. Effect sizes were calculated as mean change from PRE in the EPC group less mean change from PRE in the sham group divided by the pooled standard deviation for each respective time point. Repeated measures MANOVA was performed with PRE values as a covariate and an α ≤ 0.05 required for statistical significance. All statistics were performed using the absolute expression values. Main effects are presented as emphasized p-values. Post-hoc testing for between time point differences (independent of group) were performed using Student’s paired t-tests and an α ≤ 0.025 was required for statistical significance. *, time point (collapsed across groups) significantly different from PRE.

References

    1. Gill ND, Beaven CM, Cook C. Effectiveness of post-match recovery strategies in rugby players. British journal of sports medicine. 2006;40(3):260–3. doi: 10.1136/bjsm.2005.022483 - DOI - PMC - PubMed
    1. Kraemer WJ, Bush JA, Wickham RB, Denegar CR, Gomez AL, Gotshalk LA, et al. Influence of compression therapy on symptoms following soft tissue injury from maximal eccentric exercise. J Orthop Sports Phys Ther. 2001;31(6):282–90. doi: 10.2519/jospt.2001.31.6.282 . - DOI - PubMed
    1. Berry MJ, Bailey SP, Simpkins LS, TeWinkle JA. The effects of elastic tights on the post-exercise response. Canadian journal of sport sciences = Journal canadien des sciences du sport. 1990;15(4):244–8. . - PubMed
    1. Duffield R, Cannon J, King M. The effects of compression garments on recovery of muscle performance following high-intensity sprint and plyometric exercise. Journal of science and medicine in sport / Sports Medicine Australia. 2010;13(1):136–40. doi: 10.1016/j.jsams.2008.10.006 . - DOI - PubMed
    1. Martin JS, Borges AR, Beck DT. Peripheral conduit and resistance artery function are improved following a single, 1-h bout of peristaltic pulse external pneumatic compression. Eur J Appl Physiol. 2015;115(9):2019–29. doi: 10.1007/s00421-015-3187-8 . - DOI - PubMed

LinkOut - more resources