

People learn other people's preferences through inverse decision-making
- PMID: 28662485
- PMCID: PMC5572562
- DOI: 10.1016/j.cognition.2017.06.017
People learn other people's preferences through inverse decision-making
Erratum in
-
Corrigendum to "People learn other people's preferences through inverse decision-making" [Cognition 168 (2017) 46-64].Cognition. 2018 Jun;175:201. doi: 10.1016/j.cognition.2018.03.012. Epub 2018 Mar 22. Cognition. 2018. PMID: 29576243 No abstract available.
Abstract
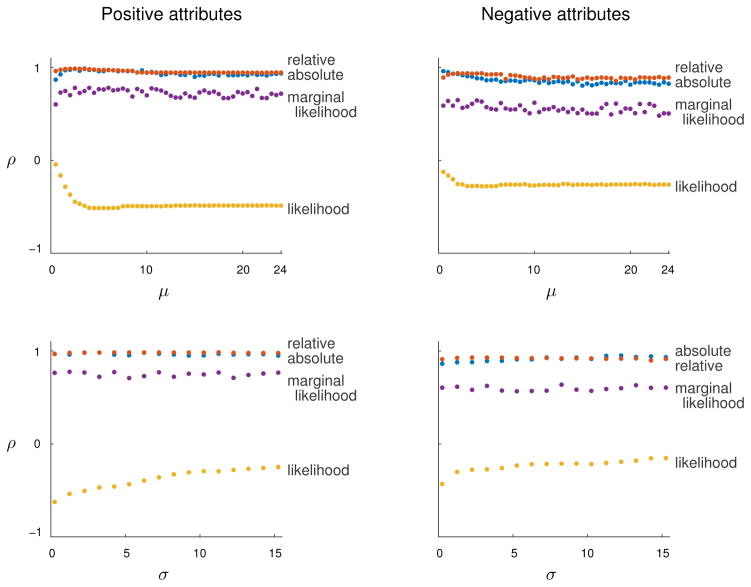
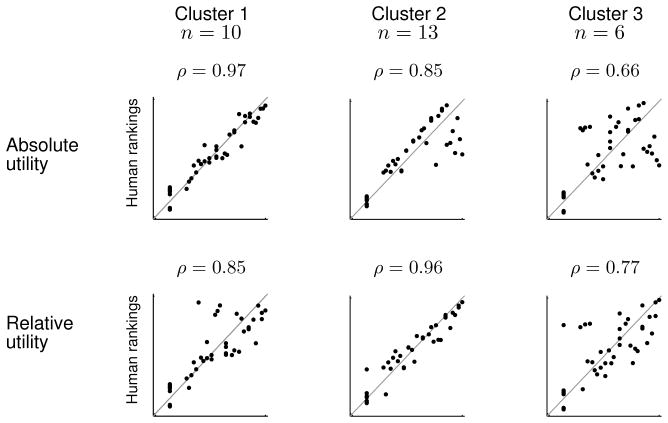
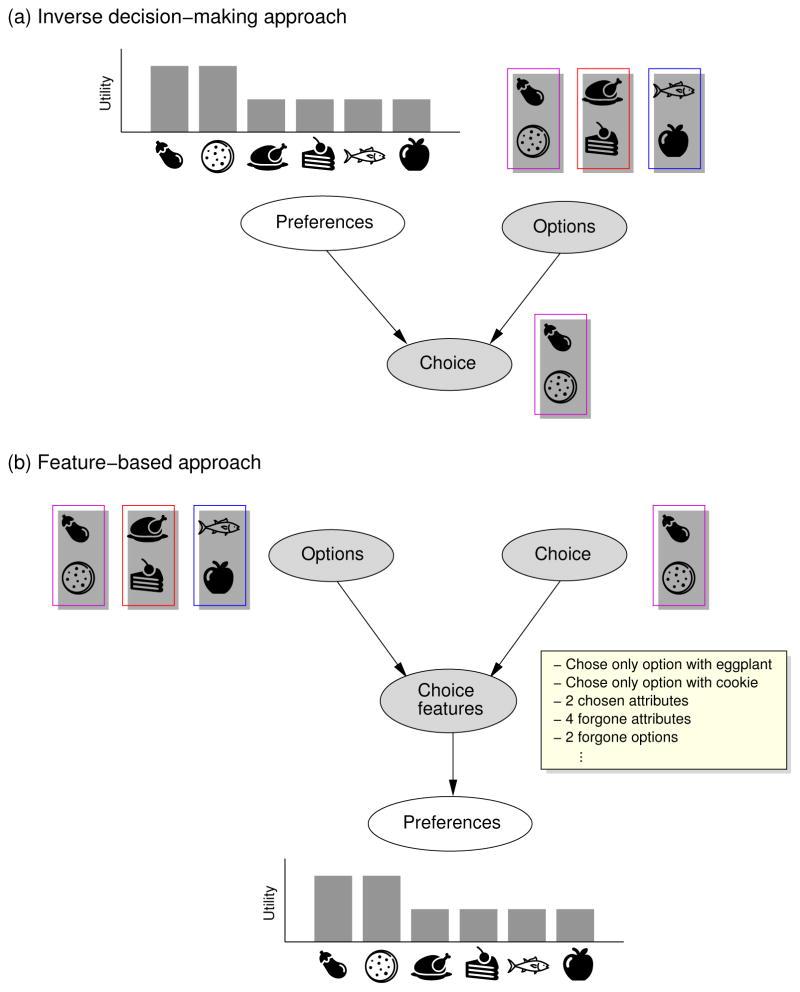
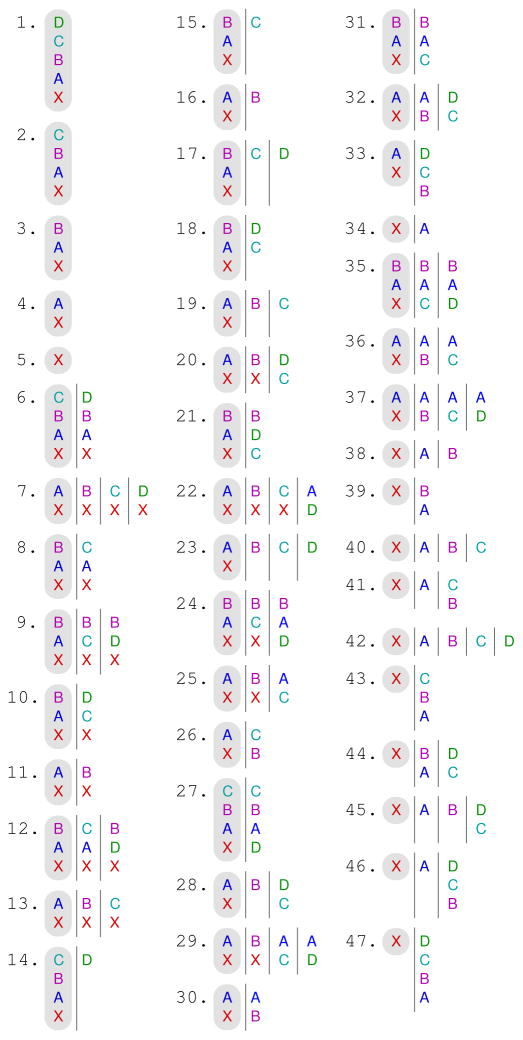
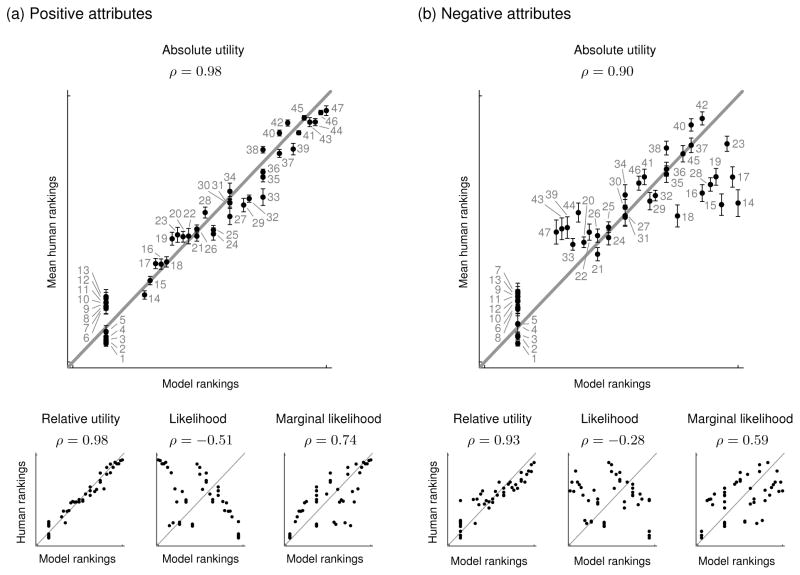
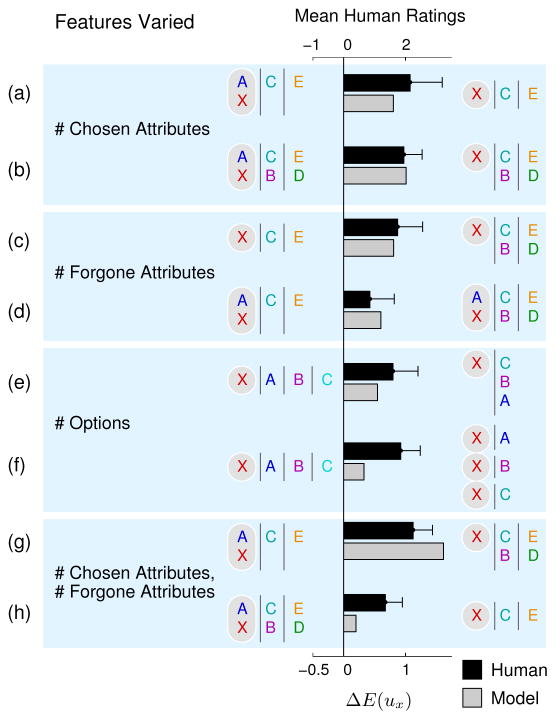
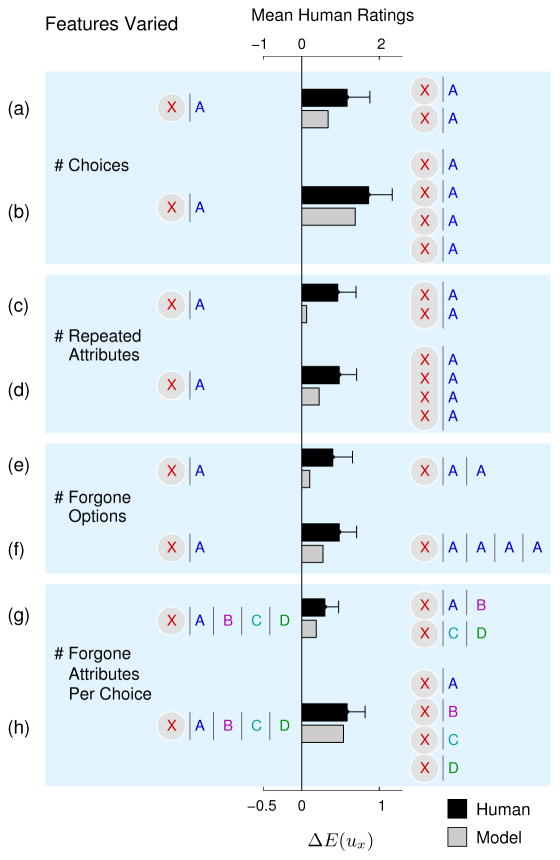
People are capable of learning other people's preferences by observing the choices they make. We propose that this learning relies on inverse decision-making-inverting a decision-making model to infer the preferences that led to an observed choice. In Experiment 1, participants observed 47 choices made by others and ranked them by how strongly each choice suggested that the decision maker had a preference for a specific item. An inverse decision-making model generated predictions that were in accordance with participants' inferences. Experiment 2 replicated and extended a previous study by Newtson (1974) in which participants observed pairs of choices and made judgments about which choice provided stronger evidence for a preference. Inverse decision-making again predicted the results, including a result that previous accounts could not explain. Experiment 3 used the same method as Experiment 2 and found that participants did not expect decision makers to be perfect utility-maximizers.
Keywords: Inverse decision-making; Preference learning; Social cognition; Trait inference.
Copyright © 2017 Elsevier B.V. All rights reserved.
Figures
Similar articles
-
Humans can infer social preferences from decision speed alone.PLoS Biol. 2024 Jun 20;22(6):e3002686. doi: 10.1371/journal.pbio.3002686. eCollection 2024 Jun. PLoS Biol. 2024. PMID: 38900903 Free PMC article.
-
A decision network account of reasoning about other people's choices.Cognition. 2015 Sep;142:12-38. doi: 10.1016/j.cognition.2015.05.006. Epub 2015 May 23. Cognition. 2015. PMID: 26010559 Free PMC article.
-
A rational model of people's inferences about others' preferences based on response times.Cognition. 2021 Dec;217:104885. doi: 10.1016/j.cognition.2021.104885. Epub 2021 Aug 25. Cognition. 2021. PMID: 34454336
-
Judgment and Decision Making.Annu Rev Psychol. 2020 Jan 4;71:331-355. doi: 10.1146/annurev-psych-010419-050747. Epub 2019 Jul 23. Annu Rev Psychol. 2020. PMID: 31337275 Review.
-
Mindful judgment and decision making.Annu Rev Psychol. 2009;60:53-85. doi: 10.1146/annurev.psych.60.110707.163633. Annu Rev Psychol. 2009. PMID: 18798706 Review.
Cited by
-
Humans flexibly integrate social information despite interindividual differences in reward.Proc Natl Acad Sci U S A. 2024 Sep 24;121(39):e2404928121. doi: 10.1073/pnas.2404928121. Epub 2024 Sep 20. Proc Natl Acad Sci U S A. 2024. PMID: 39302964 Free PMC article.
-
The Emerging Science of Interacting Minds.Perspect Psychol Sci. 2024 Mar;19(2):355-373. doi: 10.1177/17456916231200177. Epub 2023 Dec 14. Perspect Psychol Sci. 2024. PMID: 38096443 Free PMC article.
-
Machine Teaching for Human Inverse Reinforcement Learning.Front Robot AI. 2021 Jun 30;8:693050. doi: 10.3389/frobt.2021.693050. eCollection 2021. Front Robot AI. 2021. PMID: 34277719 Free PMC article.
-
Humans can infer social preferences from decision speed alone.PLoS Biol. 2024 Jun 20;22(6):e3002686. doi: 10.1371/journal.pbio.3002686. eCollection 2024 Jun. PLoS Biol. 2024. PMID: 38900903 Free PMC article.
-
A Rational Framework for Group-Based Selective Social Learning.Open Mind (Camb). 2025 May 9;9:677-708. doi: 10.1162/opmi_a_00205. eCollection 2025. Open Mind (Camb). 2025. PMID: 40474928 Free PMC article.
References
-
- Albert JH, Chib S. Bayesian analysis of binary and polychotomous response data. Journal of the American Statistical Association. 1993;88(422):669–679.
-
- Allenby GM, Lenk PJ. Modeling household purchase behavior with logistic normal regression. Journal of the American Statistical Association. 1994;89(428):1218–1231.
-
- Ames DR. Strategies for social inference: A similarity contingency model of projection and stereotyping in attribute prevalance estimates. Journal of Personality and Social Psychology. 2004;87(5):573–585. - PubMed
-
- Ariely D, Loewenstein G, Prelec D. Tom Sawyer and the construction of value. Journal of Economic Behavior & Organization. 2006;60(1):1–10.
-
- Baker CL, Jara-Ettinger J, Saxe R, Tenenbaum JB. Rational quantitative attribution of beliefs, desires and percepts in human mentalizing. Nature Human Behavior. 2017;1:0064.
MeSH terms
Grants and funding
LinkOut - more resources
Full Text Sources
Other Literature Sources
