. 2017 Jun 30;15(1):121.
doi: 10.1186/s12916-017-0887-4.

Effect of transmission intensity on hotspots and micro-epidemiology of malaria in sub-Saharan Africa

Affiliations

Effect of transmission intensity on hotspots and micro-epidemiology of malaria in sub-Saharan Africa

Polycarp Mogeni et al. BMC Med. .

Abstract

Background: Malaria transmission intensity is heterogeneous, complicating the implementation of malaria control interventions. We provide a description of the spatial micro-epidemiology of symptomatic malaria and asymptomatic parasitaemia in multiple sites.

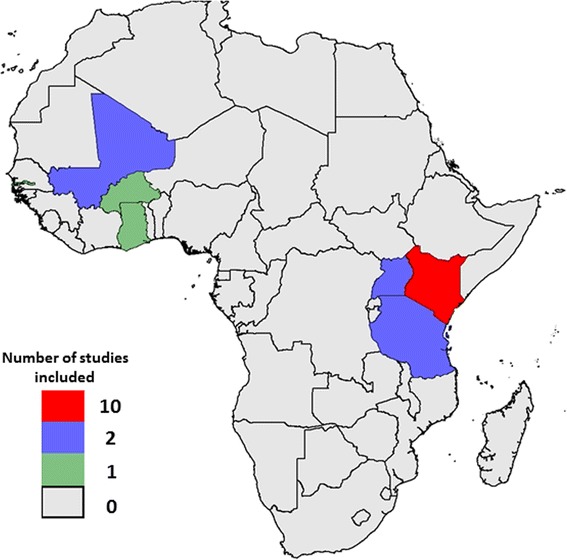
Methods: We assembled data from 19 studies conducted between 1996 and 2015 in seven countries of sub-Saharan Africa with homestead-level geospatial data. Data from each site were used to quantify spatial autocorrelation and examine the temporal stability of hotspots. Parameters from these analyses were examined to identify trends over varying transmission intensity.

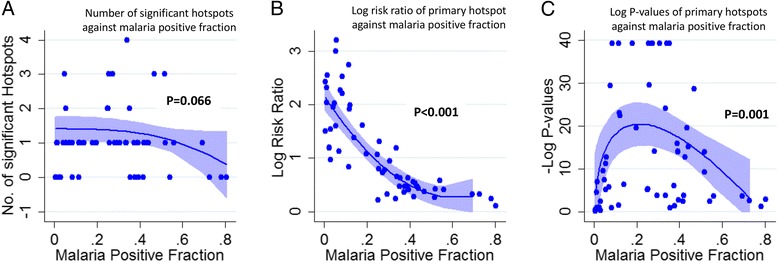
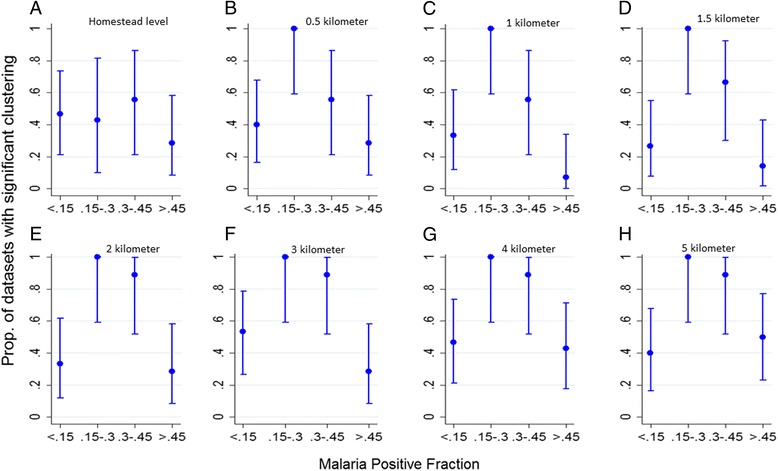
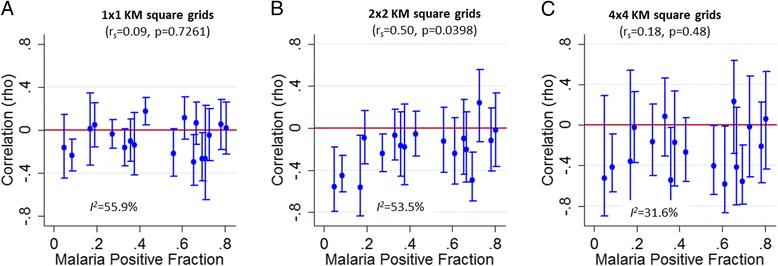
Results: Significant hotspots of malaria transmission were observed in most years and sites. The risk ratios of malaria within hotspots were highest at low malaria positive fractions (MPFs) and decreased with increasing MPF (p < 0.001). However, statistical significance of hotspots was lowest at extremely low and extremely high MPFs, with a peak in statistical significance at an MPF of ~0.3. In four sites with longitudinal data we noted temporal instability and variable negative correlations between MPF and average age of symptomatic malaria across all sites, suggesting varying degrees of temporal stability.

Conclusions: We observed geographical micro-variation in malaria transmission at sites with a variety of transmission intensities across sub-Saharan Africa. Hotspots are marked at lower transmission intensity, but it becomes difficult to show statistical significance when cases are sparse at very low transmission intensity. Given the predictability with which hotspots occur as transmission intensity falls, malaria control programmes should have a low threshold for responding to apparent clustering of cases.

Keywords: Age; Asymptomatic parasitaemia; D function; Hotspots; Malaria; Meta-analysis; Micro-epidemiology; Moran’s I; Stability of hotspots; Sub-Saharan Africa; Symptomatic malaria.


Figures

Fig. 1
Fig. 1
Map of sub-Saharan Africa showing countries and their respective number of studies included in the analysis
Fig. 2
Fig. 2
Hotspots of symptomatic parasitaemia. a displays a scatter plot of the number of significant hotspots per study area against malaria positive fraction, b shows the log risk ratios of malaria within the primary hotspot against the malaria positive fraction and c shows the –log (p values) of the primary hotspots against malaria positive fraction. The blue lines in a, b and c show the fitted multiple fractional polynomial model predictions after adjusting for study design and the overall age of study participants. Shaded areas in a, b and c represent 95% confidence intervals (CIs)
Fig. 3
Fig. 3
Clustering of malaria transmission. a, b, c, d, e, f, g and h show the proportion of datasets with significant clustering at homestead level, 0.5, 1, 1.5, 2, 3, 4 and 5 km level respectively, against malaria positive fraction
Fig. 4
Fig. 4
Fine-scale geographical correlation of mean age (months) against malaria positive fraction (MPF) for each study dataset plotted against overall study MPFs (as a proxy for transmission intensity). a, b and c show 1 × 1, 2 × 2, and 4 × 4 km2 grids respectively. The test of heterogeneity between studies was I 2 = 55.9%, p = 0.002; I 2 = 53.5%, p = 0.005; and I 2 = 31.6%, p = 0.104 respectively

References

    1. Woolhouse ME, Dye C, Etard JF, Smith T, Charlwood JD, Garnett GP, et al. Heterogeneities in the transmission of infectious agents: implications for the design of control programs. Proc Natl Acad Sci U S A. 1997;94(1):338–42. doi: 10.1073/pnas.94.1.338. - DOI - PMC - PubMed
    1. Bousema T, Griffin JT, Sauerwein RW, Smith DL, Churcher TS, Takken W, et al. Hitting hotspots: spatial targeting of malaria for control and elimination. PLoS Med. 2012;9(1):e1001165. doi: 10.1371/journal.pmed.1001165. - DOI - PMC - PubMed
    1. Pullan RL, Sturrock HJ, Soares Magalhaes RJ, Clements AC, Brooker SJ. Spatial parasite ecology and epidemiology: a review of methods and applications. Parasitology. 2012;139(14):1870–87. doi: 10.1017/S0031182012000698. - DOI - PMC - PubMed
    1. Bejon P, Williams TN, Liljander A, Noor AM, Wambua J, Ogada E, et al. Stable and unstable malaria hotspots in longitudinal cohort studies in Kenya. PLoS Med. 2010;7(7):e1000304. doi: 10.1371/journal.pmed.1000304. - DOI - PMC - PubMed
    1. Bejon P, Williams TN, Nyundo C, Hay SI, Benz D, Gething PW, et al. A micro-epidemiological analysis of febrile malaria in Coastal Kenya showing hotspots within hotspots. Elife. 2014;3:e02130. doi: 10.7554/eLife.02130. - DOI - PMC - PubMed