. 2017 Aug 2;37(31):7347-7361.
doi: 10.1523/JNEUROSCI.0037-17.2017. Epub 2017 Jun 29.

Decreased Axon Caliber Underlies Loss of Fiber Tract Integrity, Disproportional Reductions in White Matter Volume, and Microcephaly in Angelman Syndrome Model Mice

Affiliations

Decreased Axon Caliber Underlies Loss of Fiber Tract Integrity, Disproportional Reductions in White Matter Volume, and Microcephaly in Angelman Syndrome Model Mice

Matthew C Judson et al. J Neurosci. .

Abstract

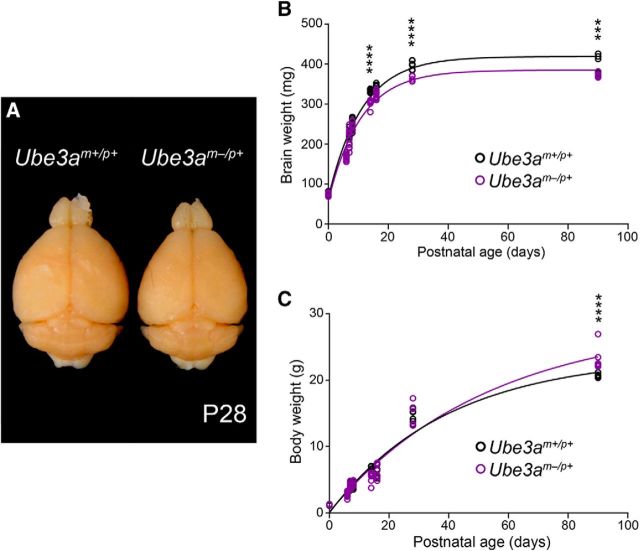
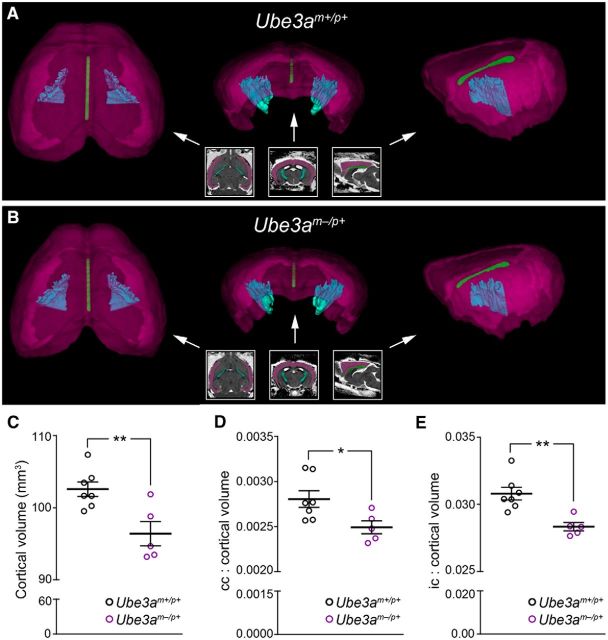
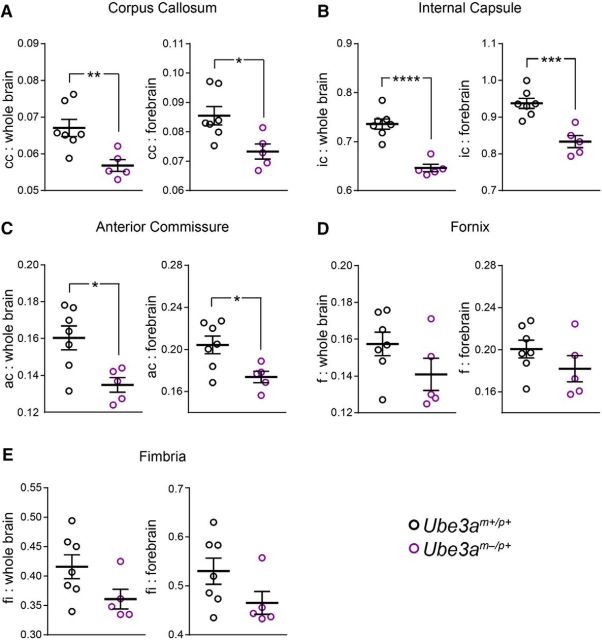
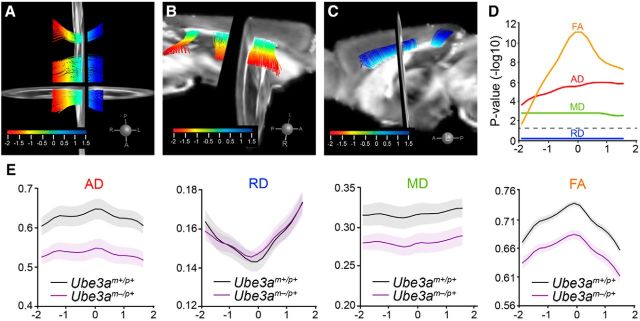
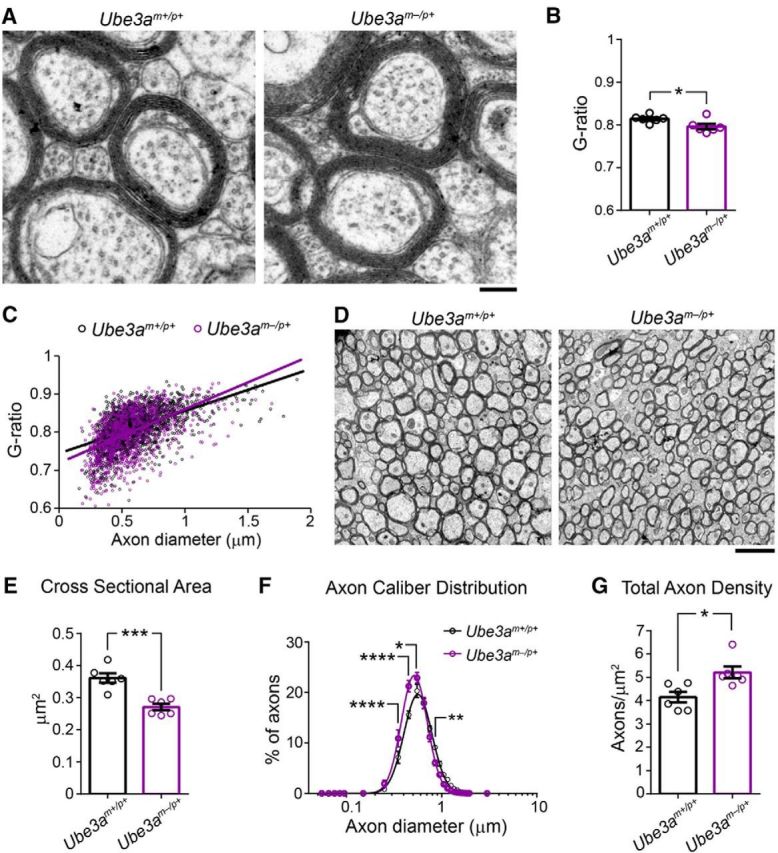
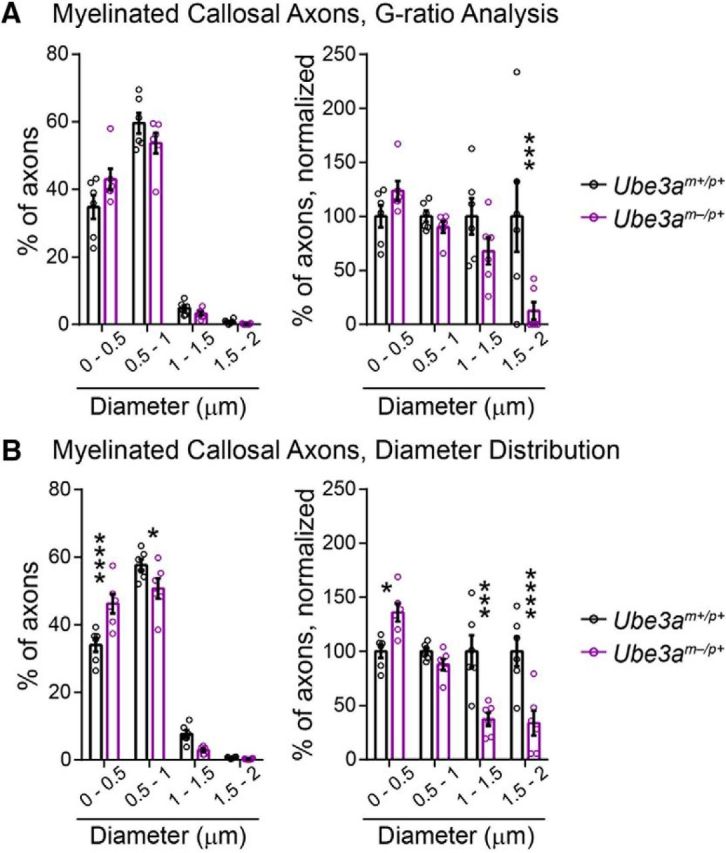
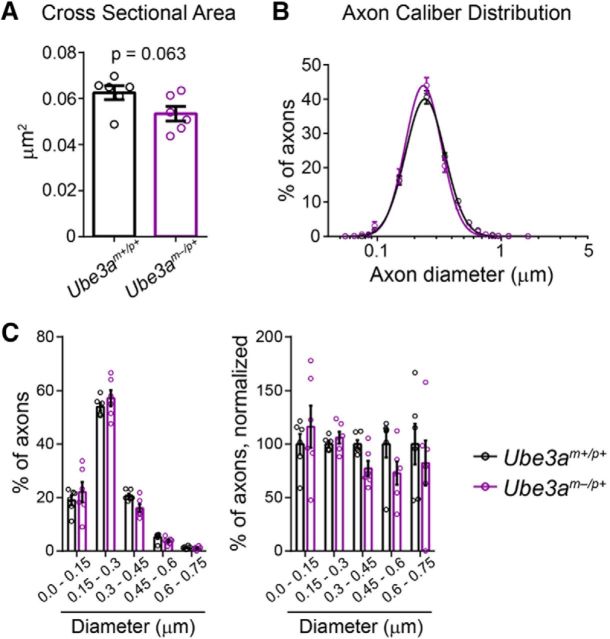
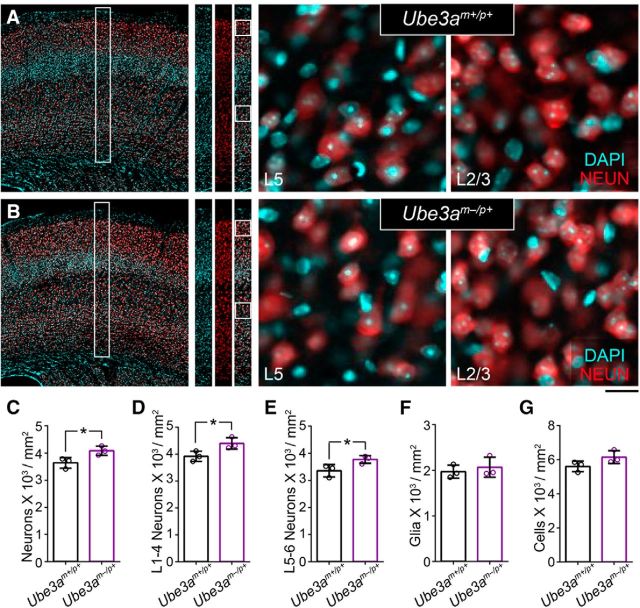
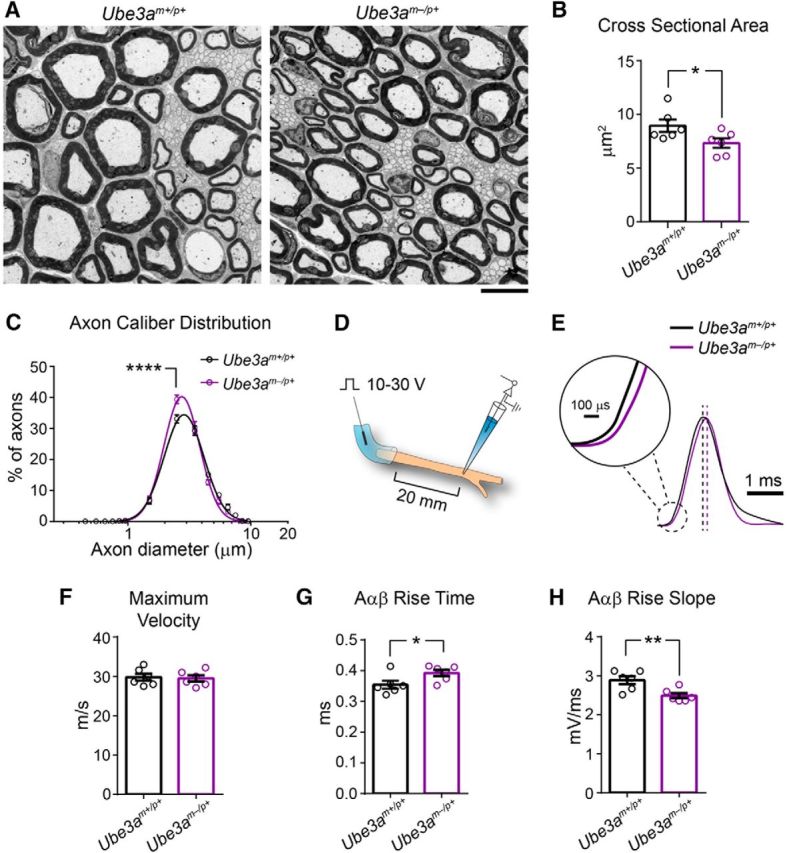
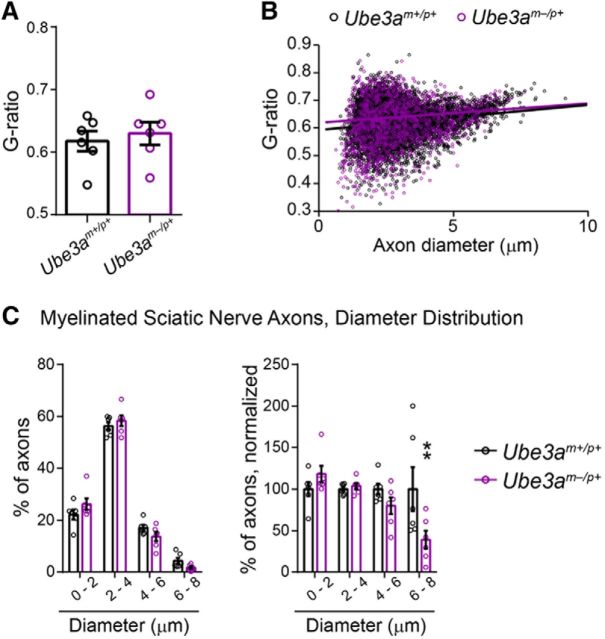
Angelman syndrome (AS) is a debilitating neurodevelopmental disorder caused by loss of function of the maternally inherited UBE3A allele. It is currently unclear how the consequences of this genetic insult unfold to impair neurodevelopment. We reasoned that by elucidating the basis of microcephaly in AS, a highly penetrant syndromic feature with early postnatal onset, we would gain new insights into the mechanisms by which maternal UBE3A loss derails neurotypical brain growth and function. Detailed anatomical analysis of both male and female maternal Ube3a-null mice reveals that microcephaly in the AS mouse model is primarily driven by deficits in the growth of white matter tracts, which by adulthood are characterized by densely packed axons of disproportionately small caliber. Our results implicate impaired axon growth in the pathogenesis of AS and identify noninvasive structural neuroimaging as a potentially valuable tool for gauging therapeutic efficacy in the disorder.SIGNIFICANCE STATEMENT People who maternally inherit a deletion or nonfunctional copy of the UBE3A gene develop Angelman syndrome (AS), a severe neurodevelopmental disorder. To better understand how loss of maternal UBE3A function derails brain development, we analyzed brain structure in a maternal Ube3a knock-out mouse model of AS. We report that the volume of white matter (WM) is disproportionately reduced in AS mice, indicating that deficits in WM development are a major factor underlying impaired brain growth and microcephaly in the disorder. Notably, we find that axons within the WM pathways of AS model mice are abnormally small in caliber. This defect is associated with slowed nerve conduction, which could contribute to behavioral deficits in AS, including motor dysfunction.

Keywords: Angelman; E6-AP; UBE3A; axon; microcephaly; white matter.


Figures

Figure 1.
Figure 1.
Ube3am−/p+ mice exhibit microcephaly with postnatal onset. A, Representative image of P28 Ube3am+/p+ and Ube3am−/p+ littermate brains after transcardial fixation and gross dissection. B, Cross-sectional analysis of postperfusion brain weights from littermate Ube3am+/p+ and Ube3am−/p+ mice. C, Cross-sectional analysis of premortem body weights from littermate Ube3am+/p+ and Ube3am−/p+ mice (P0: Ube3am+/p+ n = 7, Ube3am−/p+ n = 6; P6: Ube3am+/p+ n = 6, Ube3am−/p+ n = 13; P7: Ube3am+/p+ n = 8, Ube3am−/p+ n = 11; P8: Ube3am+/p+ n = 10, Ube3am−/p+ n = 7; P14: Ube3am+/p+ n = 8, Ube3am−/p+ n = 6; P16: Ube3am+/p+ n = 7, Ube3am−/p+ n = 10; P28: Ube3am+/p+ n = 7, Ube3am−/p+ n = 5; P90: Ube3am+/p+ n = 5, Ube3am−/p+ n = 6). Each dataset was fit with a single exponential. Data represent mean ± SEM, ***p ≤ 0.001, ****p ≤ 0.0001.
Figure 2.
Figure 2.
Cortical patterning is normal in adult Ube3am−/p+ mice. A, Images of DAPI-counterstained tangential cortical sections from ∼P90 wild-type (Scnn1a-Cre::Ai9::Ube3am+/p+) and Ube3am−/p+ (Scnn1a-Cre::Ai9::Ube3am−/p+) littermate mice expressing tdTomato in sensory cortices under the control of a L4-specific Cre driver. Scale bar, 1.8 mm. B, Representative sensory maps from Ube3am+/p+ and Ube3am−/p+ mice. C, Quantification of primary somatosensory (S1), visual (V1), and auditory (A1) cortical surface area as a percentage of total sensory cortical surface area (Ube3am+/p+ n = 5 mice, Ube3am−/p+ n = 3 mice). D, E, Immunostaining for the L2–4 marker CUX1 and the L5–6 marker CTIP2 with DAPI nuclear counterstaining in primary somatosensory cortex of ∼P90 Ube3am+/p+ (D) and Ube3am−/p+ (E) mice. Scale bar, 185 μm. F, Quantification of laminar contributions to cortical thickness (Ube3am+/p+ n = 3 mice, Ube3am−/p+ n = 3 mice). Data represent mean ± SEM.
Figure 3.
Figure 3.
Corpus callosum and internal capsule volumes are disproportionately reduced in adult Ube3am−/p+ mice. A, B, Representative 3D volumetric renderings of cerebral cortex (magenta), corpus callosum (green), and internal capsule (cyan) from Ube3am+/p+ (A) and Ube3am−/p+ (B) mice. Insets illustrate color-coded segmentation labels in register with (left to right) horizontal, coronal, and sagittal RD image slices, which reflect the plane of view for corresponding 3D renderings (indicated by arrows). C, MRI-based quantification of total cerebral cortical volume, excluding underlying WM. D, E, Quantification of corpus callosum (D) and internal capsule (E) volume as a ratio of total cerebral cortical volume (Ube3am+/p+ n = 7 mice, Ube3am−/p+ n = 5 mice). Data represent mean ± SEM, *p ≤ 0.05, **p ≤ 0.01.
Figure 4.
Figure 4.
Decreased ratios of WM volume to whole-brain and forebrain volumes in adult Ube3am−/p+ mice. AE, Quantification of corpus callosum (A), internal capsule (B), anterior commissure (C), fornix (D), and fimbria (E) volumes as a ratio of both whole-brain volume and forebrain volume in Ube3am+/p+ (n = 7) and Ube3am−/p+ (n = 5) mice. Data represent mean ± SEM, *p ≤ 0.05, **p ≤ 0.01, ***p ≤ 0.001, ****p ≤ 0.0001.
Figure 5.
Figure 5.
DTI tractography reveals deficits in callosal WM integrity in adult Ube3am−/p+ mice. AC, Tractography-computed callosal tract (713 fibers) in register with coronal and sagittal views of the FA atlas, which was generated from the average DTI of all Ube3am+/p+ (n = 7) and Ube3am−/p+ (n = 6) mice. The isthmus of the callosum was not computed. Dorsal (A) and lateral views from right (B) and from left (C) are shown. Color scale corresponds to arc-length position for statistical sampling along the mediolateral aspect of the tract. D, Distribution of false discovery rate-corrected local p-values (−log10) for each diffusion parameter along the arc-length of the callosal tract. Dashed line indicates p = 0.05 significance threshold. E, Tract-based statistical summaries for each diffusion measure: AD, RD, MD, and FA. y-axis values for AD, RD, and MD are multiplied by 103. Data represent mean ± SEM.
Figure 6.
Figure 6.
Callosal axons in adult Ube3am−/p+ mice display normal myelination but decreased caliber. A, Representative electron micrographs used to assess axon g-ratio in ∼P90 Ube3am+/p+ and Ube3am−/p+ mice. Scale bar, 0.18 μm. B, Quantification of mean axon g-ratio. C, Plots of axon g-ratio versus diameter fit with a linear function. D, Representative electron micrographic montages of the corpus callosum used to measure the cross-sectional area and packing density of myelinated axons in ∼P90 Ube3am+/p+ and Ube3am−/p+ mice. Scale bar, 2 μm. E, Quantification of the cross-sectional area of myelinated axons. F, Distribution of the diameters of myelinated axons (logarithmic scale). G, Quantification of total axon density. n = 6 mice for each genotypic group. Data represent mean ± SEM, *p ≤ 0.05, **p ≤ 0.01, ***p ≤ 0.001, ****p ≤ 0.0001.
Figure 7.
Figure 7.
Myelinated callosal axon diameter (linear scale). A, B, Histograms of myelinated callosal axons analyzed in g-ratio (A, replotting of Fig. 6C diameter data) and axon caliber analyses (B, replotting of Fig. 6F diameter data). Left panels indicate the percentage of axons distributed among bins of the given diameter ranges. Right panels display the same data normalized to wild-type (Ube3am+/p+) values. n = 6 mice for each genotypic group. Data represent mean ± SEM, *p ≤ 0.05, **p ≤ 0.01, ***p ≤ 0.001, ****p ≤ 0.0001.
Figure 8.
Figure 8.
Analysis of unmyelinated callosal axon caliber in adult Ube3am−/p+ mice. A, Quantification of the cross-sectional area of unmyelinated axons. B, Distribution of the diameters of unmyelinated axons (logarithmic scale). C, Left, Percentage of unmyelinated axons in the corpus callosum distributed among bins of the given diameter ranges. Right, Same data normalized to wild-type (Ube3am+/p+) values. n = 6 mice for each genotypic group. Data represent mean ± SEM.
Figure 9.
Figure 9.
Packing density of cortical neurons is increased in adult Ube3am−/p+ mice. A, B, Immunostaining for the neuronal marker NEUN with DAPI nuclear counterstaining in primary somatosensory cortex of ∼P90 Ube3am+/p+ (A) and Ube3am−/p+ (B) mice. Scale bars, 200 μm for far-left panels, 175 μm for representative counting strips, and 18 μm for zoomed images of L5 and L2/3. CG, Quantification of total neuronal density (C), L1–4 neuronal density (D), L5–6 neuronal density (E), glial density (F), and total cell density (G). n = 3 mice for each genotypic group. Data represent mean ± SEM, *p ≤ 0.05.
Figure 10.
Figure 10.
Reduced axon caliber correlates with deficits in sciatic nerve conduction in adult Ube3am−/p+ mice. A, Representative electron micrographs of the sciatic nerve from ∼P90 Ube3am+/p+ and Ube3am−/p+ mice. Scale bar, 6.4 μm. B, Quantification of the cross-sectional area of myelinated axons. C, Distribution of the diameters of myelinated axons (logarithmic scale). D, Schematic for ex vivo recording of sciatic nerve conduction. E, Averaged compound action potential for each genotypic group (amplitude-normalized). Dashed lines indicate peak of averaged compound action potentials. Scale bars, 1 ms and 100 μs (inset). FH, Quantification of conduction velocity (F), rise time (G), and rise slope (H) for compound action potentials conducted by myelinated Aαβ fibers. n = 6 mice for each genotypic group. Data represent mean ± SEM, *p ≤ 0.05, **p ≤ 0.001, ****p ≤ 0.001.
Figure 11.
Figure 11.
Analysis of g-ratio and diameter (linear scale) of myelinated axons in the sciatic nerve of adult Ube3am−/p+ mice. A, Quantification of mean axon g-ratio. B, Plots of axon g-ratio versus diameter, fit with a linear function. C, Axon diameter histograms, linear scale (replotting of Fig. 10C diameter data). Left panels indicate the percentage of axons distributed among bins of the given diameter ranges. Right panels display the same data normalized to wild-type (Ube3am+/p+) values. n = 6 mice for each genotypic group. Data represent mean ± SEM, **p ≤ 0.01.

References

    1. Avants BB, Epstein CL, Grossman M, Gee JC (2008) Symmetric diffeomorphic image registration with cross-correlation: evaluating automated labeling of elderly and neurodegenerative brain. Med Image Anal 12:26–41. 10.1016/j.media.2007.06.004 - DOI - PMC - PubMed
    1. Bamji SX, Shimazu K, Kimes N, Huelsken J, Birchmeier W, Lu B, Reichardt LF (2003) Role of beta-catenin in synaptic vesicle localization and presynaptic assembly. Neuron 40:719–731. 10.1016/S0896-6273(03)00718-9 - DOI - PMC - PubMed
    1. Bond J, Roberts E, Mochida GH, Hampshire DJ, Scott S, Askham JM, Springell K, Mahadevan M, Crow YJ, Markham AF, Walsh CA, Woods CG (2002) ASPM is a major determinant of cerebral cortical size. Nat Genet 32:316–320. 10.1038/ng995 - DOI - PubMed
    1. Budin F, Hoogstoel M, Reynolds P, Grauer M, O'Leary-Moore SK, Oguz I (2013) Fully automated rodent brain MR image processing pipeline on a Midas server: from acquired images to region-based statistics. Front Neuroinform 7:15. 10.3389/fninf.2013.00015 - DOI - PMC - PubMed
    1. Burette AC, Judson MC, Burette S, Phend KD, Philpot BD, Weinberg RJ (2017) Subcellular organization of UBE3A in neurons. J Comp Neurol 525:233–251. 10.1002/cne.24063 - DOI - PMC - PubMed

Publication types

Substances