. 2017 Sep;58(9):1822-1833.
doi: 10.1194/jlr.M076141. Epub 2017 Jun 29.

Secretory phospholipase A2 group IIA modulates insulin sensitivity and metabolism

Affiliations

Secretory phospholipase A2 group IIA modulates insulin sensitivity and metabolism

Michael S Kuefner et al. J Lipid Res. 2017 Sep.

Abstract

Secretory phospholipase A2 group IIA (PLA2G2A) is a member of a family of secretory phospholipases that have been implicated in inflammation, atherogenesis, and antibacterial actions. Here, we evaluated the role of PLA2G2A in the metabolic response to a high fat diet. C57BL/6 (BL/6) mice do not express PLA2g2a due to a frameshift mutation. We fed BL/6 mice expressing the human PLA2G2A gene (IIA+ mice) a fat diet and assessed the physiologic response. After 10 weeks on the high fat diet, the BL/6 mice were obese, but the IIA+ mice did not gain weight or accumulate lipid. The lean mass in chow- and high fat-fed IIA+ mice was constant and similar to the BL/6 mice on a chow diet. Surprisingly, the IIA+ mice had an elevated metabolic rate, which was not due to differences in physical activity. The IIA+ mice were more insulin sensitive and glucose tolerant than the BL/6 mice, even when the IIA+ mice were provided the high fat diet. The IIA+ mice had increased expression of uncoupling protein 1 (UCP1), sirtuin 1 (SIRT1), and PPARγ coactivator 1α (PGC-1α) in brown adipose tissue (BAT), suggesting that PLA2G2A activates mitochondrial uncoupling in BAT. Our data indicate that PLA2G2A has a previously undiscovered impact on insulin sensitivity and metabolism.

Keywords: hepatic steatosis; high fat diet; insulin resistance; obesity.


Figures

Fig. 1.
Fig. 1.
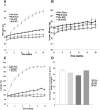
Weight gain and body composition of IIA+ mice on high fat diets. BL/6 and IIA+ mice were placed on chow diet or HFD for 10 weeks, as described in the Materials and Methods. A: The weight gain (grams) of the mice in the four groups was assessed on a weekly basis. B, C: MRI analysis was performed weekly and used to determine the lean mass and percent body fat. D: The average kilocalories consumed per mouse per gram of body weight were calculated from the food intake and the calorie content of the various diets. In all groups, there were 10–12 mice. The differences in the various time points were determined by two-way ANOVA, using genotype and diet as two separate factors.
Fig. 2.
Fig. 2.
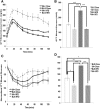
Metabolic analysis and activity of IIA+ mice on the high fat diet. After 10 weeks on the chow diet or HFD, mice were placed individually in CLAM chambers and their metabolism was assessed with respect to fat free mass (FFM). A: VO2 consumption was measured as milliliters per hour of O2 consumption over a 24 h period. B: Body heat production was expressed as calories per hour. C: RER was determined for all four groups of mice. D: Activity was determined by the number of beam breaks in both the light and dark cycles and is expressed as ambulatory movement. Each assessment is the average of measurements from 12 animals. Differences between groups were determined by two-way ANOVA, using genotype and diet as two separate factors. *P < 0.05, **P < 0.01, ***P < 0.001.
Fig. 3.
Fig. 3.
Glucose and insulin tolerance in IIA+ mice on the high fat diet. A: GTTs were conducted on all the mice in week 11 of the diet study, as described in the Materials and Methods. The blood glucose was measured at 15 min intervals. Each time point is the average of 11–15 mice. B: The total blood glucose from all time points is shown. C: ITTs were conducted on all the mice in week 12 of the diet study, as described in the Materials and Methods. The blood glucose was measured at 15 min intervals following insulin injection. Each time point is the average of seven to nine mice. D: Total blood glucose for all time points in the ITT is shown. Differences in the glucose levels were determined by the t-test. *P < 0.05, **P < 0.01, ***P < 0.001.
Fig. 4.
Fig. 4.
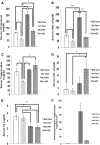
Blood lipids in IIA+ mice. At the time of euthanization, serum was collected from the mice and blood lipids and thyroid hormone (T4) were measured at the University of Tennessee endocrinology laboratory. A: Cholesterol was measured as milligrams per deciliter of serum. B: Triglycerides were assessed as milligrams per deciliter of serum. C: HDLs were measured as milligrams per deciliter of serum. D: LDLs were measured as milligrams per deciliter of serum. E: T4s were measured as micrograms per deciliter of serum. F: Hepatic triglycerides were measured. Each point is the average of lipids from five animals. The data were analyzed by t-test. *P < 0.05, **P < 0.01, ***P < 0.001.
Fig. 5.
Fig. 5.
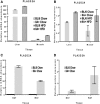
Expression of PLA2G2A in various tissues. RNA and proteins were collected from mice at the end of the feeding period and PLA2G2A abundance was determined via RT-PCR or Western blot. A: PLA2G2A gene expression from livers and muscle of mice on either chow diet or HFD. B: PLA2G2A protein expression from livers of chow diet or HFD mice. C: PLA2G2A gene expression from BAT and WAT of mice fed only chow diet. D: PLA2G2A protein expression from BAT and WAT of mice fed only chow diet.
Fig. 6.
Fig. 6.
Expression of metabolic genes in livers of IIA+ mice. RNA was collected from the livers at the end of the feeding period. The data are expressed as relative mRNA abundance. ACC1 (A), SREBP-1c (B), CPT1a (C), PGC-1α (D), SIRT1 (E). Each point is the average of mRNA from four animals. The data were analyzed by t-test. *P < 0.05, ***P < 0.001.
Fig. 7.
Fig. 7.
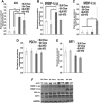
Changes in metabolic factors in livers of IIA+ mice. Proteins were collected from the livers at the end of the feeding period and the abundance of various proteins was analyzed by Western blot. Representative Western blots are shown and the data was quantified. ACC1 (A), precursor SREBP-1c (B), nuclear SREBP-1c (C), PGC-1α (D), SIRT1 (E), representative blots are shown (F). The data are expressed as relative protein abundance. Each point is the average of Western data blot from four animals. The data were analyzed by t-test. *P < 0.05, **P < 0.01, ***P < 0.001.
Fig. 8.
Fig. 8.
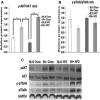
Alterations in insulin signaling pathways in IIA+ mice. Proteins were collected from the livers at the end of the feeding period and the abundance of various kinases was analyzed by Western blot. Kinase abundance was measured and the ratio of phospho-kinase to kinase is shown. pAkt/Akt (A), pS6K/S6K (B), representative Western blots are shown (C). Each point is the average of proteins from four animals. The data were analyzed by t-test. *P < 0.05, **P < 0.01.
Fig. 9.
Fig. 9.
Increased mitochondrial uncoupling in IIA+ mice on chow-fed diet. RNA and proteins were collected from the BAT of BL/6 and IIA+ mice after a 10 week feeding period. A: The relative mRNA levels of Ucp1, Sirt1, and Ppargc1a are shown. B: The relative protein abundance of UCP1, SIRT1, and PGC-1α are shown. C: The Western blots from the BAT are shown. Each point is the average of mRNA/protein from four animals. Data were analyzed by t-test. *P < 0.05, **P < 0.01, ***P < 0.001.

Similar articles

Cited by

References

    1. Lambeau G., and Gelb M. H.. 2008. Biochemistry and physiology of mammalian secreted phospholipases A2. Annu. Rev. Biochem. 77: 495–520. - PubMed
    1. Murakami M., Sato H., Miki Y., Yamamoto K., and Taketomi Y.. 2015. A new era of secreted phospholipase A(2). J. Lipid Res. 56: 1248–1261. - PMC - PubMed
    1. Dennis E. A., Cao J., Hsu Y. H., Magrioti V., and Kokotos G.. 2011. Phospholipase A2 enzymes: physical structure, biological function, disease implication, chemical inhibition, and therapeutic intervention. Chem. Rev. 111: 6130–6185. - PMC - PubMed
    1. Kudo I., and Murakami M.. 2002. Phospholipase A2 enzymes. Prostaglandins Other Lipid Mediat. 68–69: 3–58. - PubMed
    1. Murakami M., Taketomi Y., Sato H., and Yamamoto K.. 2011. Secreted phospholipase A2 revisited. J. Biochem. 150: 233–255. - PubMed

Publication types