

Glycosylation of KEAP1 links nutrient sensing to redox stress signaling
- PMID: 28663241
- PMCID: PMC5538768
- DOI: 10.15252/embj.201696113
Glycosylation of KEAP1 links nutrient sensing to redox stress signaling
Abstract
O-GlcNAcylation is an essential, nutrient-sensitive post-translational modification, but its biochemical and phenotypic effects remain incompletely understood. To address this question, we investigated the global transcriptional response to perturbations in O-GlcNAcylation. Unexpectedly, many transcriptional effects of O-GlcNAc transferase (OGT) inhibition were due to the activation of NRF2, the master regulator of redox stress tolerance. Moreover, we found that a signature of low OGT activity strongly correlates with NRF2 activation in multiple tumor expression datasets. Guided by this information, we identified KEAP1 (also known as KLHL19), the primary negative regulator of NRF2, as a direct substrate of OGT We show that O-GlcNAcylation of KEAP1 at serine 104 is required for the efficient ubiquitination and degradation of NRF2. Interestingly, O-GlcNAc levels and NRF2 activation co-vary in response to glucose fluctuations, indicating that KEAP1 O-GlcNAcylation links nutrient sensing to downstream stress resistance. Our results reveal a novel regulatory connection between nutrient-sensitive glycosylation and NRF2 signaling and provide a blueprint for future approaches to discover functionally important O-GlcNAcylation events on other KLHL family proteins in various experimental and disease contexts.
Keywords: KLHL; OGT; KEAP1; NRF2; O‐GlcNAcylation.
© 2017 The Authors.
Figures
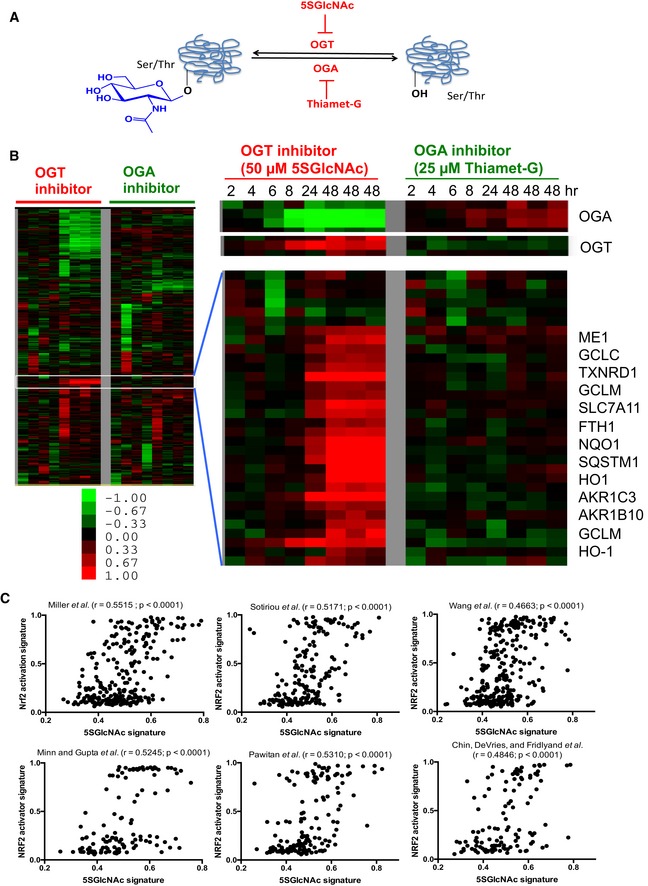
O‐GlcNAc is added onto serine (shown) or threonine residues of intracellular proteins by the glycosyltransferase OGT and removed by the glycoside hydrolase OGA. OGT and OGA are inhibited by the specific small molecules 5SGlcNAc and Thiamet‐G, respectively.
Heatmap of the global transcriptional response of MDA‐MB‐231 cells to the inhibition of OGT or OGA for the indicated time points. Heatmap of selected induced and repressed genes and gene clusters during OGT and OGA inhibitions are shown with several indicated gene names. The color bar indicates log2 (fold change); green: decreased expression (i.e., repression); red: increased expression (i.e., induction).
The gene expression signature of low OGT activity (i.e., 5SGlcNAc) shows positive correlation with the NRF2 activation signature when projected into six different tumor datasets. r is the Pearson's correlation coefficient. The P‐values (two‐tailed) were derived from the Pearson's correlation coefficient as performed by GraphPad Prism 5.0.
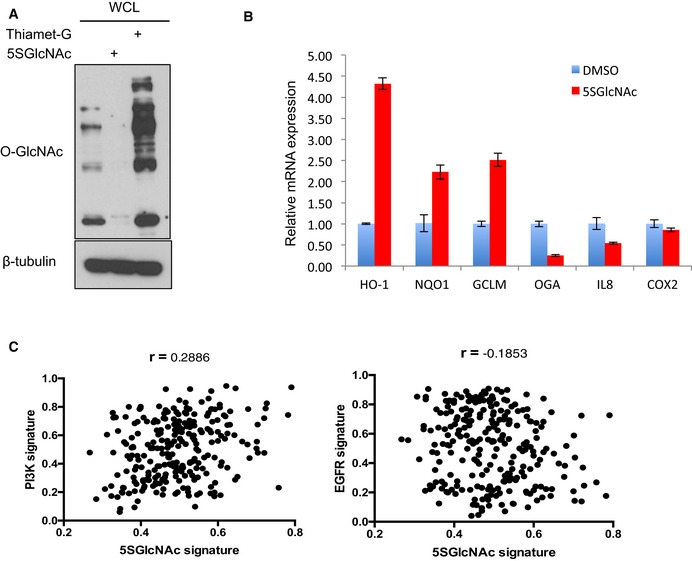
OGT and OGA inhibitors reduced and increased, respectively, global O‐GlcNAc levels. MDA‐MB‐231 cells were treated with 50 μM 5SGlcNAc or 25 μM Thiamet‐G for 24 h and WCLs were analyzed by Western blots.
qPCR validation of indicated up‐ and downregulated genes from microarray data. MDA‐MB‐231 cells were treated with DMSO vehicle or 50 μM 5SGlcNAc for 48 h and extracted mRNA was analyzed by qPCR (normalized to β‐actin). n = 3, error bars represent standard deviation.
Lack of correlation between low‐OGT activity (i.e., 5SGlcNAc) and PI3K or EGFR signaling gene expression signatures when projected into the Miller breast tumor dataset. r = Pearson's correlation coefficient.
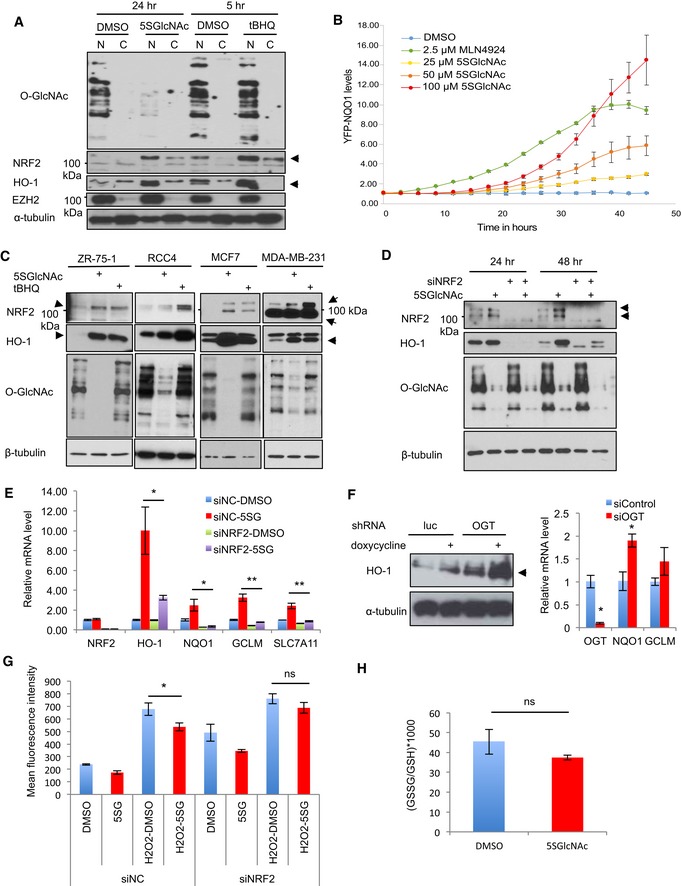
5SGlcNAc increased the nuclear level of NRF2 and HO‐1 proteins, similar to the known NRF2 activator tBHQ. MDA‐MB‐231 cells were treated with 50 μM 5SGlcNAc for 24 h or 25 μM tBHQ for 5 h. Lysates were separated into cytosolic and nuclear fractions for Western blot by indicated antibodies. EZH2 and α‐tubulin are loading controls for nuclear and cytosolic fractions, respectively. Arrows indicate the protein of interest.
5SGlcNAc treatment increased the levels of YFP‐NQO1. H1299 cells expressing YFP‐NQO1 were treated with 25, 50, or 100 μM 5SGlcNAc or 2.5 μM MLN4924 (NRF2 activator, positive control) and analyzed in real time for YFP levels using the IncuCyte platform. Data are from one experiment with five technical replicates and are presented as mean ± SD. Data were reproduced in a biological replicate with five technical replicates.
5SGlcNAc increased NRF2 and HO‐1 protein levels and reduced global O‐GlcNAcylation in ZR‐75‐1, RCC4, MCF7, and MDA‐MB‐231 cells. Indicated cell lines were treated with 50 μM 5SGlcNAc or tBHQ (50 μM for ZR‐75‐1 and RCC4; 25 μM for MCF7 and MDA‐MB‐231) for 48 h and harvested for Western blot analysis by indicated antibodies. Arrows indicate the induced protein of interest.
Silencing NRF2 by siRNAs abolishes 5SGlcNAc‐triggered HO‐1 induction. MCF7 cells were treated with non‐targeting control siRNA or siNRF2 for 24 h and incubated with 50 μM 5SGlcNAc for additional 24 or 48 h before harvesting and Western blotting. Arrows indicate the protein of interest.
MDA‐MB‐231 cells were transfected with either control (siNC) or siNRF2 siRNAs for 24 h and then treated with 50 μM 5SGlcNAc for additional 48 h. Relative gene expression levels were assessed by quantitative PCR (qPCR) and normalized to β‐actin mRNA and the DMSO/siNC group. n = 3, error bars represent standard deviations.
Left panel: The level of HO‐1 protein in MDA‐MB‐231 before and after doxycycline‐induced shRNA‐mediated silencing of luciferase (control) or OGT. Arrows indicate the protein of interest. Right panel: OGT depletion by siRNA increases NQO1 and GCLM mRNA. qPCR measurement of the indicated mRNAs in MDA‐MB‐231 transfected with control or OGT‐targeting siRNA for 24 h is shown (normalized to β‐actin mRNA). n = 3, error bars represent standard deviations.
MDA‐MB‐231 cells were transfected with either siNC or siNRF2 siRNAs for 24 h and then treated with 87.5 μM 5SGlcNAc (5SG, 48 h) or H2O2 (882 μM, 1 h). Then, cells were incubated with H2‐DCFDA dye and relative ROS levels were measured by flow cytometry. n = 3, error bars represent standard deviations.
MDA‐MB‐231 cells were treated with DMSO or 50 μM 5SGlcNAc (48 h), and GSSG/GSH ratios were measured by MS. n = 3, error bars represent standard deviations.
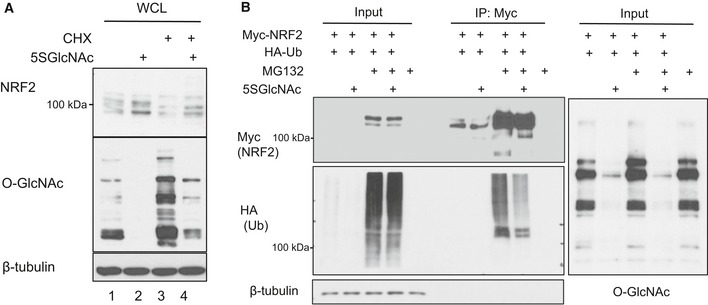
MCF7 cells were treated with cycloheximide (CHX, 25 μg/ml) for 1 h to block translation and then 5SGlcNAc (50 μM) for additional 10 h. Whole‐cell lysates (WCLs) were analyzed for NRF2 protein and global O‐GlcNAcylation by Western blot.
Polyubiquitination of NRF2 is decreased upon OGT inhibition. 293T cells were transfected with MYC‐NRF2 and/or HA‐ubiquitin (Ub) as indicated for 24 h and then treated with vehicle or 50 μM 5SGlcNAc for additional 48 h, with or without MG132 (10 μM, 3 h). Lysates were analyzed by IP and Western blot.
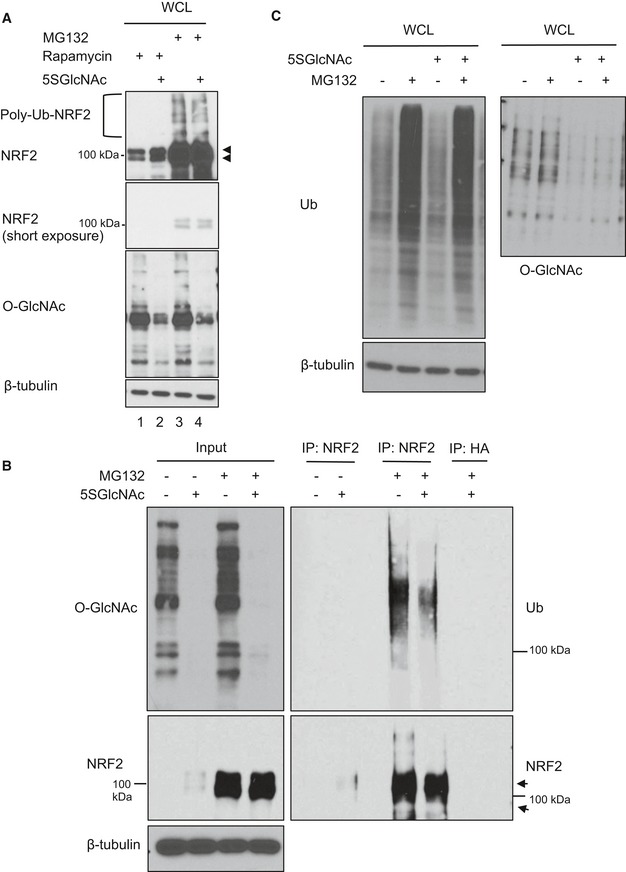
MCF7 cells were treated with rapamycin (50 nM) for 1 h and then 5SGlcNAc (50 μM) for additional 8 h. Then, MG132 (10 μM) was added 2 h before harvesting (total experimental time: 9 h). WCLs were analyzed by Western blot. Arrows indicate NRF2.
5SGlcNAc reduced the ubiquitination of endogenous NRF2 in MCF7 cells. MCF7 cells were treated with 50 μM 5SGlcNAc (48 h) and 10 μM MG132 (6 h), and WCLs were analyzed by IP/Western blot. Arrows indicate NRF2.
5SGlcNAc does not affect global poly ubiquitination levels. MDA‐MB‐231 cells were treated with 25 μM 5SGlcNAc for 45 h and 10 μM MG132 for additional 3 h. WCLs were analyzed by Western blots.
- A, B
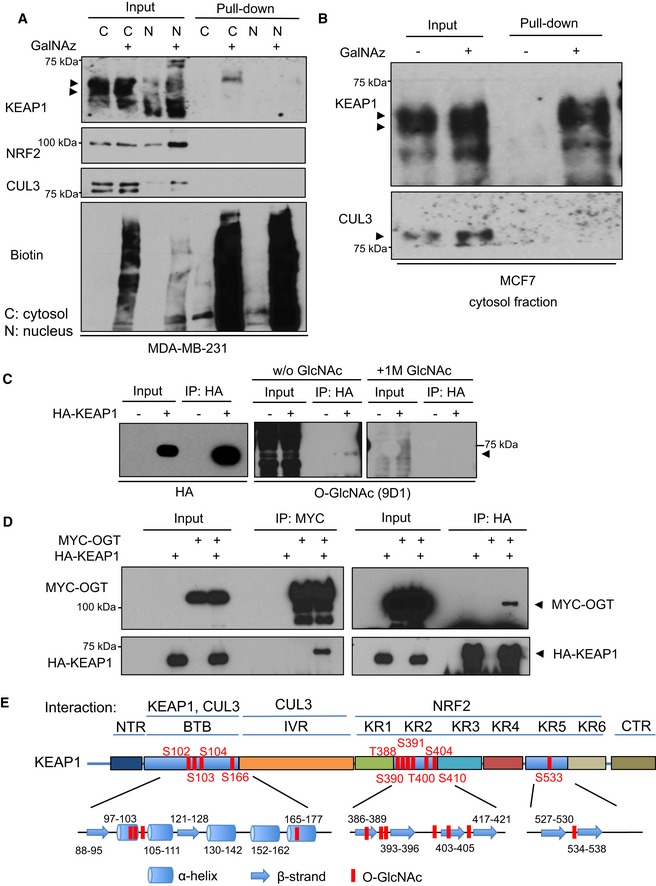
MDA‐MB‐231 cells (A) or MCF7 cells (B) were incubated with DMSO or 100 μM GalNAz for 24 h and then separated into cytosolic (C) and nuclear (N) fractions. Fractions were subjected to a CuAAC reaction with an alkyne‐biotin probe and precipitated to remove unreacted probe. Then, biotin‐labeled proteins were affinity‐purified via NeutrAvidin bead pull‐down and analyzed by Western blot. Arrows indicate the protein of interest.
- C
GlcNAc competition assay. 293T cells transfected with HA‐KEAP1 were lysed and analyzed by IP and Western blot. GlcNAc competition (a specificity control) was performed by pre‐incubating the O‐GlcNAc antibody with 1 M free GlcNAc before blotting. Blots were performed simultaneously with equal sample loading and chemiluminescence exposure time. Arrows indicate the protein of interest.
- D
OGT interacts with KEAP1 in human cells. 293T cells were transfected with MYC‐OGT and/or HA‐KEAP1 constructs as indicated for 48 h, and lysates were analyzed by IP/Western blot. Arrows indicate the protein of interest.
- E
Eleven candidate O‐GlcNAcylated residues of KEAP1, identified by MS, are shown in the context of protein domains, secondary structure elements, and selected known interacting partners of KEAP1. NTR, N‐terminal region; BTB, broad complex/tramtrack/bric‐à‐brac domain; IVR, intervening region; KR, Kelch repeat domain; CTR, C‐terminal region.
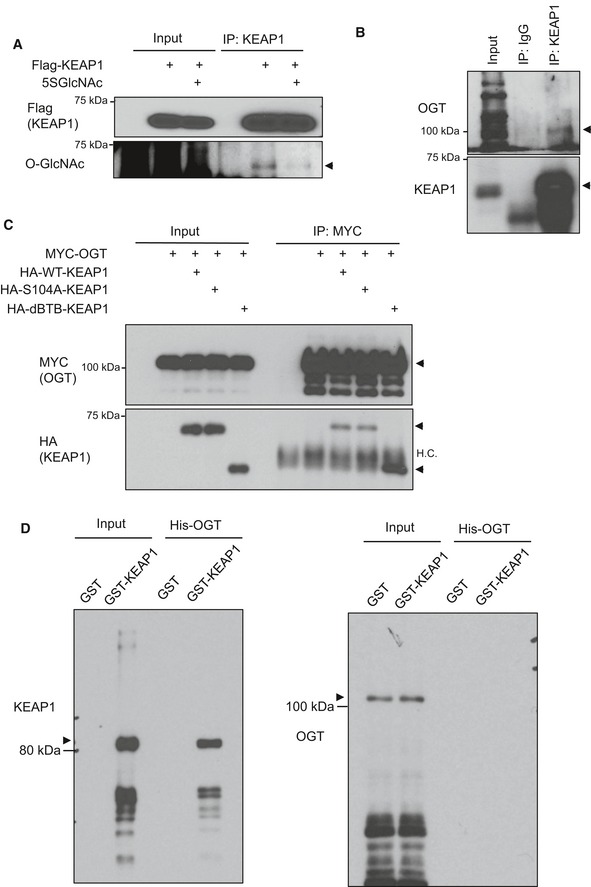
O‐GlcNAcylation of KEAP1 is reduced upon 5SGlcNAc treatment. H838 cells were transfected with Flag‐KEAP1 and then treated with DMSO or 50 μM 5SGlcNAc for 48 h. WCLs were analyzed by IP/Western blot. Arrow indicates KEAP1.
KEAP1 associates with OGT in human cells. Endogenous KEAP1 was IP‐ed from 293T lysates and blotted with antibodies against OGT and KEAP1 (arrows).
Interaction between OGT and KEAP1 mutants. The indicated KEAP1 constructs and/or MYC‐OGT were transfected into 293T cells (48 h), and WCLs were analyzed by IP/Western blot. Arrows indicate the proteins of interest. HC: IP‐ing antibody heavy chain.
Purified GST‐KEAP1 and His‐OGT do not interact in vitro. Recombinant GST‐KEAP1 and His‐OGT were purified individually from Escherichia coli, mixed, and analyzed by glutathione agarose pull‐down and Western blot. Arrows indicate the proteins of interest.
- A
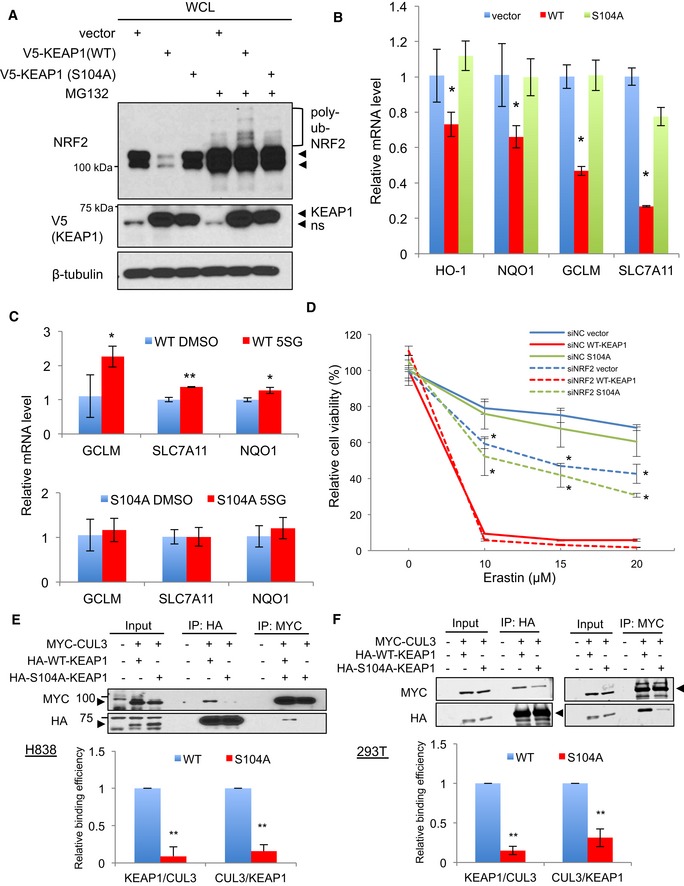
The KEAP1 S104A mutant has reduced ability to target NRF2 for proteasome‐dependent destruction. WCLs from H838 cells stably expressing vector, wild‐type KEAP1, or the KEAP1 S104A mutant were treated with vehicle or 10 μM MG132 for 3 h, and lysates were analyzed by Western blot. ns, non‐specific band. The arrowheads indicate NRF2 protein doublet in the NRF2 blot. In the V5 blot, the upper arrowhead is KEAP1 protein, the lower arrowhead is a non‐specific band (ns).
- B
KEAP1 S104 is required to suppress NRF2 transcriptional activity. RNA collected from stable H838 cells was analyzed by qPCR (normalized to β‐actin mRNA). n = 3, error bars represent standard deviations; P‐values were calculated by Student's t‐test; *P < 0.05.
- C
Reconstitution of H838 cells with wild‐type KEAP1, but not S104A KEAP1, restores induction of NRF2 targets by 5SGlcNAc. Stable H838 cells were treated with 50 μM 5SGlcNAc for 48 h, and mRNAs were analyzed by qPCR (normalized to β‐actin mRNA) and compared to DMSO treatment. n = 3 for wild type; n = 7 for S104A. Error bars represent standard deviations; P‐values were calculated by Student's t‐test, *P < 0.05, **P < 0.001.
- D
Wild‐type, but not S104A, KEAP1 sensitizes H838 cells to erastin‐induced cell death in a NRF2‐dependent manner. Stable H838 cells were transfected with either siNC (non‐targeting control) or siNRF2 for 24 h and then treated with erastin as indicated for additional 48 h. Cell viability was measured by CellTiter‐Glo assay and normalized to the siNC/DMSO control of each stable cell line. n = 3, P‐values were calculated by Student's t‐test (siNC vector versus siNRF2 vector or siNC S104A versus siNRF2 S104A), *P < 0.05.
- E, F
The KEAP1 S104A mutant exhibits reduced interaction with CUL3. H838 (E) or 293T (F) cells were transfected with the indicated constructs for 32 or 48 h, respectively, and lysates were analyzed by IP/fluorescent Western blot. Quantification of the KEAP1–CUL3 interaction was performed by the ImageJ (E) or LI‐COR (F) software platform and is given in the lower panels. n = 3, error bars represent standard deviation; P‐values were calculated by Student's t‐test, **P < 0.001.
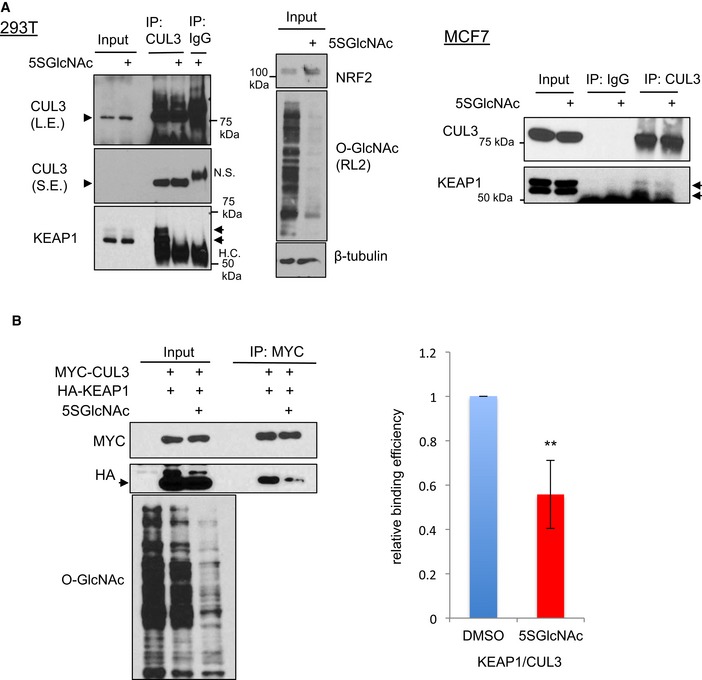
5SGlcNAc reduces the interaction between endogenous KEAP1 and CUL3 in 293T and MCF7 cells. 293T (left) or MCF7 (right) cells were treated with 50 μM 5SGlcNAc (24 h), and WCLs were analyzed by IP/Western blot. Arrowhead indicates CUL3, arrow indicates KEAP1.
5SGlcNAc reduces the interaction between expressed CUL3 and KEAP1. 293T cells were transfected as indicated for 24 h and then treated with 50 μM 5SGlcNAc for additional 48 h. WCLs were analyzed by IP/Western blot. n = 3, error bars represent standard deviation, and P‐values were calculated by Student's t‐test, **P < 0.01. Arrow indicates HA‐tagged KEAP1.
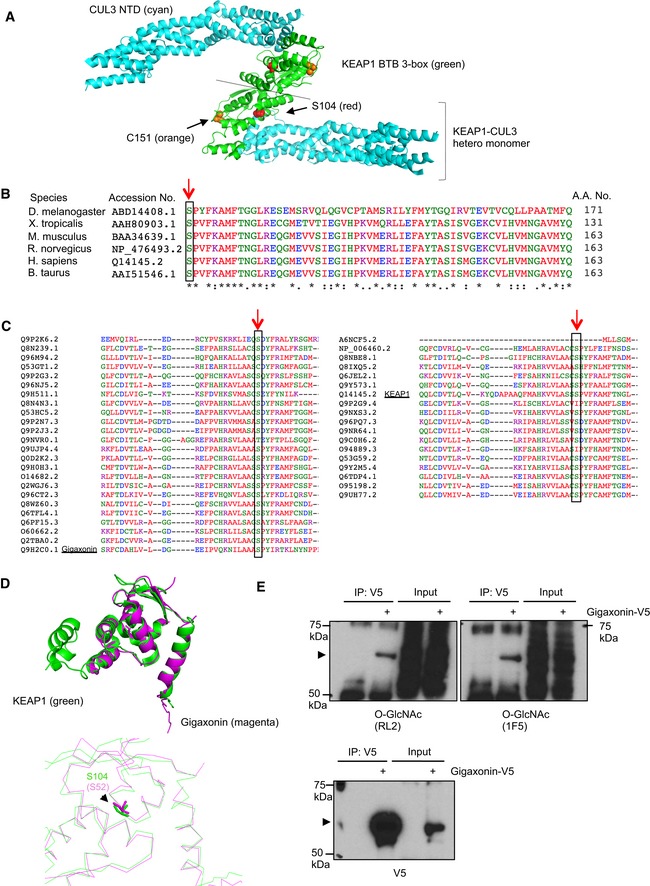
Modeling of the KEAP1 BTB 3‐box (green) and CUL3 (cyan) NTD hetero‐tetramer complex, based on the recently reported KEAP1–CUL3 heterodimer complex (PDB: 5NLB). S104 of KEAP1 is shown in red. C151 of KEAP1 is shown in orange.
Amino acid sequence alignment of KEAP1 orthologs in different species reveals that S104 (red arrow) is highly conserved across evolution.
S104 of KEAP1 is conserved in most human KLHL family proteins. Amino acid sequence alignment of 42 human KLHL proteins. The cognate residues of KEAP1 S104 are indicated by red arrows and black rectangles.
Structural alignments of KEAP1 (green, PDB: 5NLB) and gigaxonin (magenta, PDB: 2PPI) BTB domains. KEAP1 S104 and gigaxonin S52 are nearly superimposable (bottom panel).
Gigaxonin‐V5 from stably transduced 293T cells was analyzed by IP/Western blot. Arrowheads indicate V5‐tagged gigaxonin.
- A
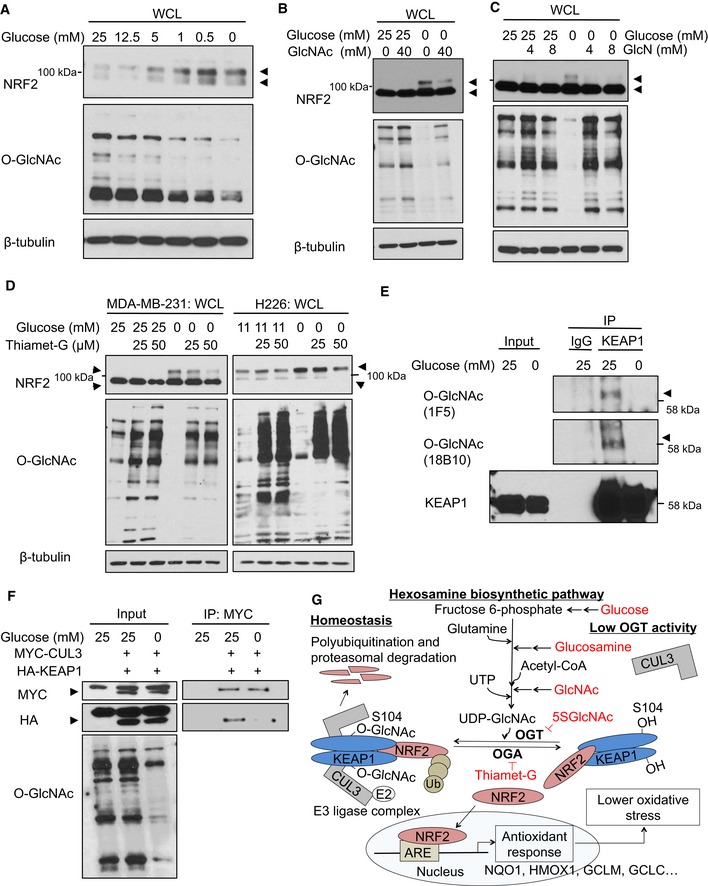
NRF2 protein levels anti‐correlate with both glucose levels and global O‐GlcNAcylation. MCF7 cells were incubated with the indicated glucose concentrations for 12 h, and WCLs were analyzed by Western blot. Arrows indicate NRF2.
- B, C
GlcNAc (B) or GlcN (C) supplementation suppresses NRF2 induction by glucose deprivation. MDA‐MB‐231 cells were incubated with the indicated levels of glucose and GlcNAc (B) or GlcN (C) for 16 h, and WCLs were analyzed by Western blot. Arrows indicate NRF2.
- D
Blocking OGA activity abolishes NRF2 induction by glucose deprivation. MDA‐MB‐231 or H226 cells were treated with Thiamet‐G for 8 or 24 h, respectively, and then subjected to glucose deprivation for additional 16 or 24 h, respectively. WCLs were analyzed by Western blot. Arrows indicate NRF2.
- E
Glucose deprivation reduces KEAP1 O‐GlcNAcylation. MDA‐MB‐231 cells were incubated with 25 or 0 mM glucose for 16 h and lysates were analyzed by IP/Western blot. Arrow indicates O‐GlcNAcylated KEAP1.
- F
Glucose deprivation reduces the KEAP1–CUL3 interaction. MDA‐MB‐231 cells were transfected with HA‐KEAP1 and MYC‐CUL3 for 24 h and then subjected to the indicated glucose concentrations for additional 12 h. Lysates were analyzed by IP/Western blot. Arrow indicates overexpressed MYC‐CUL3 or HA‐KEAP1, respectively.
- G
Proposed model, in which nutrient‐sensitive KEAP1 S104 O‐GlcNAcylation promotes its productive interaction with CUL3 to mediate NRF2 ubiquitination and destruction. Please see text for details.
Similar articles
-
Cross-talk between two essential nutrient-sensitive enzymes: O-GlcNAc transferase (OGT) and AMP-activated protein kinase (AMPK).J Biol Chem. 2014 Apr 11;289(15):10592-10606. doi: 10.1074/jbc.M113.523068. Epub 2014 Feb 21. J Biol Chem. 2014. PMID: 24563466 Free PMC article.
-
Stress-sensing mechanisms and the physiological roles of the Keap1-Nrf2 system during cellular stress.J Biol Chem. 2017 Oct 13;292(41):16817-16824. doi: 10.1074/jbc.R117.800169. Epub 2017 Aug 24. J Biol Chem. 2017. PMID: 28842501 Free PMC article. Review.
-
O-GlcNAcylation promotes malignancy and cisplatin resistance of lung cancer by stabilising NRF2.Clin Transl Med. 2024 Oct;14(10):e70037. doi: 10.1002/ctm2.70037. Clin Transl Med. 2024. PMID: 39358921 Free PMC article.
-
Kelch-like ECH-associated protein 1 (KEAP1) differentially regulates nuclear factor erythroid-2-related factors 1 and 2 (NRF1 and NRF2).J Biol Chem. 2018 Feb 9;293(6):2029-2040. doi: 10.1074/jbc.RA117.000428. Epub 2017 Dec 18. J Biol Chem. 2018. PMID: 29255090 Free PMC article.
-
Beyond repression of Nrf2: An update on Keap1.Free Radic Biol Med. 2020 Sep;157:63-74. doi: 10.1016/j.freeradbiomed.2020.03.023. Epub 2020 Mar 28. Free Radic Biol Med. 2020. PMID: 32234331 Free PMC article. Review.
Cited by
-
Role of O-Linked N-Acetylglucosamine Protein Modification in Cellular (Patho)Physiology.Physiol Rev. 2021 Apr 1;101(2):427-493. doi: 10.1152/physrev.00043.2019. Epub 2020 Jul 30. Physiol Rev. 2021. PMID: 32730113 Free PMC article. Review.
-
Expression of messenger RNA encoding two cellular metabolic regulators, AMP-activated protein kinase (AMPK) and O-GlcNAc transferase (OGT), in channel catfish: Their tissue distribution and relationship with changes in food intake.Comp Biochem Physiol A Mol Integr Physiol. 2019 Sep;235:12-21. doi: 10.1016/j.cbpa.2019.04.023. Epub 2019 May 12. Comp Biochem Physiol A Mol Integr Physiol. 2019. PMID: 31091463 Free PMC article.
-
An evolving understanding of the S-glutathionylation cycle in pathways of redox regulation.Free Radic Biol Med. 2018 May 20;120:204-216. doi: 10.1016/j.freeradbiomed.2018.03.038. Epub 2018 Mar 23. Free Radic Biol Med. 2018. PMID: 29578070 Free PMC article. Review.
-
Asiatic acid ameliorates doxorubicin-induced cardiotoxicity by promoting FPN-mediated iron export and inhibiting ferroptosis.Acta Pharmacol Sin. 2025 Jan;46(1):81-95. doi: 10.1038/s41401-024-01367-9. Epub 2024 Aug 14. Acta Pharmacol Sin. 2025. PMID: 39143234
-
The Complex Genetic and Epigenetic Regulation of the Nrf2 Pathways: A Review.Antioxidants (Basel). 2023 Feb 3;12(2):366. doi: 10.3390/antiox12020366. Antioxidants (Basel). 2023. PMID: 36829925 Free PMC article. Review.
References
-
- Adam J, Hatipoglu E, O'Flaherty L, Ternette N, Sahgal N, Lockstone H, Baban D, Nye E, Stamp GW, Wolhuter K, Stevens M, Fischer R, Carmeliet P, Maxwell PH, Pugh CW, Frizzell N, Soga T, Kessler BM, El‐Bahrawy M, Ratcliffe PJ et al (2011) Renal cyst formation in Fh1‐deficient mice is independent of the Hif/Phd pathway: roles for fumarate in KEAP1 succination and Nrf2 signaling. Cancer Cell 20: 524–537 - PMC - PubMed
-
- Alam J, Wicks C, Stewart D, Gong P, Touchard C, Otterbein S, Choi AM, Burow ME, Tou J (2000) Mechanism of heme oxygenase‐1 gene activation by cadmium in MCF‐7 mammary epithelial cells. Role of p38 kinase and Nrf2 transcription factor. J Biol Chem 275: 27694–27702 - PubMed
-
- Boizot A, Talmat‐Amar Y, Morrogh D, Kuntz NL, Halbert C, Chabrol B, Houlden H, Stojkovic T, Schulman BA, Rautenstrauss B, Bomont P (2014) The instability of the BTB‐KELCH protein Gigaxonin causes Giant Axonal Neuropathy and constitutes a new penetrant and specific diagnostic test. Acta Neuropathol Commun 2: 47 - PMC - PubMed
-
- Bomont P, Cavalier L, Blondeau F, Ben Hamida C, Belal S, Tazir M, Demir E, Topaloglu H, Korinthenberg R, Tuysuz B, Landrieu P, Hentati F, Koenig M (2000) The gene encoding gigaxonin, a new member of the cytoskeletal BTB/kelch repeat family, is mutated in giant axonal neuropathy. Nat Genet 26: 370–374 - PubMed
Publication types
MeSH terms
Substances
Grants and funding
LinkOut - more resources
Full Text Sources
Other Literature Sources
Molecular Biology Databases
Miscellaneous
