. 2017 Jun 30;356(6345):1356-1362.
doi: 10.1126/science.aal4108.

A human-driven decline in global burned area

Affiliations

A human-driven decline in global burned area

N Andela et al. Science. .

Abstract

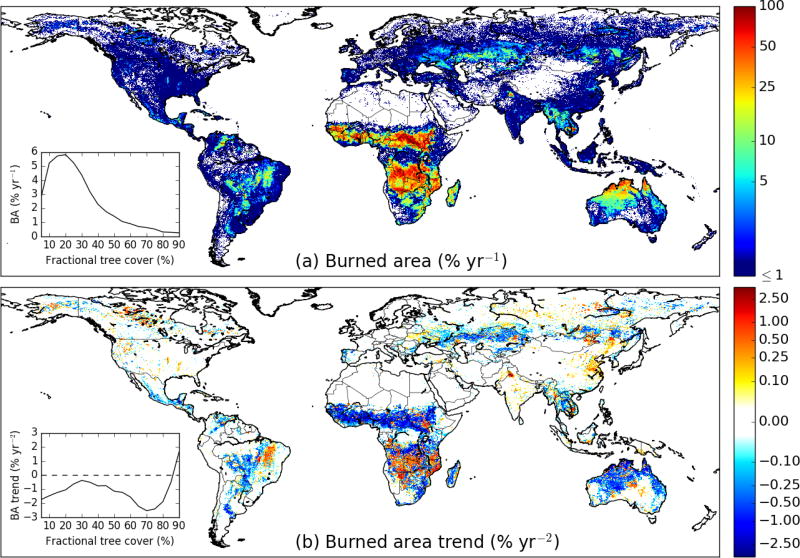
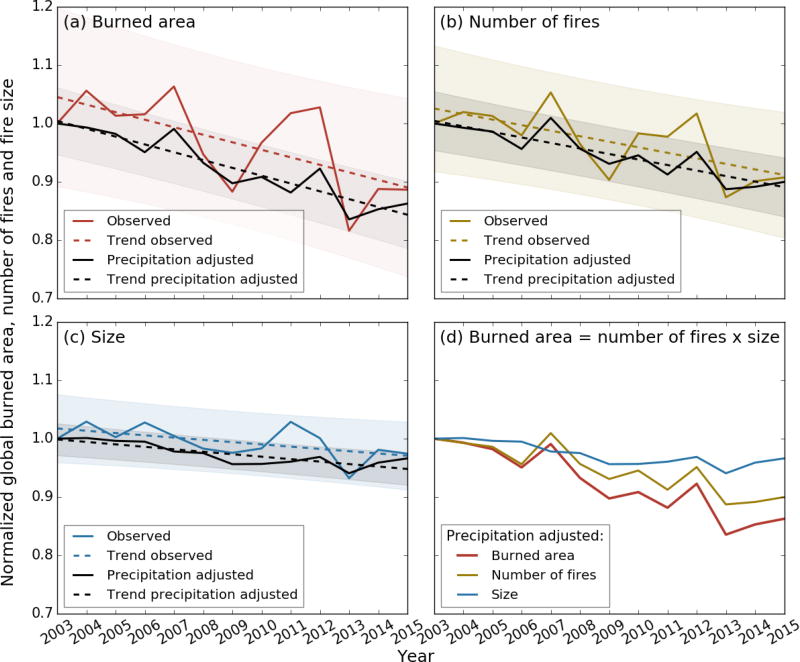
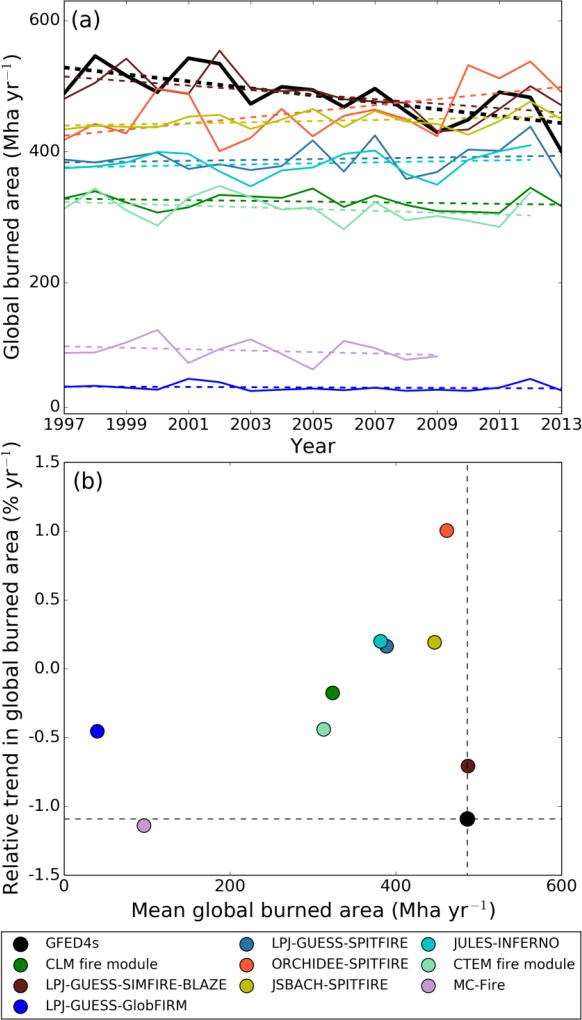
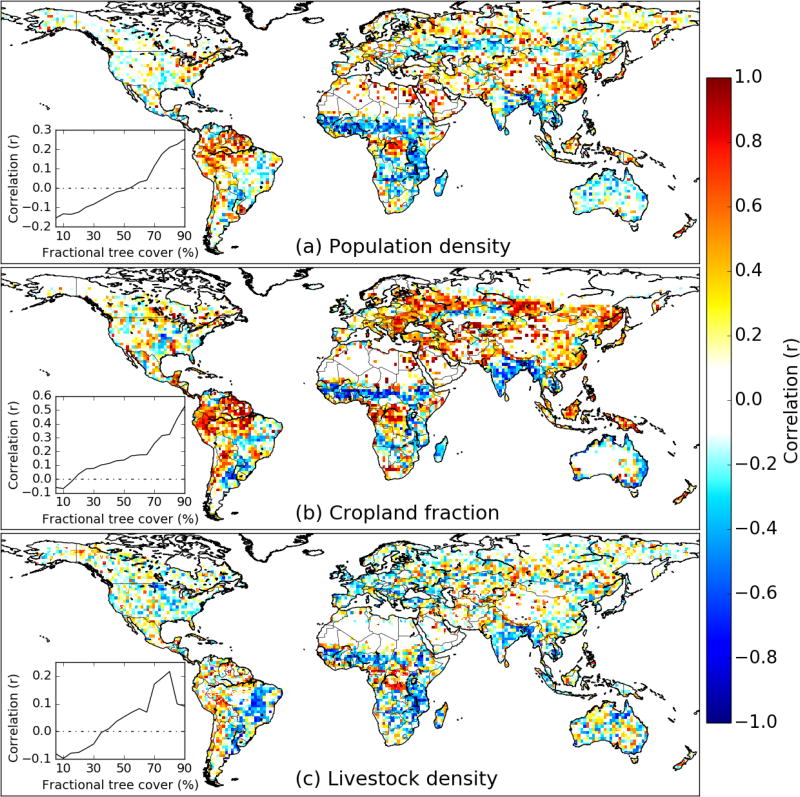
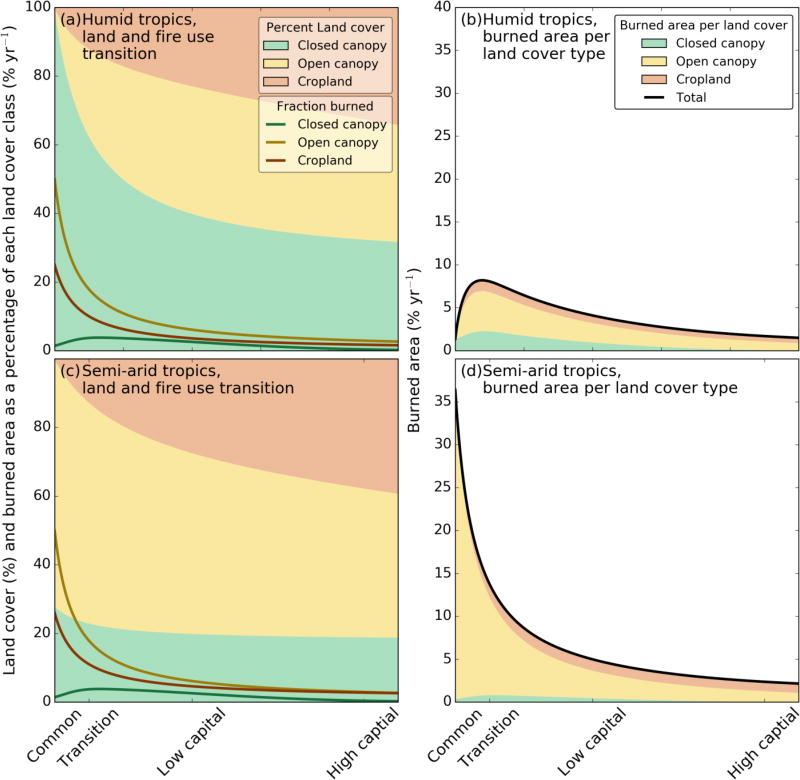
Fire is an essential Earth system process that alters ecosystem and atmospheric composition. Here we assessed long-term fire trends using multiple satellite data sets. We found that global burned area declined by 24.3 ± 8.8% over the past 18 years. The estimated decrease in burned area remained robust after adjusting for precipitation variability and was largest in savannas. Agricultural expansion and intensification were primary drivers of declining fire activity. Fewer and smaller fires reduced aerosol concentrations, modified vegetation structure, and increased the magnitude of the terrestrial carbon sink. Fire models were unable to reproduce the pattern and magnitude of observed declines, suggesting that they may overestimate fire emissions in future projections. Using economic and demographic variables, we developed a conceptual model for predicting fire in human-dominated landscapes.


Figures

Fig. 1
Fig. 1
Satellite observations of (a) mean annual burned area and (b) trends in burned area (GFED4s, 1998 - 2015) show a decline of fire activity across the world’s tropical and temperate grassland ecosystems and land use frontiers in the Americas and Southeast Asia. Line plots (inset) indicate global burned area and trend distributions by fractional tree cover (28).
Fig. 2
Fig. 2
A decrease in the number of fires was the primary driver of the global decline in burned area (MCD64A1). Normalized variation (2003 = 1) and linear trends in (a) burned area, (b) number of fires, and (c) mean fire size. Shading denotes 95% prediction intervals. Adjusting for precipitation-driven trends in burned area (28) isolated residual trends associated with other factors, including human activity. Panel (d) summarizes trends in global burned area, calculated as the product of the number and size of fires, after adjusting for the influence of precipitation. Regional trends in fire number and fire size are provided in Table 1, S1 and Fig. S7.
Fig. 3
Fig. 3
Comparison of burned area trends from the satellite observations (GFED4s) and prognostic fire models from FireMIP. (a) Time series of global burned area. (b) A comparison of global mean annual burned area versus the relative trend in global mean burned area from the observations and models. GFED4s observations are shown in black and FireMIP models with different colors. FireMIP model estimates were available from 1997 – 2013 for six models, from 1997 – 2012 for the CTEM fire module and JULES-INFERNO, and from 1997 – 2009 for MC-Fire. The FireMIP models are described in more detail in the Supporting Online Material and by Rabin et al. (28, 34, Table S3 and S4. Fig. S8).
Fig. 4
Fig. 4
Maps of the spatial correlation between burned area and (a) population density per km2, (b) fractional cropland area, and (c) livestock density per km2. Map panels indicate the spatial correlation between burned area (GFED4s) and human land use for the 36 0.25° pixels within each 1.5° grid cell. Line plots (inset) show the mean correlation as a function of fractional tree cover (28).
Fig. 5
Fig. 5
Conceptual model showing changes in fire use along the continuum from common land ownership to highly capitalized agricultural management on private lands. In humid tropical regions (a,b; precipitation ≥ 1200 mm yr−1), deforestation fires for agricultural expansion (a) lead to peak burned area during an early land use transition phase to more settled land uses (b). In the semi-arid tropics (c,d; precipitation 500–1200 mm yr−1), burned area is highest under common land ownership (d), as intact savanna and grazing lands allow for the spread of large fires. Conversion of savanna and grassland systems for more permanent agriculture drives a non-linear decline in burned area from landscape fragmentation and changing fire use for agricultural management. The conceptual model is based on the spatial distribution of burned area, land use, population, and GDP (28, Fig. S12 and S13). Similar patterns are observed across all continents, but absolute burned area differs as a function of culture, climate, and vegetation.

Comment in

References

    1. Bond WJ, Woodward FI, Midgley GF. The global distribution of ecosystems in a world without fire. New Phytol. 2005;165:525–537. - PubMed
    1. Crutzen PJ, Andreae M. Biomass burning in the tropics: Impact on atmospheric chemistry and biogeochemical cycles. Science. 1990;250:1669–1678. - PubMed
    1. Lelieveld J, Evans JS, Fnais M, Giannadaki D, Pozzer A. The contribution of outdoor air pollution sources to premature mortality on a global scale. Nature. 2015;525:367–371. - PubMed
    1. Bowman DMJS, et al. Fire in the Earth system. Science. 2009;324:481–484. - PubMed
    1. Scholes RJ, Archer SR. Tree-grass interactions in savannas. Annu. Rev. Ecol. Syst. 1997;28:517–544.

Publication types