

The Plasma and Serum Metabotyping of Hepatocellular Carcinoma in a Nigerian and Egyptian Cohort using Proton Nuclear Magnetic Resonance Spectroscopy
- PMID: 28663670
- PMCID: PMC5478965
- DOI: 10.1016/j.jceh.2017.03.007
The Plasma and Serum Metabotyping of Hepatocellular Carcinoma in a Nigerian and Egyptian Cohort using Proton Nuclear Magnetic Resonance Spectroscopy
Abstract
Background/aims: Previous studies have observed disturbances in the 1H nuclear magnetic resonance (NMR) blood spectral profiles in malignancy. No study has metabotyped serum or plasma of hepatocellular carcinoma (HCC) patients from two diverse populations. We aimed to delineate the HCC patient metabotype from Nigeria (mostly hepatitis B virus infected) and Egypt (mostly hepatitis C virus infected) to explore lipid and energy metabolite alterations that may be independent of disease aetiology, diet and environment.
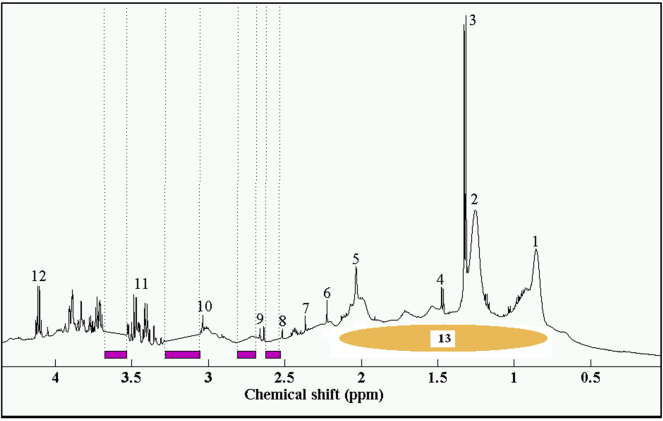
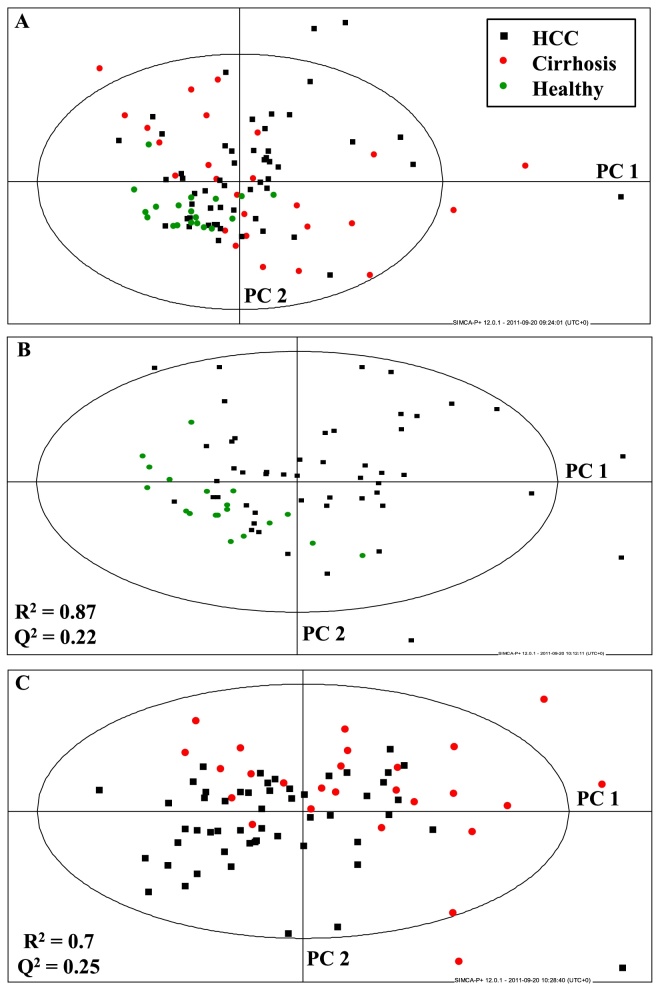
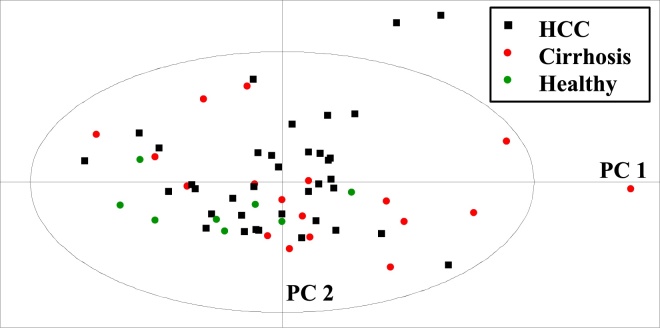
Methods: Patients with HCC (53) and cirrhosis (26) and healthy volunteers (19) were recruited from Nigeria and Egypt. Participants provided serum or plasma samples, which were analysed using 600 MHz 1H NMR spectroscopy with nuclear Overhauser enhancement spectroscopy pulse sequences. Median group spectra comparison and multivariate analysis were performed to identify regions of difference.
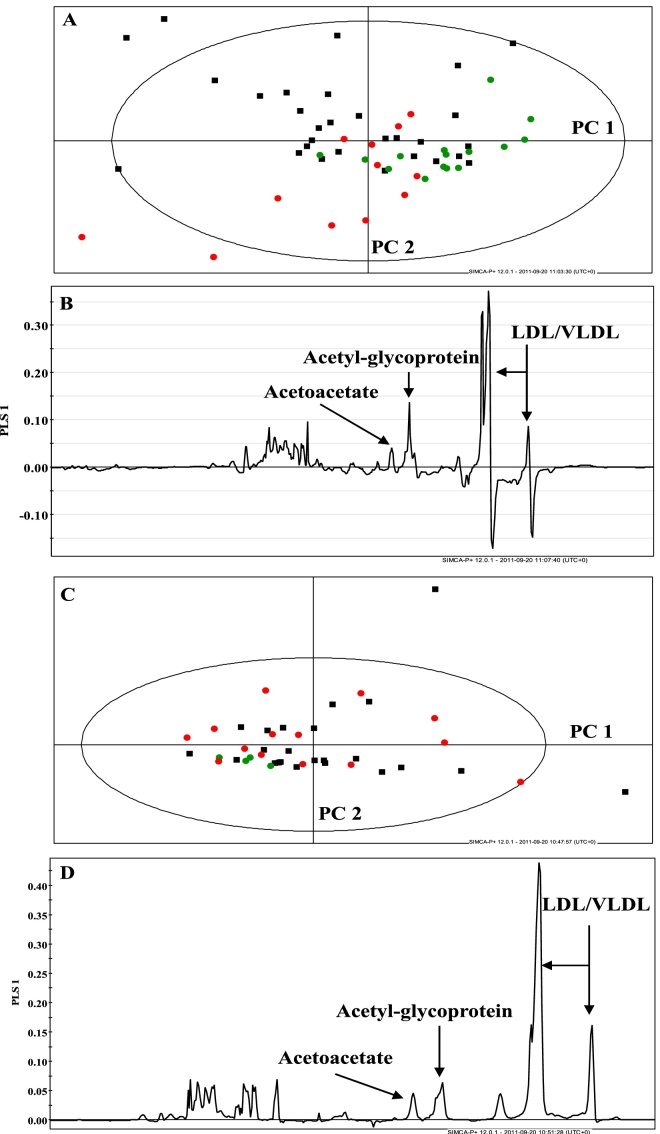
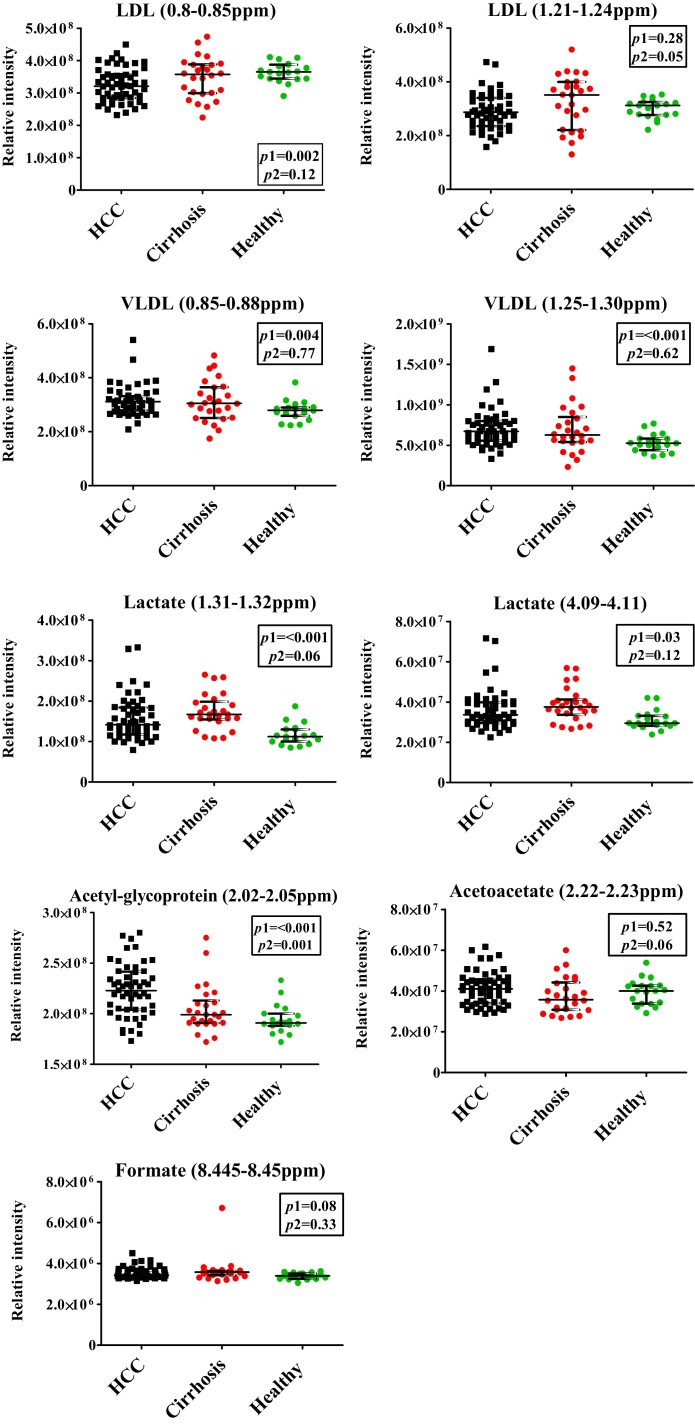
Results: Significant differences between HCC patients and healthy volunteers were detected in levels of low density lipoprotein (P = 0.002), very low density lipoprotein (P < 0.001) and lactate (P = 0.03). N-acetylglycoproteins levels in HCC patients were significantly different from both healthy controls and cirrhosis patients (P < 0.001 and 0.001).
Conclusion: Metabotype differences were present, pointing to disturbed lipid metabolism and a switch from glycolysis to alternative energy metabolites with malignancy, which supports the Warburg hypothesis of tumour metabolism.
Keywords: 1-D, One-dimensional; 1H NMR, proton nuclear magnetic resonance; AFP, α-fetoprotein; ALP, Alkaline phosphatase; ALT, Alanine transaminase; CT, Computed Tomography; EDTA, Ethylenediaminetetraacetic acid; ELISA, Enzyme-linked immunosorbent assay; Egypt; FID, Free induction decays; HBV, Hepatitis B virus; HBsAg, Hepatitis B surface antigen; HCC, Hepatocellular carcinoma; HCV, Hepatitis C virus; IDL, Intermediate density lipoprotein; IQR, Interquartile ranges; JUTH, Jos University Teaching Hospital; LDL, Low density lipoprotein; MRI, Magnetic resonance imaging; NOESY, Nuclear Overhauser enhancement spectroscopy; Nigeria; PC, Principal component; PCA, Principal components analysis; PLS-DA, Partial least squared discriminant analysis; PPARα, Peroxisome proliferator-activated receptor α; RD, Relaxation delay; US, Ultrasonography; VLDL, Very low density lipoprotein; WHO, World Health Organisation; hepatocellular carcinoma; ppm, Parts per million; proton nuclear magnetic resonance spectroscopy; serum metabotype; tm, Mixing time.
Figures
Similar articles
-
Urinary Metabotyping of Hepatocellular Carcinoma in a UK Cohort Using Proton Nuclear Magnetic Resonance Spectroscopy.J Clin Exp Hepatol. 2016 Sep;6(3):186-194. doi: 10.1016/j.jceh.2016.03.003. Epub 2016 Apr 20. J Clin Exp Hepatol. 2016. PMID: 27746614 Free PMC article.
-
Plasma Lipid Profiling in a Rat Model of Hepatocellular Carcinoma: Potential Modulation Through Quinolone Administration.J Clin Exp Hepatol. 2015 Dec;5(4):286-94. doi: 10.1016/j.jceh.2015.07.205. Epub 2015 Jul 18. J Clin Exp Hepatol. 2015. PMID: 26900269 Free PMC article.
-
Urinary nuclear magnetic resonance spectroscopy of a Bangladeshi cohort with hepatitis-B hepatocellular carcinoma: A biomarker corroboration study.World J Gastroenterol. 2016 Apr 28;22(16):4191-200. doi: 10.3748/wjg.v22.i16.4191. World J Gastroenterol. 2016. PMID: 27122669 Free PMC article.
-
Hepatitis C virus in chronic liver disease and hepatocellular carcinoma in Taiwan.Princess Takamatsu Symp. 1995;25:27-32. Princess Takamatsu Symp. 1995. PMID: 8875606 Review.
-
Natural history of chronic hepatitis B REVEALed.J Gastroenterol Hepatol. 2011 Apr;26(4):628-38. doi: 10.1111/j.1440-1746.2011.06695.x. J Gastroenterol Hepatol. 2011. PMID: 21323729 Review.
Cited by
-
Metabolomics technology and bioinformatics for precision medicine.Brief Bioinform. 2019 Nov 27;20(6):1957-1971. doi: 10.1093/bib/bbx170. Brief Bioinform. 2019. PMID: 29304189 Free PMC article. Review.
-
Plasma lipids, tumor parameters and survival in HCC patients with HBV and HCV.J Transl Sci. 2021 Jun;7(3):10.15761/jts.1000421. doi: 10.15761/jts.1000421. Epub 2020 Sep 16. J Transl Sci. 2021. PMID: 34457356 Free PMC article.
References
-
- Khan S.A., Taylor-Robinson S.D., Toledano M.B., Beck A., Elliott P., Thomas H.C. Changing international trends in mortality rates for liver, biliary and pancreatic tumours. J Hepatol. 2002;37:806–813. - PubMed
-
- Taylor-Robinson S.D., Foster G.R., Arora S., Hargreaves S., Thomas H.C. Increase in primary liver cancer in the UK, 1979-94. Lancet. 1997;350:1142–1143. - PubMed
-
- Llovet J.M., Bru C., Bruix J. Prognosis of hepatocellular carcinoma: the BCLC staging classification. Semin Liver Dis. 1999;19:329–338. - PubMed
-
- Yuen M.F., Cheng C.C., Lauder I.J., Lam S.K., Ooi C.G., Lai C.L. Early detection of hepatocellular carcinoma increases the chance of treatment: Hong Kong experience. Hepatology. 2000;31:330–335. - PubMed
LinkOut - more resources
Full Text Sources
Other Literature Sources
Miscellaneous
