

HIV Progression Depends on Codon and Amino Acid Usage Profile of Envelope Protein and Associated Host-Genetic Influence
- PMID: 28663742
- PMCID: PMC5471322
- DOI: 10.3389/fmicb.2017.01083
HIV Progression Depends on Codon and Amino Acid Usage Profile of Envelope Protein and Associated Host-Genetic Influence
Abstract
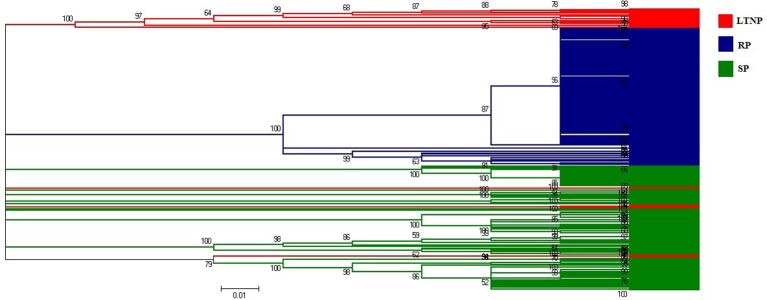
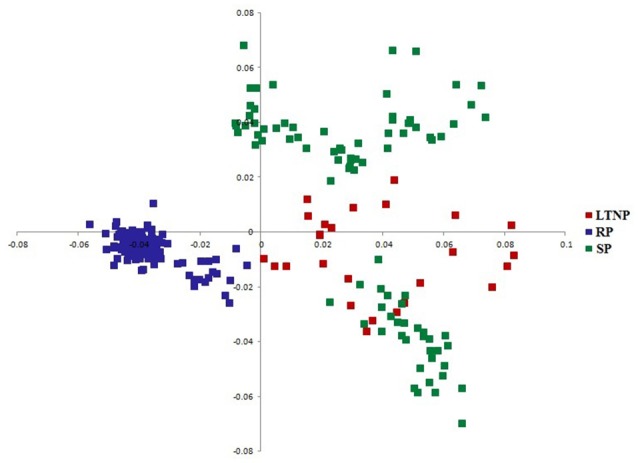
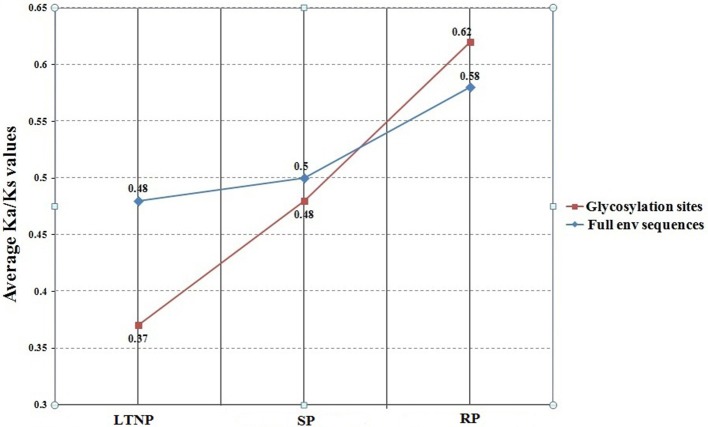
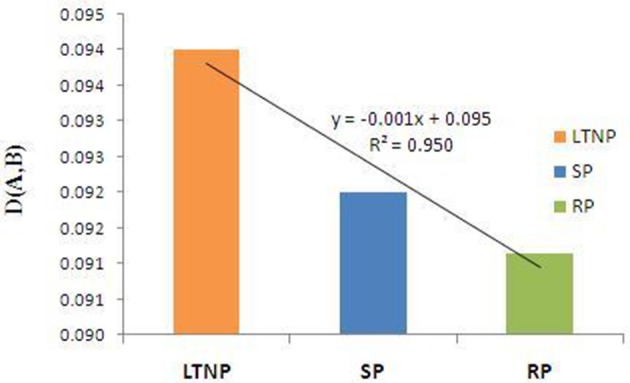
Acquired immune deficiency syndrome (AIDS) is a spectrum of conditions caused by infection with the human immunodeficiency virus (HIV). Two types of HIV have been characterized: HIV-1 and HIV-2. The present study investigated whether evolutionary selection pressure differs between rapid progressor (RP), slow progressor (SP), and long-term non-progressor (LTNP) of HIV-I infected individuals. An unexpected association between the evolutionary rate of substitution in envelope (env) gene and disease progression is observed. Our present study suggests that env genes of LTNP are subject to unusually strong functional constraint with respect to RP. We also observed that the three categories of env genes i.e., RP, SP, and LTNP, had their own characteristic pattern of amino acid usage and SP and LTNP sequences shared similar patterns of amino acid usage different from RP sequences and evolutionary rate significantly influenced the amino acid usage pattern of the three different types of env gene sequences. It was also noted that the evolutionary rate for the glycosylation sites of LTNP and SP sequences were even significantly less than the RP sequences. Comparative analysis on the influence of human host on the three categories of env genes are well correlated with the rates of disease progression suggesting the adaptive strategies of the viruses for successful residence and infection. Host associated selective constraints appeared most relaxed on the RP sequences and strongest in LTNP sequences. The present study clearly portrays how evolutionary selection pressure differs between three categories of env genes i.e., RP, SP, and LTNP. The env genes, coding for the env glycoproteins, experience severe selection constraints from the host due to their constant exposure to the host immune system. In this perspective it might be suggested that env gene evolution occurs mainly by negative selection with the occurrence of mutation that might not reach fixation in the viral population. This work also confers a deeper insight into the crucial effects of host factors that govern the overall progression of HIV infection.
Keywords: disease progression; evolutionary rate; long-term non-progressor; rapid progressor; slow progressor.
Figures
Similar articles
-
HIV long-term non-progressors share similar features with simian immunodeficiency virus infection of chimpanzees.J Biomol Struct Dyn. 2021 Apr;39(7):2447-2454. doi: 10.1080/07391102.2020.1749129. Epub 2020 Apr 7. J Biomol Struct Dyn. 2021. PMID: 32223527
-
Dynamic features of the selective pressure on the human immunodeficiency virus type 1 (HIV-1) gp120 CD4-binding site in a group of long term non progressor (LTNP) subjects.Retrovirology. 2009 Jan 15;6:4. doi: 10.1186/1742-4690-6-4. Retrovirology. 2009. PMID: 19146663 Free PMC article.
-
Rare mutations in a domain crucial for V3-loop structure prevail in replicating HIV from long-term non-progressors.AIDS. 1998 Jun 18;12(9):985-97. AIDS. 1998. PMID: 9662194
-
[Host genetic factors associated with susceptibility to HIV infection and progression of infection].Postepy Hig Med Dosw (Online). 2009 Feb 24;63:73-91. Postepy Hig Med Dosw (Online). 2009. PMID: 19252466 Review. Polish.
-
Omic Technologies in HIV: Searching Transcriptional Signatures Involved in Long-Term Non-Progressor and HIV Controller Phenotypes.Front Immunol. 2022 Jul 1;13:926499. doi: 10.3389/fimmu.2022.926499. eCollection 2022. Front Immunol. 2022. PMID: 35844607 Free PMC article. Review.
Cited by
-
Underlying selection for the diversity of spike protein sequences of SARS-CoV-2.IUBMB Life. 2022 Mar;74(3):213-220. doi: 10.1002/iub.2577. Epub 2021 Nov 25. IUBMB Life. 2022. PMID: 34780121 Free PMC article.
-
The degree of HIV-1 amino acid variability is strictly related to different disease progression rates.Virus Genes. 2018 Aug;54(4):493-501. doi: 10.1007/s11262-018-1571-2. Epub 2018 May 17. Virus Genes. 2018. PMID: 29777446
-
Automated Extraction of Information From Texts of Scientific Publications: Insights Into HIV Treatment Strategies.Front Genet. 2020 Dec 22;11:618862. doi: 10.3389/fgene.2020.618862. eCollection 2020. Front Genet. 2020. PMID: 33414815 Free PMC article.
-
Emergence of Genomic Diversity in the Spike Protein of the "Omicron" Variant.Viruses. 2023 Oct 21;15(10):2132. doi: 10.3390/v15102132. Viruses. 2023. PMID: 37896909 Free PMC article.
-
Evolutionary dynamics of codon usages for peste des petits ruminants virus.Front Vet Sci. 2022 Aug 12;9:968034. doi: 10.3389/fvets.2022.968034. eCollection 2022. Front Vet Sci. 2022. PMID: 36032280 Free PMC article.
References
LinkOut - more resources
Full Text Sources
Other Literature Sources