

doi: 10.1364/BOE.8.001277.
eCollection 2017 Mar 1.
Transcutical imaging with cellular and subcellular resolution
Affiliations
- PMID: 28663828
- PMCID: PMC5480543
- DOI: 10.1364/BOE.8.001277
Item in Clipboard
Transcutical imaging with cellular and subcellular resolution
Biomed Opt Express.
.
Abstract
We demonstrate transcutical structural and functional imaging of neurons labeled with genetically encoded red fluorescent proteins and calcium indicators in the living Drosophila brain with cellular and subcellular resolution.
Keywords: (110.1080) Active or adaptive optics; (180.2520) Fluorescence microscopy; (180.4315) Nonlinear microscopy.
Figures
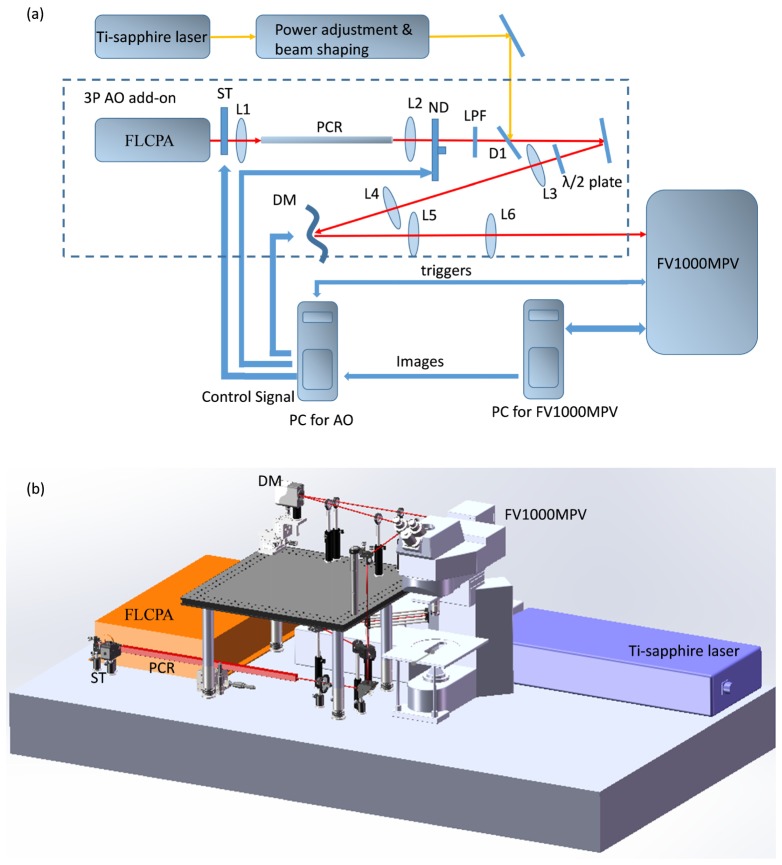
(a) System diagram and (b) setup of the 3P-AO add-on. L, lens; DM, deformable mirror; ST, shutter; ND, variable metallic neutral density filter; LPF, long pass filter; D1, dichroic mirror; PCR, photonic crystal rod.
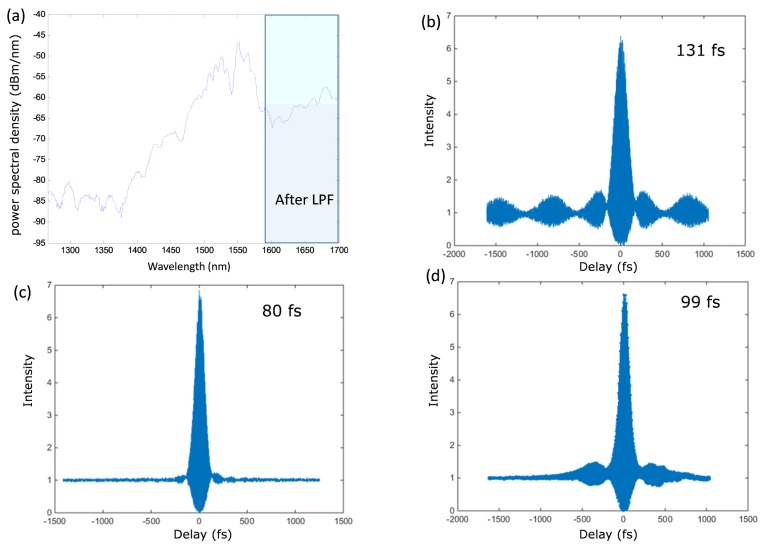
Power spectrum and pulse width measurement of the 3P system. (a) The PCR shifts and broadens the spectrum of the fiber laser. The LPF blocks wavelengths shorter than 1580 nm. (b) Pulse width measured at the output port of the FLCPA, (c) after the PCR, and (d) after the objective lens. All pulse width measurements assume sech2-shaped pulses.
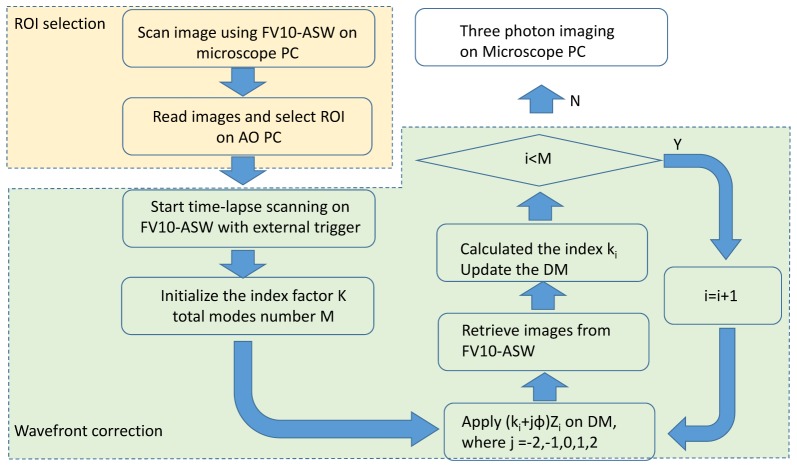
Flow chart for sensorless wavefront correction.
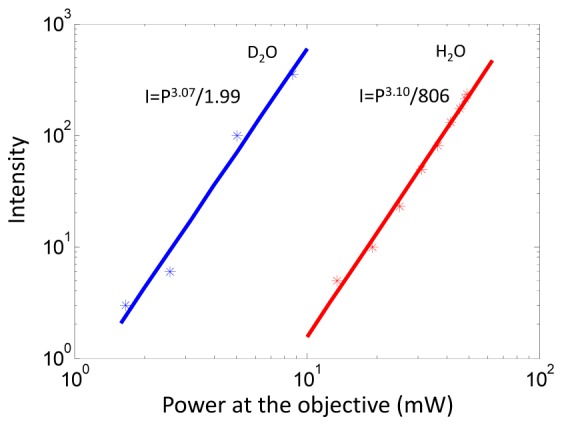
Logarithmic plots of intensity and excitation power at the objective indicating three-photon excitation. A first order polynomial fit is applied to a log-log plot of the data, as shown by the solid curves. The results for using heavy water (D2O) and regular water (H2O) as the immersion medium are indicted by blue and red data points, respectively.
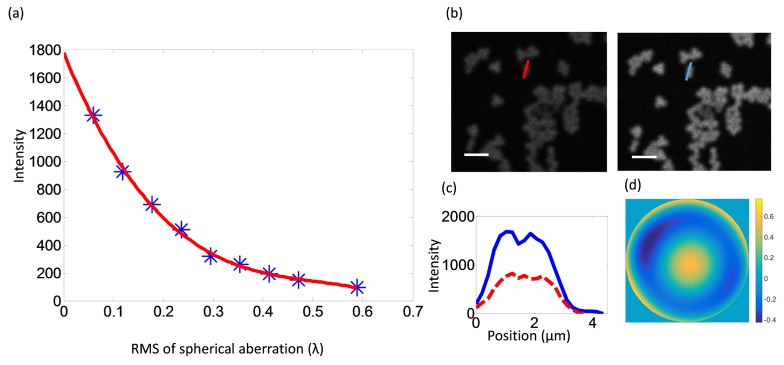
3P-AO imaging of fluorescent microspheres. (a) Fluorescence intensity decreases as spherical aberration increases. Red line: cubic curve fitting. (b) Images of microspheres before and after AO correction, where the aberration was introduced by adjusting the correction collar of the objective lens. (c) The intensity profiles along the lines in (b). (d) The final phase on the DM. Scale bar, 5 µm.
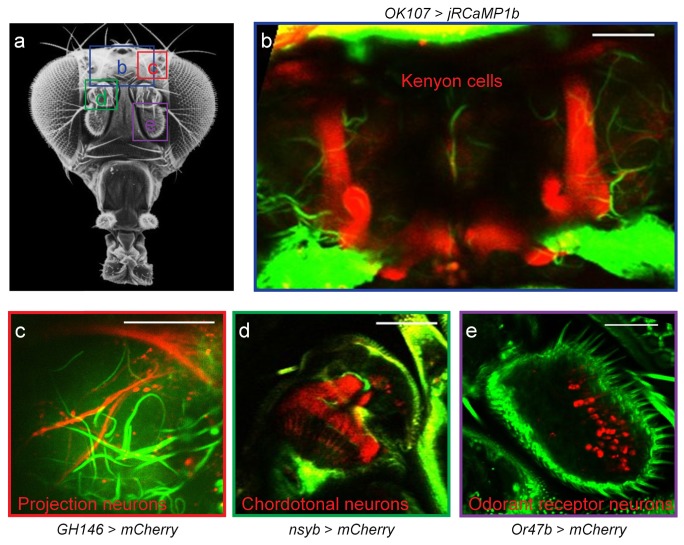
Transcutical imaging of Drosophila brain structures. (a) External view of a fly head. Image source: www.sdbonline.org . The four boxes denote imaging regions. The viewing angle may be slightly different for each region. (b) Mushroom body Kenyon cells of a fly bearing the OK107-GAL4 and UAS-jRCaMP1b transgenes. (c) Axon terminals of second-order projection neurons in the lateral horn region. Transgenes: GH146-GAL4 and UAS-mCherry. (e) Cell bodies of the Or47b odorant receptor neurons. Transgenes: Or47b-GAL4 and UAS-mCherry. (b-e) Red color: fluorescence signals from the labeled neurons. Green color: third harmonic signal. Scale bar, 50 µm.
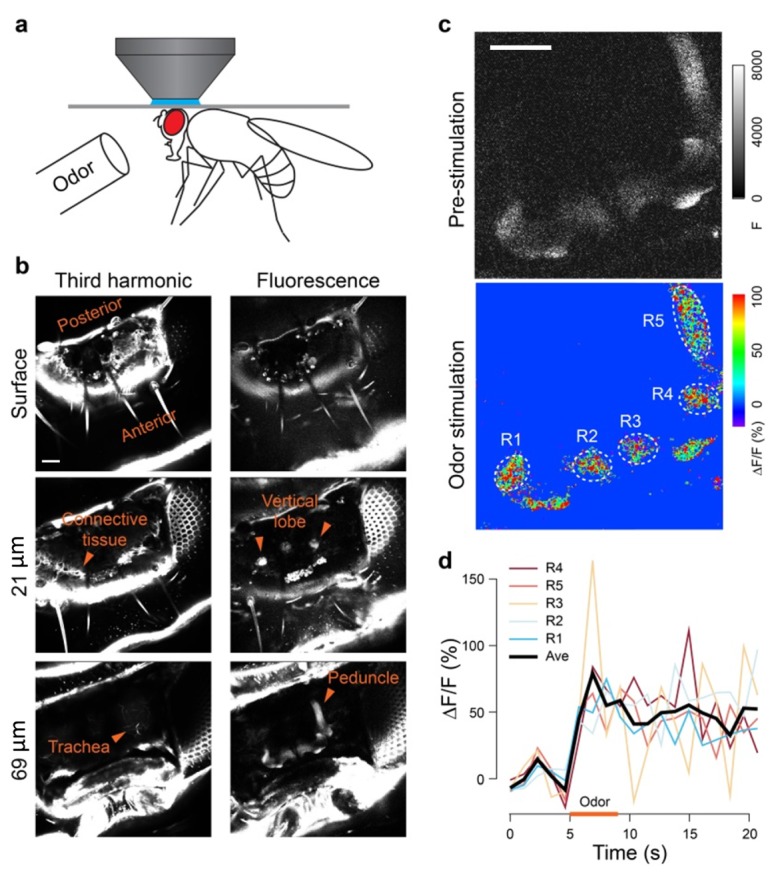
Odor-evoked activity in the fly mushroom body. (a) A fly is glued to a cover glass with light curable resin. (b) Fluorescence and third-harmonic signals at different depths from the fly cuticle. (c) Peak olfactory response of the fly mushroom body. Pseudocolor images show ∆F/F measurement. (d) ∆F/F is plotted against time. Odor: isoamyl acetate at 5% saturated vapor pressure. Fly: OK107-GAL4, UAS-jRCaMP1b. Scale bar, 50 µm.
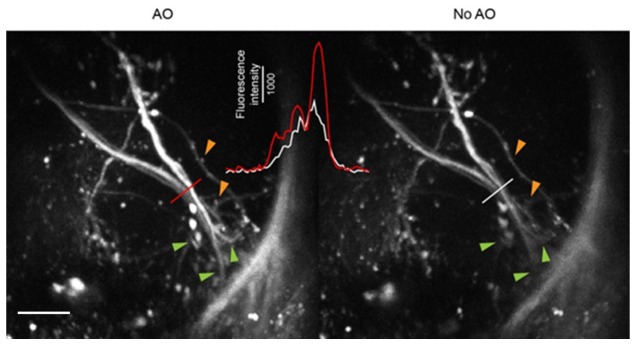
Adaptive optics reveals fine neuronal structures. Axon terminals of the second-order olfactory projection neurons in the lateral horn regions are shown in a fly carrying the GH146-GAL4 and UAS-mCherry transgenes. Line profiles were plotted in the inset. Orange arrowheads: boutons of the projection neurons. Green arrowheads: branches of the projection neurons. Scale bar, 20 µm.
References
Grants and funding
LinkOut - more resources
Full Text Sources
Other Literature Sources
Molecular Biology Databases