. 2017 Feb 21;8(3):1638-1664.
doi: 10.1364/BOE.8.001638. eCollection 2017 Mar 1.

The ecosystem that powered the translation of OCT from fundamental research to clinical and commercial impact [Invited]

Affiliations

The ecosystem that powered the translation of OCT from fundamental research to clinical and commercial impact [Invited]

Eric A Swanson et al. Biomed Opt Express. .

Abstract

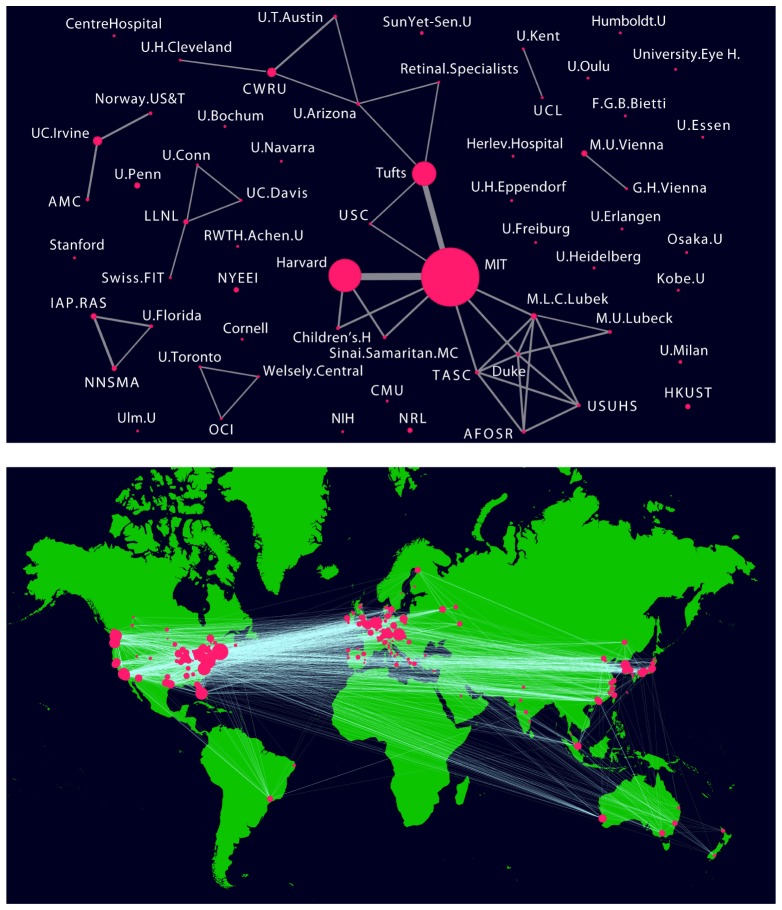
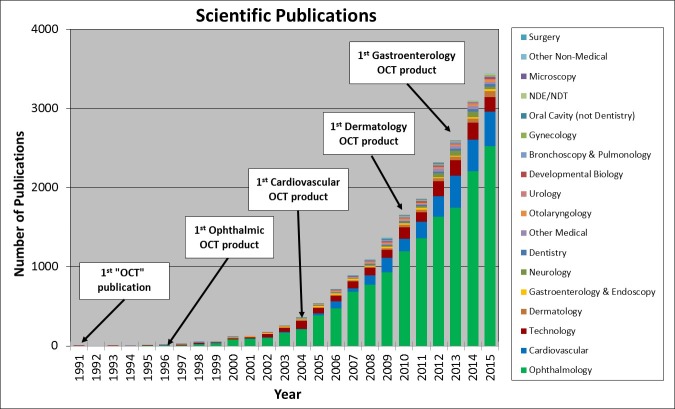
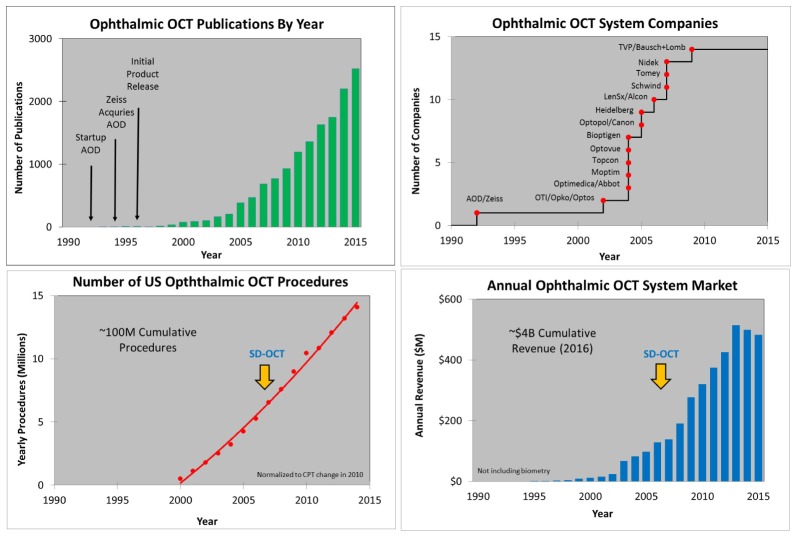
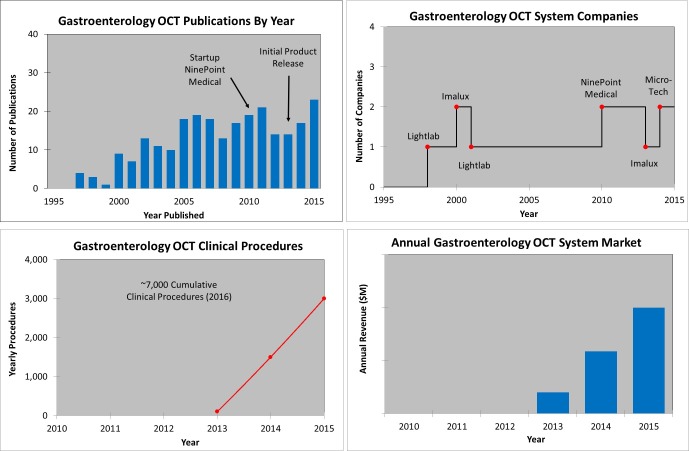
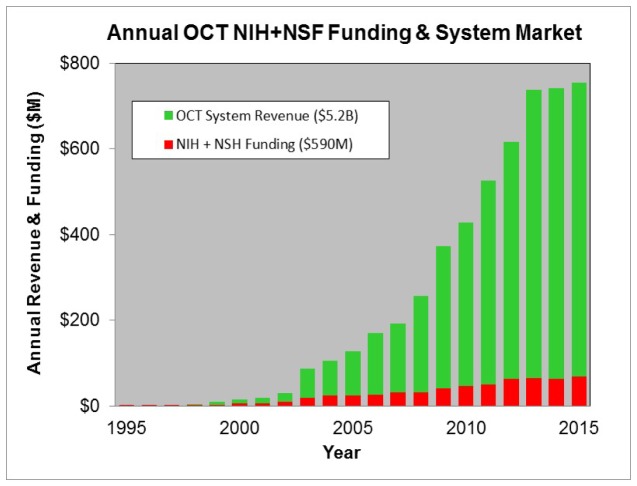
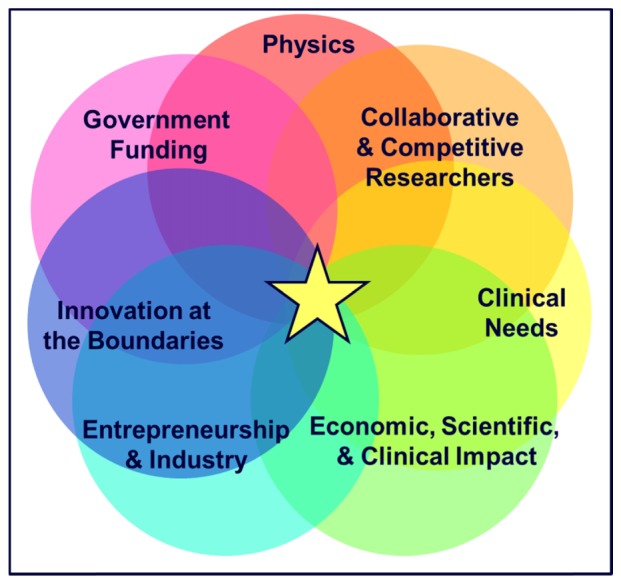
25 years is a relatively short period of time for a medical technology to become a standard of care impacting the treatment of millions of people every year. Yet 25 years ago there were no OCT companies, no OCT products, no OCT markets, and only one journal article published using the term OCT (optical coherence tomography). OCT has had a tremendous scientific, clinical, and economic impact on society. Today, it is estimated that there are ~30 Million OCT imaging procedures performed worldwide every year and the OCT system market is approaching $1B per year. OCT has helped diagnose patients with retinal disease at early treatable stages, preventing or greatly reducing irreversible vision loss. The technology has facilitated pharmaceutical development and contributed to fundamental understanding of disease mechanisms in multiple fields. The invention and translation of OCT from fundamental research to daily clinical practice would not have been possible without a complex ecosystem involving interaction among physics, engineering, and clinical medicine; government funding of fundamental and clinical research; collaborative and competitive research in the academic sector; entrepreneurship and industry; addressing real clinical needs; harnessing the innovation that occurs at the boundaries of disciplines; and economic and societal impact. This invited review paper discusses the translation of OCT from fundamental research to clinical practice and commercial impact, as well as describes the ecosystem that helped power OCT to where it is today and will continue to drive future advances. While OCT is an example of a technology that has had a powerful impact, there are many biomedical technologies which are poised for translation to clinical practice, and it is our hope that highlighting this ecosystem will help accelerate their translation and clinical impact.

Keywords: (170.3880) Medical and biological imaging; (170.4500) Optical coherence tomography.


Figures

Fig. 1
Fig. 1
Key concepts of OCT including: TD-OCT, SD-OCT, and SS-OCT detection; axial and lateral image resolution and depth of field; and how 2D images (B-scan) and 3D volumetric images are generated from 1D axial scans (A-scans).
Fig. 2
Fig. 2
Yearly NIH and NSF funding of OCT related research which cumulatively totals ~$600M.
Fig. 3
Fig. 3
(A, top) In 1998 there were 123 cumulative scientific publications with the term “OCT” in the title or abstract in as estimated from the PubMed database. (B, bottom) Currently there are ~20,000 cumulative scientific, business, product publications with the term “OCT” as estimated from the website: www.octnews.org. In the figures shown above and as noted below, if terms the search terms were broadened the relative sizes of the circles and links would change.
Fig. 4
Fig. 4
Annual PubMed publications with the term OCT in the title or abstract, along with a categorization of topic / clinical specialty. Dates where the first commercial clinical products were introduced are indicated. Note in some cases there were earlier commercial releases of products, but some companies did not achieve positive revenues and left the market. Since scientific and clinical publications are a bellwether for scientific and clinical knowledge as well as clinical adoption, this data shows the key role of industry. There are ~20,000 publications in a wide range of clinical specialties as well as other applications.
Fig. 5
Fig. 5
The first OCT images published in the journal Science in 1991 [1]. (A) Optical coherence tomography of the human retina ex vivo and corresponding histology. (B) Optical coherence tomography of human artery ex vivo and corresponding histology. Ophthalmology and cardiology have become the two largest clinical applications on OCT.
Fig. 6
Fig. 6
The first clinical ophthalmic imaging OCT prototype designed at MIT Lincoln Laboratories and used at the New England Eye Center. Left OCT imaging engine, Right: slit lamp modified to support in vivo OCT (picture from August 1992). Image courtesy MIT Lincoln Laboratory.
Fig. 7
Fig. 7
Estimate of the growing number of OCT system companies over the past 25 years. There are many more subsystem and component companies not listed. Blue dots represent companies that began or still are startups and red dots are existing companies that started OCT programs internally. A few of these companies have been acquired or gone out of business.
Fig. 8
Fig. 8
A qualitative view of the phases and milestones of medical device products. Compared to other technologies, medical products face a longer path to market because of the need to gather clinical evidence and obtain regulatory and reimbursement approval. Pioneering firms which introduce new technologies usually have a more difficult path than later entrants who are following established clinical applications.
Fig. 9
Fig. 9
US Patents issued by year with the term “Optical Coherence Tomography” in the Title (blue), Title, Abstract, or Claims (green), and Specification (Red). Cumulatively there are ~1,000 US Issued patents since 1990 with the term “Optical Coherence Tomography” in the title, abstract, or claims.
Fig. 10
Fig. 10
Ophthalmic OCT metrics illustrating: the estimated number of OCT publications, yearly US OCT procedures, growing number of OCT companies, and OCT system revenue. The commercial introduction of SD-OCT occurred after substantial growth of TD-OCT. The revenue plot does not include technology associated with the ocular biometry which has technological commonality with OCT. Ophthalmic OCT procedures were normalized to account for the CPT code change in 2010 (discussed below).
Fig. 11
Fig. 11
OCT image of the normal retinal from the Carl Zeiss Meditec commercial PLEX Elite 9000 ophthalmic SS-OCT instrument. Imaging was at 1050 nm wavelength, at 100 kHz A-scan rate with 6.3 μm axial resolution. In addition to retinal structure, the full choroidal thickness and vasculature can be visualized in this widefield image. Image courtesy of Zeiss.
Fig. 12
Fig. 12
Screen shot of one view of the Optovue commercial AngioVue ophthalmic SD-OCT product. The top left shows the OCT-A en-face view of micro-capillary network of blood flow. The upper right shows an OCT en-face with a retinal thickness map. The lower right shows a cross sectional B-scan with automated segmentation of a layer shown in green. The lower left shows a cross sectional view of both structural and OCT-A flow information. Image courtesy of Optovue.
Fig. 13
Fig. 13
Allowed Medicare services per year for three CPT code categories: CPT code 92235 is used for fluorescein angiography, 92250 is used for fundus photography, and 92132/3/4/5 is used for OCT (including other diagnostic imaging, but dominated by OCT). In 2010 Medicare accounting was changed to only allow one service to be credited whether one eye or both eyes were scanned. This caused an adjustment in the Medicare service count, but the overall growth of OCT is apparent.
Fig. 14
Fig. 14
Cardiovascular OCT metrics illustrating: the estimated number of OCT publications, yearly WW OCT procedures, growing number of OCT companies, and OCT system and disposable revenue. Note the commercial introduction of SS-OCT after substantial success of TD-OCT. Note CardioSpectra/Volcano entered the market in ~2005 but ended their effort around 2013.
Fig. 15
Fig. 15
Screen shot of one view from the St. Jude medical cardiovascular SS-OCT imaging system user interface. The upper left shows a 3D rendering of the inside of a human coronary artery. The upper right shows a cross sectional 2D image and the bottom image shows a longitudinal pullback 2D image also showing the artery, stent, and guidewire. Image courtesy St. Jude Medical.
Fig. 16
Fig. 16
Dermatology OCT metrics illustrating: the estimated number of OCT publications, yearly WW OCT procedures, growing number of OCT companies, and growing OCT system revenue (y-axis intentionally left blank). Note ISIS entered the market in ~1999 but ended their effort around 2004. Note: the numerical axis is missing on the annual revenue due to its confidential nature being dominated by only one company.
Fig. 17
Fig. 17
Screen shot of a one view of the Michelson Diagnostics Vivosight Scanner user interface showing basal cell carcinoma, structural OCT (top left en-face, top right cross-sectional views) and dynamic OCT with OCT-A overlaid on structural OCT (bottom left side en-face, right cross-sectional views). The bascal cell carcinoma exhibits several oval areas with homogenous signal, surrounded by a dark rim. The tumor vessels are arranged around the tumor islands. Image courtesy Julia Welzel Head of Department of Dermatology, General Hospital, Ausburg, Germany and Michelson Diagnostics [29].
Fig. 18
Fig. 18
Gastroenterology OCT metrics illustrating: the estimated number of OCT publications, yearly WW OCT procedures, growing number of OCT companies, and growing OCT system and disposable revenue (y-axis intentionally left blank). Note both Lightlab and Imalux entered the market but left as described above. Note that the annual revenue is not labelled because it is attributed predominantly to one company and is confidential.
Fig. 19
Fig. 19
Screen shot of one view of the NinePoint Medical Nvision VLE Imaging System user interface (left side) showing in in vivo structural OCT images of human esophagus along with a 3D rendering (upper right corner) and a zoomed region compared with a histological section (lower right corner). Image courtesy NinePoint Medical.
Fig. 20
Fig. 20
FF-OCT image of a human pancreas biopsy taken using the commercial Light-CT Scanner (a, b) in comparison to conventional histology (c, d). Image courtesy LLTech.
Fig. 21
Fig. 21
Estimated OCT related employment. “Research” employment consists of professors, postdocs, and other university staff. “Direct OCT Industry” jobs are from a survey of 64 leading OCT system, subsystem, and component companies showing employment in engineering, marketing, sales, manufacturing, management that are directly attributed to OCT products. “Indirect Industry” shows additional ~2X number of jobs related to other employment in the OCT supply chain. “Hospital / Clinic” shows estimate of clinical jobs related to OCT.
Fig. 22
Fig. 22
Estimated OCT yearly system revenue (green) in comparison to yearly NIH and NSF OCT funding. The yearly revenue includes the biometry market.
Fig. 23
Fig. 23
The Ecosystem for medical technology translation and clinical impact. Although this manuscript focused on OCT, other medical instrumentation / device technologies would require a similar ecosystem for translation and clinical impact.

References

    1. Huang D., Swanson E. A., Lin C. P., Schuman J. S., Stinson W. G., Chang W., Hee M. R., Flotte T., Gregory K., Puliafito C. A., Fujimoto J. G., “Optical coherence tomography,” Science 254(5035), 1178–1181 (1991).10.1126/science.1957169 - DOI - PMC - PubMed
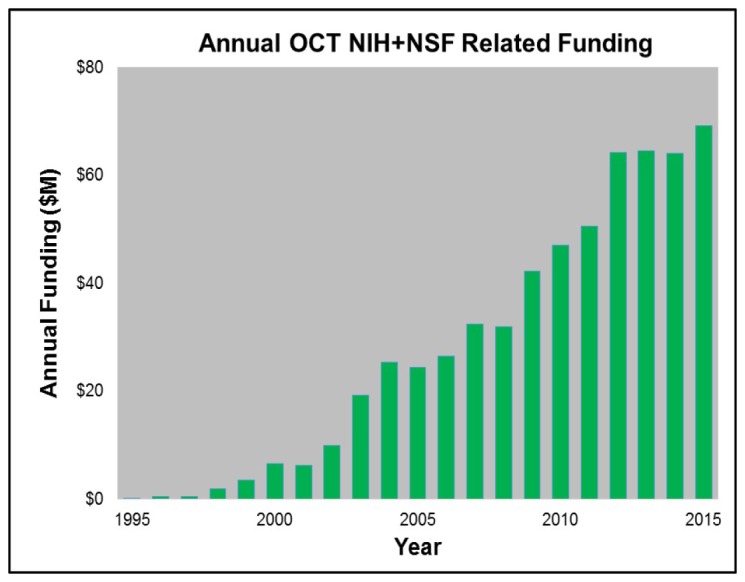
    1. Swanson E. A., “One Decade and $500M: The Impact of Federal Funding on OCT Parts I & II,” BioOptics World (2011).
    1. Fujimoto J., Swanson E., “The Development, Commercialization, and Impact of Optical Coherence Tomography,” Invest. Ophthalmol. Vis. Sci. 57(9), OCT1–OCT13 (2016), doi:.10.1167/iovs.16-19963 - DOI - PMC - PubMed
    1. Swanson E., “Beyond Better Clinical Care: OCT’s Economic Impact,” BioOptics World (2016).
    1. Swanson E. A., Huang D., “Ophthalmic OCT Reaches $1 Billion per Year: But Reimbursement Clampdown Clouds Future Innovation,” Retinal Physician 45, 58–59 (2011).

LinkOut - more resources