. 2017 Apr 7;8(5):2405-2444.
doi: 10.1364/BOE.8.002405. eCollection 2017 May 1.

Endoscopic optical coherence tomography: technologies and clinical applications [Invited]

Affiliations

Endoscopic optical coherence tomography: technologies and clinical applications [Invited]

Michalina J Gora et al. Biomed Opt Express. .

Abstract

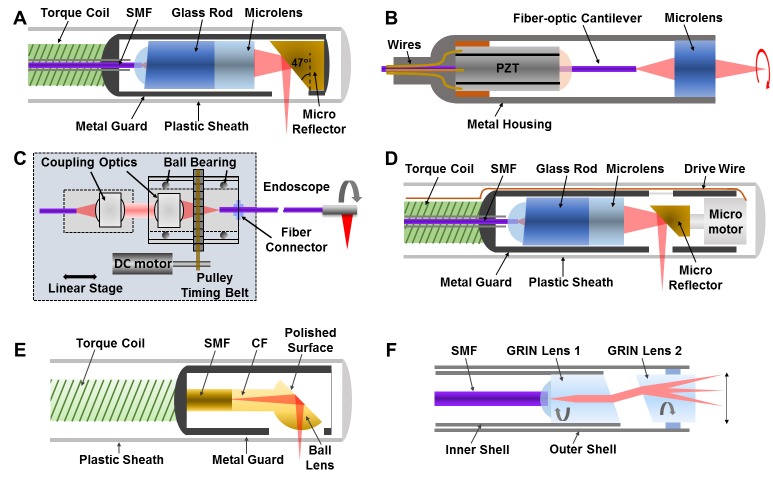
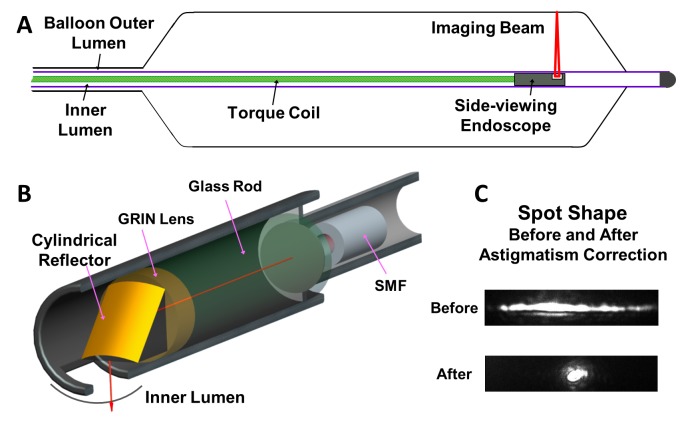
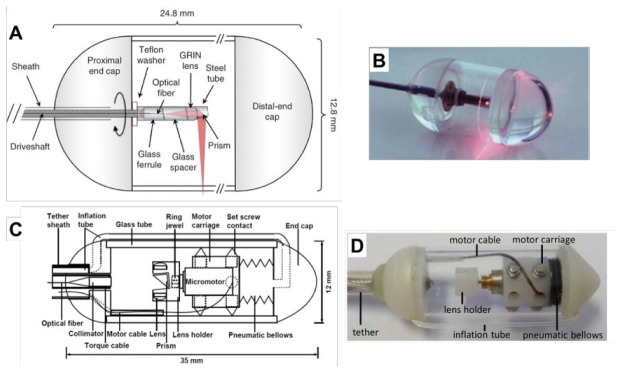
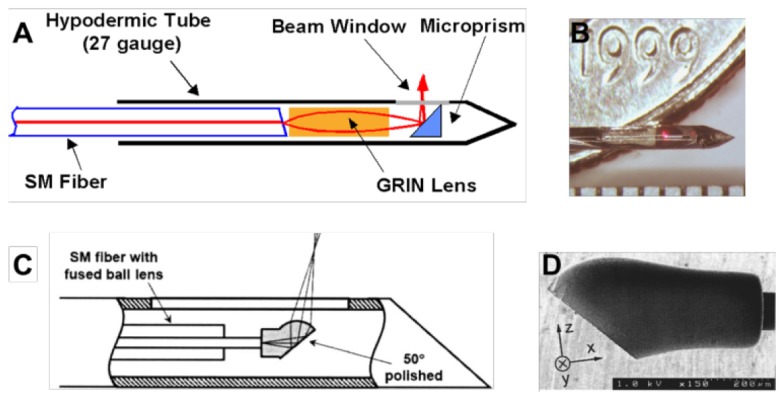
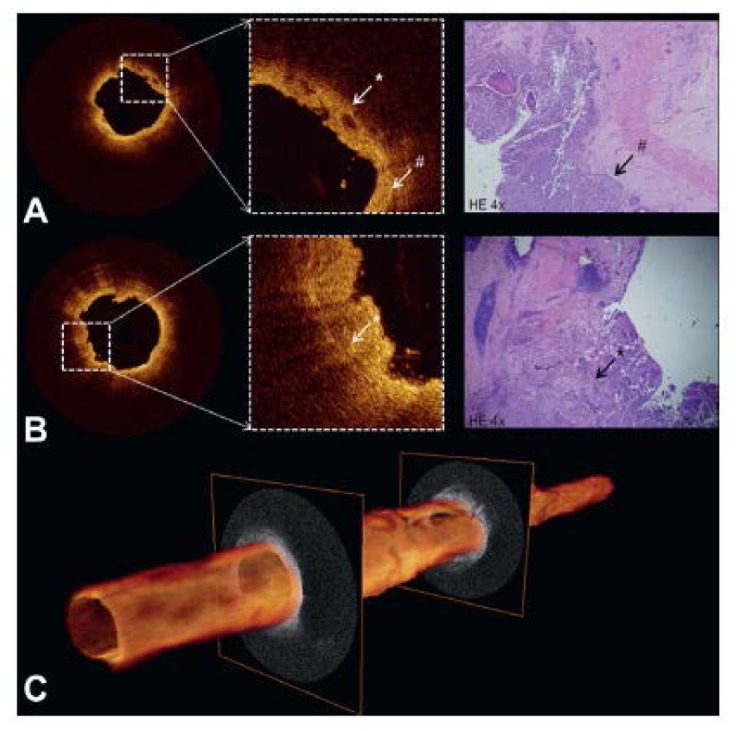
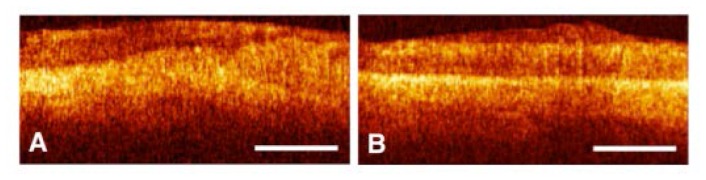
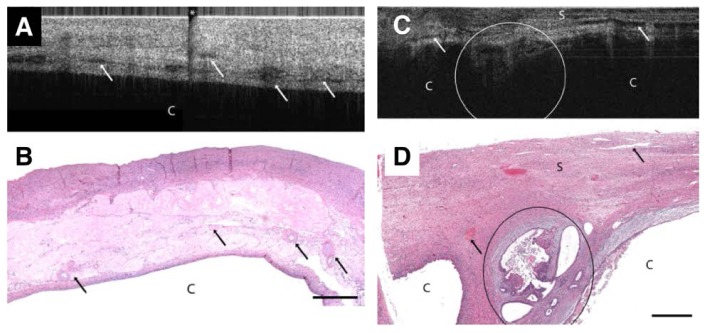
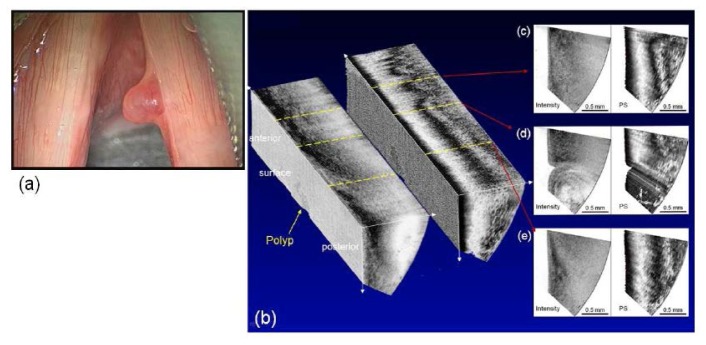
In this paper, we review the current state of technology development and clinical applications of endoscopic optical coherence tomography (OCT). Key design and engineering considerations are discussed for most OCT endoscopes, including side-viewing and forward-viewing probes, along with different scanning mechanisms (proximal-scanning versus distal-scanning). Multi-modal endoscopes that integrate OCT with other imaging modalities are also discussed. The review of clinical applications of endoscopic OCT focuses heavily on diagnosis of diseases and guidance of interventions. Representative applications in several organ systems are presented, such as in the cardiovascular, digestive, respiratory, and reproductive systems. A brief outlook of the field of endoscopic OCT is also discussed.

Keywords: (170.1610) Clinical applications; (170.2150) Endoscopic imaging; (170.4500) Optical coherence tomography; (170.4580) Optical diagnostics for medicine.


Figures

Fig. 1
Fig. 1
Schematics of (A) Side-viewing OCT endoscope; (B) Forward-viewing endoscope; (C) Proximal scanning with a fiber-optic rotary joint. 3D imaging is performed by pulling back the rotating endoscope; (D) Distal-scanning endoscope with a micromotor; (E) Monolithic all-fiber-optic micro endoscope; (F) Pairs-angle-rotation-scanning forward-viewing endoscope. PZT: Lead zirconate titanate; SMF: single-mode fiber; CF: coreless fiber.
Fig. 2
Fig. 2
(A) Schematic of a double-lumen OCT balloon endoscope; (B) Schematic of an OCT endoscope with astigmatism correction by introducing a cylindrical reflector. (C) Photos of focused spots before and after astigmatism correction. (Figure C adapted from [27].)
Fig. 3
Fig. 3
(A) Schematic and (B) photo of a tethered proximal-scanning OCT capsule endoscope. (Figures A and B adapted from Ref [75].) (C) Schematic and (D) photo of a tethered distal-scanning OCT capsule. (Figures C and D adapted from [11].)
Fig. 4
Fig. 4
(A) Schematic and (B) photo of an OCT imaging needle. (Figures A and B adapted from [76].) (C) Schematic and (D) SEM micrograph of a monolithic ball lens-based OCT imaging needle. (Figures C and D adapted from [30])
Fig. 5
Fig. 5
(A) Schematic of a diffractive optics-based ultrahigh-resolution OCT endoscope. (B) Measured axial resolution afforded by the diffractive OCT endoscope. (C) Representative OCT image of a guinea pig esophagus in vivo acquired with the diffractive endoscope. (Figure A adapted from [7]; Figures B and C adapted from [86].)
Fig. 6
Fig. 6
(A) Photo of a double-clad fiber (DCF) end surface. (B) Schematic of a representative OCT-Fluorescence dual-modal endoscopic system. (Figure B adapted from [.])
Fig. 7
Fig. 7
(A) Schematic of an OCT-ultrasound dual-modal endoscope with two modalities sharing the same working distance and capable of co-registration. (B) Representative OCT image of a rabbit aorta ex vivo overlaid on the corresponding ultrasound image acquired with the dual-modal endoscope. (Adapted from [99], with the full permission of AIP publishing.)
Fig. 8
Fig. 8
OCT images of human coronary plaques in vivo. (A) Artery wall with intimal hyperplasia. (B) Fibrous plaque showing a thickened intima. (C) Calcific plaque demonstrating a heterogeneous, signal poor region (orange arrows) with clearly demarcated borders. (D) OCT fibroatheroma, showing a signal poor region with poorly defined borders (yellow arrows), consistent with lipid, and overlying tissue, known as the fibrous cap (red arrows). Tick marks in (A), (B), and (D) – 250 µm. Tick marks in (C) – 500 µm.
Fig. 9
Fig. 9
Angiography of the left circumflex coronary artery (A) and 2-dimensional NIRAF map (B). (C) Cross-sectional OCT-NIRAF image and (D) magnified portion showing elevated NIRAF colocalized with stent struts overlying an OCT-delineated fibroatheroma. (E) Cross-sectional image from the distal portion of the stent that is negative for NIRAF. (F) Three-dimensional cutaway rendering with overlaid NIRAF signal. Scale bars on OCT images are equal to 1 mm; scale bar in (B) is equal to 5 mm. (∗) Indicates a guidewire shadow. ps = pullback segment; L = lipid. (Adapted from [111], with permission from Elsevier.)
Fig. 10
Fig. 10
Findings at stent implantation. (A) Under-expanded stent with malapposed struts. (B) Edge dissection flap (star) and stent struts (arrows) are observed. (Figure and caption adapted with permission of Springer from [118].)
Fig. 11
Fig. 11
(A) OCT image of normal squamous epithelium (bar = 500µm) shows a 5-layered appearance (from top to bottom: epithelium, lamina propria, muscularis mucosa, submucosa, and muscularis propria). (B) OCT image of gastric mucosa with “pit and crypt” architecture. (C) OCT image of BE with an irregular mucosal surface and absence of a layered or pit and crypt architecture. (D) OCT image of BE with submucosal glands (circled). (Figure and caption adapted from [121], with permission from Elsevier.)
Fig. 12
Fig. 12
Presumed Barrett’s esophagus. (A) Videoendoscopic image shows an irregular SCJ with a tongue of healthy mucosa (arrow). (B) An MIP rendering of the entire volumetric OFDI data set, obtained at the corresponding location in A. (C) Corresponding cross-sectional OFDI image demonstrates squamous mucosa (blue arrow) interspersed with regions that satisfy the OCT criteria for BE (red arrows). (D) Histopathologic image of the biopsy specimen taken from the SCJ with no signs of intestinal metaplasia (H&E, orig. mag. 2). (E) A longitudinal OFDI cross-section through the SCJ shows a 12-mm segment of mucosa that is consistent with BE. Scale bars and tick marks represent 1 mm. (Figure and caption adapted from [129], with permission from Elsevier.)
Fig. 13
Fig. 13
Schematic of VLE-guided biopsy. (Figure and caption adapted from [132].)
Fig. 14
Fig. 14
A, Representative endoscopic image of the gastroesophageal junction immediately after radiofrequency ablation (RFA) treatment. B, Representative cross-sectional OCT image showing unburned Barrett’s esophagus epithelium missed by RFA. C, Representative cross-sectional OCT image showing residual glands after RFA and D, corresponding histology confirming residual BE glands after RFA (H&E, orig. mag. x4). E, Representative cross-sectional OCT image showing effective RFA treatment. (Figure and caption adapted from [136], with permission from Elsevier.)
Fig. 15
Fig. 15
(A) Endoscopic view of BE using narrow band imaging. (B) En face OCT image at 220 mm depth (lamina propria layer). (C) Enlarged en face OCT image and the corresponding cross-sectional OCT image and (D) histology from the dashed red region in (B). En face OCT angiograms: (E) at 100 mm depth showing surface vasculature in the BE region, and (F) at 220 mm depth showing high density of microvasculature along the squamocolumnar junction. Red arrows, BE glands; white bar, 1 mm. (Figure and caption adapted from [44], with permission from Elsevier.)
Fig. 16
Fig. 16
(a) Tethered capsule endomicroscopy (TCE) device. TCE images obtained from a healthy volunteer in vivo: (b, c) in the normal esophagus (squamous epithelium (E), muscularis mucosa (MM), lamina propria (L), submucosa (S) containing blood vessels (arrowheads), inner muscularis (IM), outer muscularis (OM) and myenteric plexus (MP)), and (d, e) in the stomach showing characteristic glandular ‘pits’ (arrowheads). (f, g) TCE image obtained from a patient with BE in vivo. The asterisks indicate a multiple reflection artifact. Tick marks, (b, d, f) 1 mm; scale bars, (c, e, g) 0.5 mm. (Figure and caption adapted from [75].)
Fig. 17
Fig. 17
Duodenal villi seen by OCT. Scar bar: 500 μm.
Fig. 18
Fig. 18
Endoscopic, OCT and the corresponding histologic images of hyperplastic polyp (a-c); adenomatous polyp (d–f). (Figure and caption adapted from [21].)
Fig. 19
Fig. 19
(A) Radial OCT image of the common bile duct in a patient with a benign stricture following cholecystectomy. The probe is surrounded by the endoscopic retrograde cholangiopancreatography catheter (arrow). (B) OCT criteria - large, non-reflective areas contained in the intermediate layer - suggesting tumor vessels. Both axial section and longitudinal reconstruction are depicted. (Figure and caption adapted from [154], by permission from Macmillan Publishers Ltd.)
Fig. 20
Fig. 20
Representative OCT images (top row) and corresponding standard histologic section (H&E stain; original magnification, x20, bottom row) of: (A, B) normal healthy human bronchus showing a single-layer epithelium (e) on top of the basement membrane (bm) and upper submucosa; (C, D) an area with metaplasia; (E, F) an area with moderate dysplasia; and (G, H) an area with carcinoma in situ. Each calibration mark in the OCT image is equal to 1mm. (Figure and caption adapted from [158], with permission from AACR.)
Fig. 21
Fig. 21
Endobronchial OCT, histology and CT measurement matching. (A) OCT measurement vision; (B) Histology measurement vision; (C) CT measurement vision. (Figure and caption adapted from [162], with permission from Elsevier.)
Fig. 22
Fig. 22
OCT-AFI image presentation: (a) coordinate system defined with respect to the catheter tip, (b) OCT-AFI frames along the pullback presented in polar coordinates, en face AFI z-θ image, and (d) an OCT-AFI frame presented in Cartesian coordinates. Scale-bars are 1mm. (Figure and caption adapted from [167].)
Fig. 23
Fig. 23
Morphological comparison between asthmatic and healthy control human subjects in vivo with OR-OCT. Circularized volumetric image from a 2.7-cm endoscopic pullback of a (A) healthy control and an (B) allergic asthmatic subject acquired from similar regions in the right upper lobe. (C and D) Unwrapped and two-dimensional representations of the airway segments depicted in (A) and (B). Dashed lines and brackets, 6 mm. (Figure and caption adapted from [168]. Reprinted with permission from AAAS.)
Fig. 24
Fig. 24
Pathologic findings on optical coherence tomography imaging of the bladder: (a) dysplasia; (b) carcinoma in situ; (c) papillary Ta lesion; (d) T1 lesion; (e) muscle-invasive urothelial cell carcinoma. (Figure and caption adapted from [171], with permission from Elsevier.)
Fig. 25
Fig. 25
(A) and (B) cross-sectional OCT images of proximal ureter show interruption (white asterisk) of thin dark line (white pound sign), suggesting invasive tumor. Corresponding histology revealed T3G3 urothelial carcinoma (black arrow). (C) 3D pullback of OCT built from 520 individual cross-sectional images over 5.2 cm length. (Figure and caption adapted from [177], with permission from Elsevier.)
Fig. 26
Fig. 26
OCT tomograms of the cervix after electrosurgery: (A) two weeks later (zone of necrosis - right); (B) six weeks after (normal epithelium seen as an even stripe). Scale bars, 500 µm. (Figure and caption adapted from [180].)
Fig. 27
Fig. 27
(A) OCT image of papillary serous cystadenoma (4x1.4 mm) and (B) corresponding histopathology. (C) OCT image of endometrioid adenocarcinoma (4x1.4 mm) and (D) corresponding histopathology. OCT and histopathology images are to scale. Scale bar, 500 μm. C: cyst, Arrows: blood vessels, S: stroma, circled region: malignant glands, asterisk: imaging system artifact. (Figure and caption adapted from [181], with permission from Elsevier.)
Fig. 28
Fig. 28
Wide field image (a), 3D PS-OCT image of polyp (b, intensity: left, PS: right), and cross-sectional images (c-e). (Figure and caption adapted from [23].)
Fig. 29
Fig. 29
In vivo OCT images of human upper airway covering hypopharynx (a), oropharynx (b) and (c), and nasopharynx (d). 3-D rendering profile view (e) and front-on view (f) from in vivo data. Epiglottis (E), base of tongue (BT), soft palate (SP), adenoidal tissue (AT), right nasal cavity (NC) are labeled. (Figure and caption adapted from [192].)
Fig. 30
Fig. 30
Chronic middle-ear infection with a thick, highly scattering biofilm. (A) Video otoscopy image showing a less-translucent tympanic membrane (TM). (B) Typical OCT depth scan showing evidence of a thick (∼200 μm average thickness) biofilm behind the TM. (C) Cross-sectional OCT image showing the lateral spatial extent of biofilm. (D) Classification results of the OCT scans demonstrating that 87% of acquired OCT scans were classified as abnormal. (Scale bar in C: 100 μm.) (Figure and caption adapted from [197].)
Fig. 31
Fig. 31
OCT images of the nasal mucosa from a healthy control (A) and a patient with CF (B), showing the epithelium (E), basement membrane (BM), lamina propria (LP) with seromucinous glands (SG) and perichondrium (PC). Validation measurements of nasal mucosa (C) and epithelial layer thickness (D) by OCT imaging in healthy controls. Data are presented as individual data points and median. (Figure and caption adapted from [42], with permission from Elsevier.)

References

    1. Cao T., Tey H. L., “High-definition optical coherence tomography - an aid to clinical practice and research in dermatology,” J. Dtsch. Dermatol. Ges. 13(9), 886–890 (2015). - PubMed
    1. Olsen J., Themstrup L., Jemec G. B., “Optical coherence tomography in dermatology,” G. Ital. Dermatol. Venereol. 150(5), 603–615 (2015). - PubMed
    1. Ulrich M., Themstrup L., de Carvalho N., Manfredi M., Grana C., Ciardo S., Kästle R., Holmes J., Whitehead R., Jemec G. B., Pellacani G., Welzel J., “Dynamic optical coherence tomography in dermatology,” Dermatology (Basel) 232(3), 298–311 (2016). - PubMed
    1. Tearney G. J., Boppart S. A., Bouma B. E., Brezinski M. E., Weissman N. J., Southern J. F., Fujimoto J. G., “Scanning single-mode fiber optic catheter-endoscope for optical coherence tomography,” Opt. Lett. 21(7), 543–545 (1996). - PubMed
    1. Rollins A. M., Ung-Arunyawee R., Chak A., Wong R. C. K., Kobayashi K., Sivak M. V., Jr, Izatt J. A., “Real-time in vivo imaging of human gastrointestinal ultrastructure by use of endoscopic optical coherence tomography with a novel efficient interferometer design,” Opt. Lett. 24(19), 1358–1360 (1999). - PubMed