

Quantifying melanin concentration in retinal pigment epithelium using broadband photoacoustic microscopy
- PMID: 28663911
- PMCID: PMC5480434
- DOI: 10.1364/BOE.8.002851
Quantifying melanin concentration in retinal pigment epithelium using broadband photoacoustic microscopy
Abstract
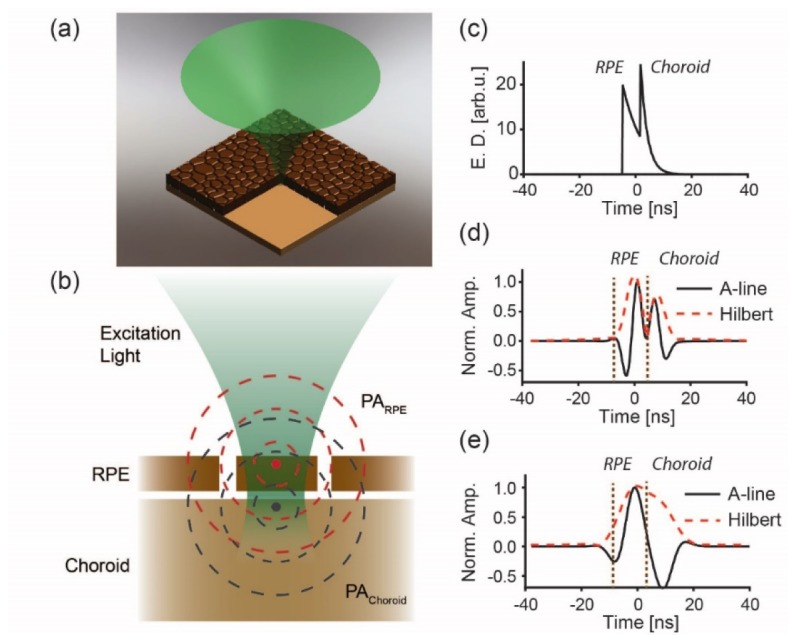
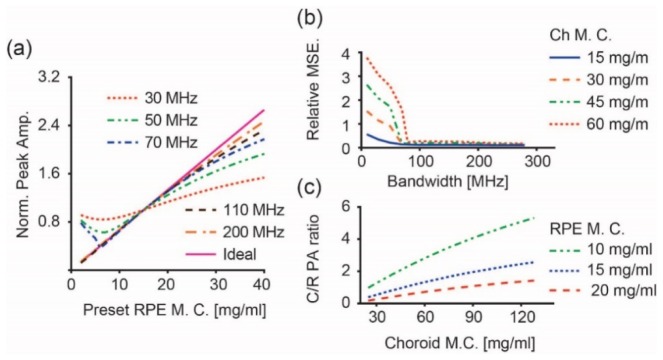
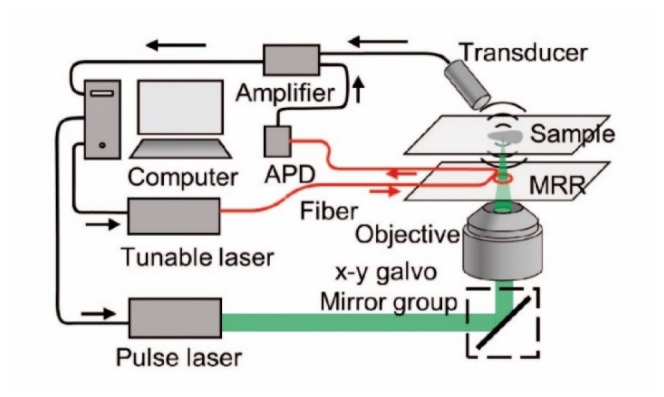
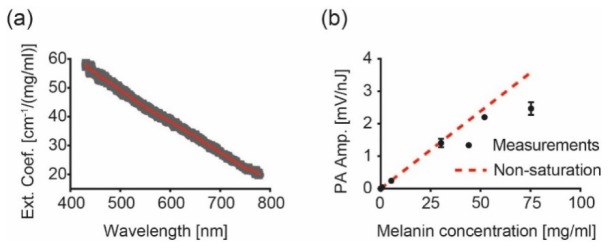
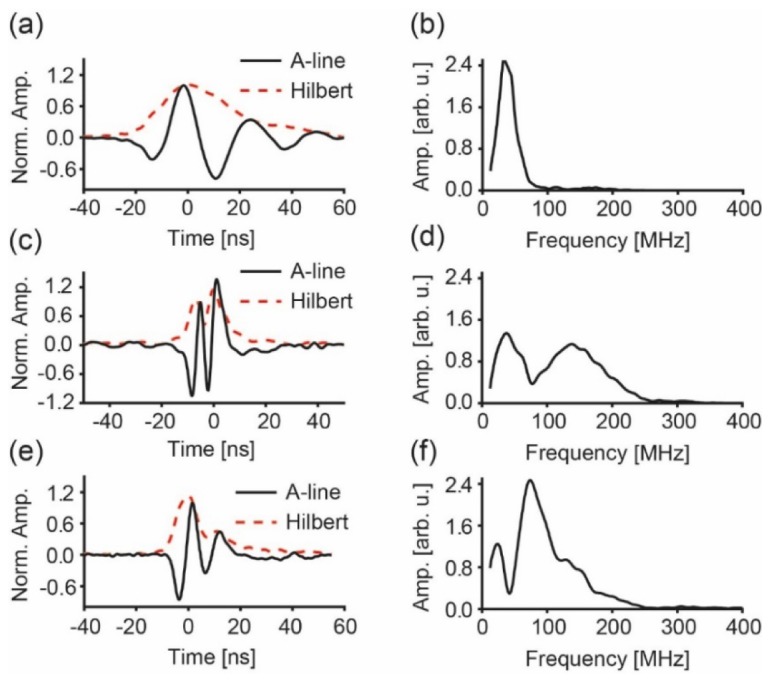
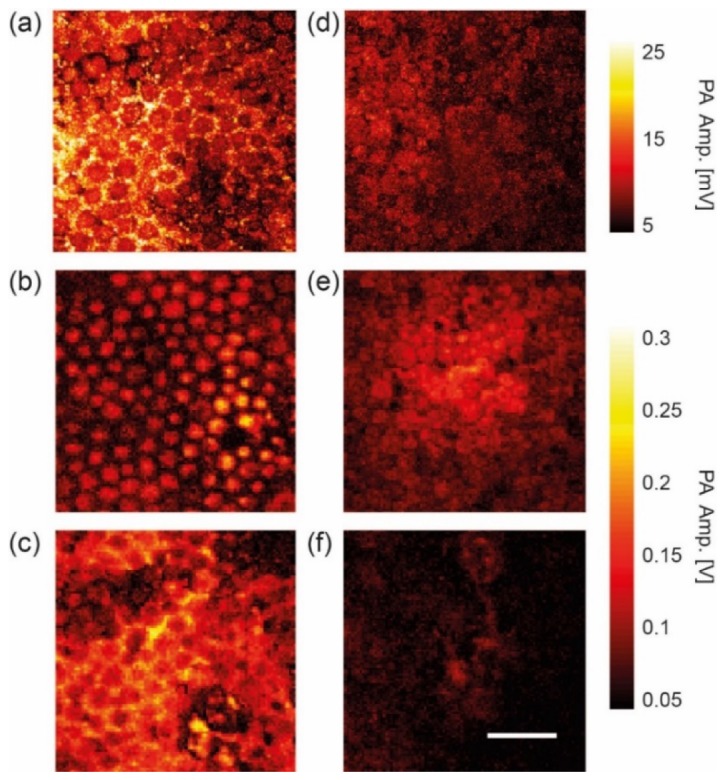
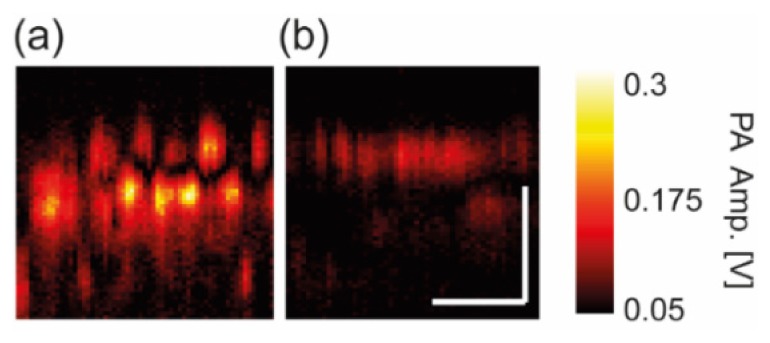
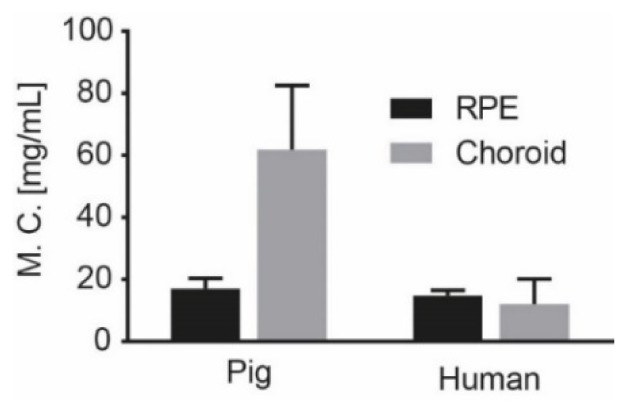
Melanin is the dominant light absorber in retinal pigment epithelium (RPE). The loss of RPE melanin is a sign of ocular senescence and is both a risk factor and a symptom of age-related macular degeneration (AMD). Quantifying the RPE melanin concentration provides insight into the pathological role of RPE in ocular aging and the onset and progression of AMD. The main challenge in accurate quantification of RPE melanin concentration is to distinguish this ten-micrometer-thick cell monolayer from the underlying choroid, which also contains melanin but carries different pathognomonic information. In this work, we investigated a three-dimensional photoacoustic microscopic (PAM) method with high axial resolution, empowered by broad acoustic detection bandwidth, to distinguish RPE from choroid and quantify melanin concentrations in the RPE ex vivo. We first conducted numerical simulation on photoacoustic generation in the RPE, which suggested that a PAM system with at least 100-MHz detection bandwidth provided sufficient axial resolution to distinguish the melanin in RPE from that in choroid. Based on simulation results, we integrated a transparent broadband micro-ring resonator (MRR) based detector in a homebuilt PAM system. We imaged ex vivo RPE-choroid complexes (RCCs) from both porcine and human eyes and quantified the absolute melanin concentrations in the RPE and choroid, respectively. In our study, the measured melanin concentrations were 14.7 mg/mL and 17.0 mg/mL in human and porcine RPE, and 12 mg/mL and 61 mg/mL in human and porcine choroid, respectively. This study suggests that broadband PAM is capable of quantifying the RPE melanin concentration from RCCs ex vivo.
Keywords: (110.5120) Photoacoustic imaging; (170.2655) Functional monitoring and imaging; (170.3880) Medical and biological imaging; (180.6900) Three-dimensional microscopy.
Figures
Similar articles
-
Monte Carlo investigation on quantifying the retinal pigment epithelium melanin concentration by photoacoustic ophthalmoscopy.J Biomed Opt. 2015 Oct;20(10):106005. doi: 10.1117/1.JBO.20.10.106005. J Biomed Opt. 2015. PMID: 26469564 Free PMC article.
-
Imaging retinal melanin: a review of current technologies.J Biol Eng. 2018 Dec 4;12:29. doi: 10.1186/s13036-018-0124-5. eCollection 2018. J Biol Eng. 2018. PMID: 30534199 Free PMC article. Review.
-
Evaluation of Retinal Pigment Epithelium and Choroidal Neovascularization in Rats Using Laser-Scanning Optical-Resolution Photoacoustic Microscopy.Ophthalmic Res. 2020;63(3):271-283. doi: 10.1159/000502800. Epub 2019 Oct 30. Ophthalmic Res. 2020. PMID: 31665740
-
X-ray microanalysis of melanin granules of retinal pigment epithelium and choroid in hereditary copper deficient mice (macular mice).Exp Eye Res. 1999 Jan;68(1):59-65. doi: 10.1006/exer.1998.0592. Exp Eye Res. 1999. PMID: 9986742
-
Does melanin turnover occur in the eyes of adult vertebrates?Pigment Cell Res. 1993 Aug;6(4 Pt 1):193-204. doi: 10.1111/j.1600-0749.1993.tb00602.x. Pigment Cell Res. 1993. PMID: 8248016 Review.
Cited by
-
Label-Free 3D Photoacoustic Imaging of Tumor Organoids for Volumetric Drug Screening.Adv Sci (Weinh). 2025 Aug;12(31):e17226. doi: 10.1002/advs.202417226. Epub 2025 Jun 4. Adv Sci (Weinh). 2025. PMID: 40464203 Free PMC article.
-
Hyperspectral optical coherence tomography for in vivo visualization of melanin in the retinal pigment epithelium.J Biophotonics. 2019 Dec;12(12):e201900153. doi: 10.1002/jbio.201900153. Epub 2019 Aug 13. J Biophotonics. 2019. PMID: 31334610 Free PMC article.
-
Melanin in the Retinal Epithelium and Magnetic Sensing: A Review of Current Studies.Biophysica. 2024 Dec;4(4):466-476. doi: 10.3390/biophysica4040030. Epub 2024 Sep 25. Biophysica. 2024. PMID: 39464574 Free PMC article.
-
Functional and structural ophthalmic imaging using noncontact multimodal photoacoustic remote sensing microscopy and optical coherence tomography.Sci Rep. 2021 Jun 1;11(1):11466. doi: 10.1038/s41598-021-90776-5. Sci Rep. 2021. PMID: 34075105 Free PMC article.
-
A comparison of optophysiological biomarkers of photoreceptor stress and phototoxicity in BALB/cJ, B6 (Cg)-Tyrc-2J/J, and C57Bl/6J mouse strains.Front Ophthalmol (Lausanne). 2023;3:1128311. doi: 10.3389/fopht.2023.1128311. Epub 2023 Mar 29. Front Ophthalmol (Lausanne). 2023. PMID: 38689597 Free PMC article.
References
-
- Liu Y., Hong L., Wakamatsu K., Ito S., Adhyaru B. B., Cheng C. Y., Bowers C. R., Simon J. D., “Comparisons of the structural and chemical properties of melanosomes isolated from retinal pigment epithelium, iris and choroid of newborn and mature bovine eyes,” Photochem. Photobiol. 81(3), 510–516 (2005).10.1562/2004-10-19-RA-345.1 - DOI - PubMed
-
- Chiarelli-Neto O., Ferreira A. S., Martins W. K., Pavani C., Severino D., Faião-Flores F., Maria-Engler S. S., Aliprandini E., Martinez G. R., Di Mascio P., Medeiros M. H., Baptista M. S., “Melanin photosensitization and the effect of visible light on epithelial cells,” PLoS One 9(11), e113266 (2014).10.1371/journal.pone.0113266 - DOI - PMC - PubMed
Grants and funding
LinkOut - more resources
Full Text Sources
Other Literature Sources
Miscellaneous