

Five-class differential diagnostics of neurodegenerative diseases using random undersampling boosting
- PMID: 28664032
- PMCID: PMC5479966
- DOI: 10.1016/j.nicl.2017.06.012
Five-class differential diagnostics of neurodegenerative diseases using random undersampling boosting
Abstract
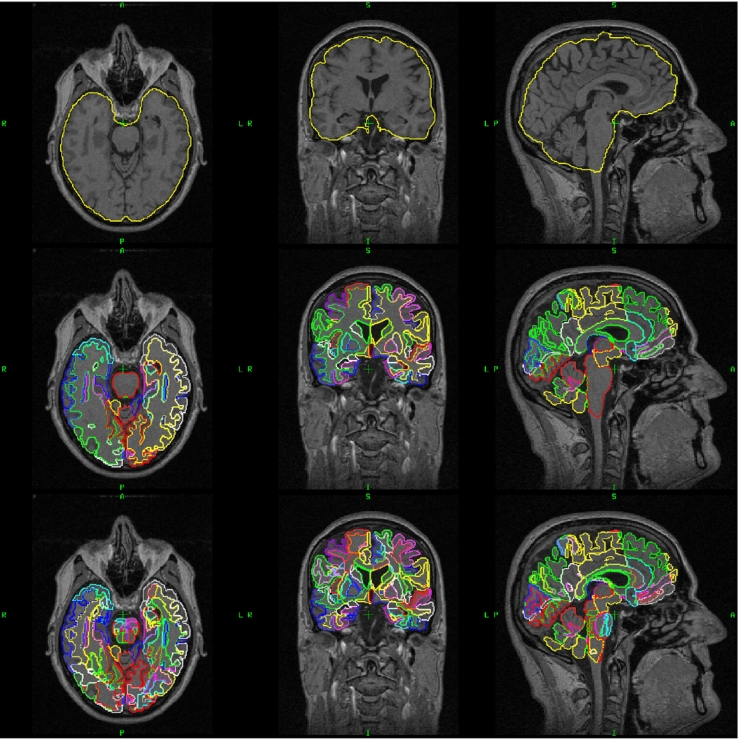
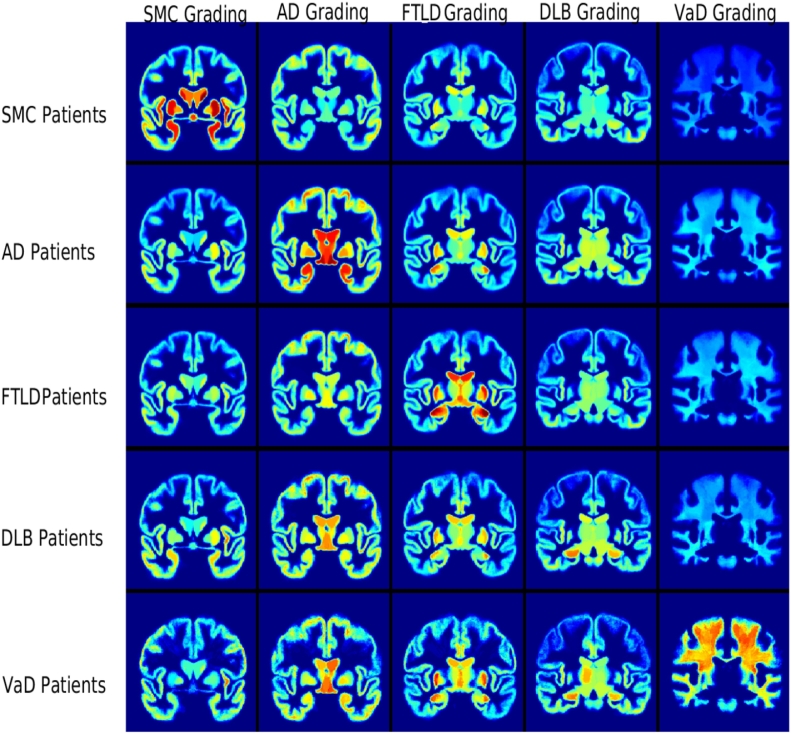
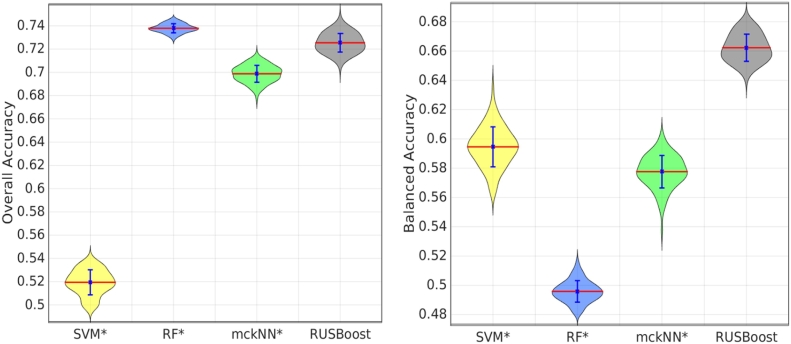
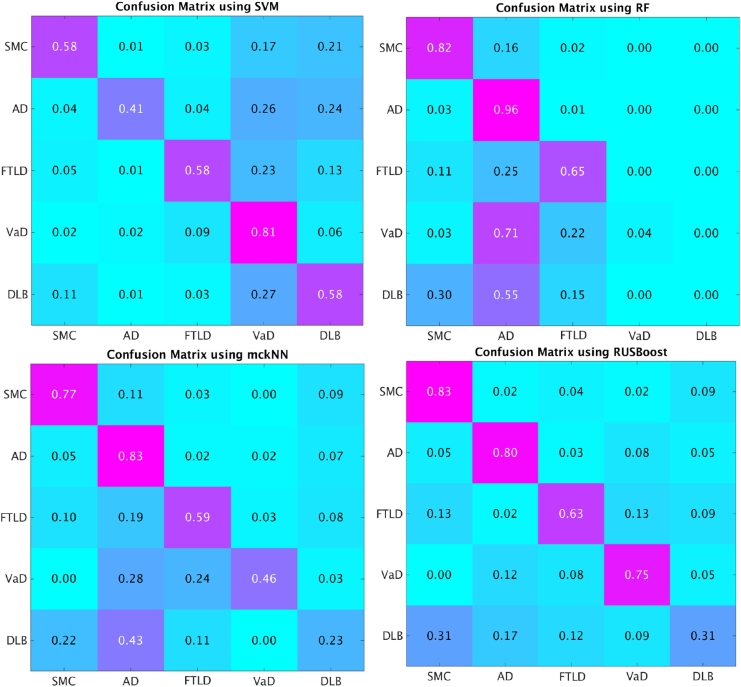
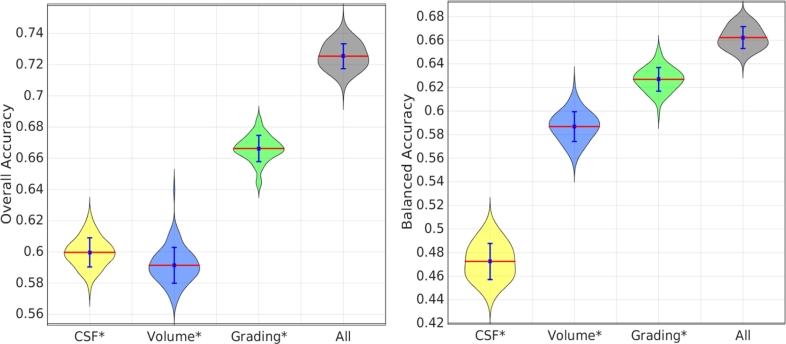
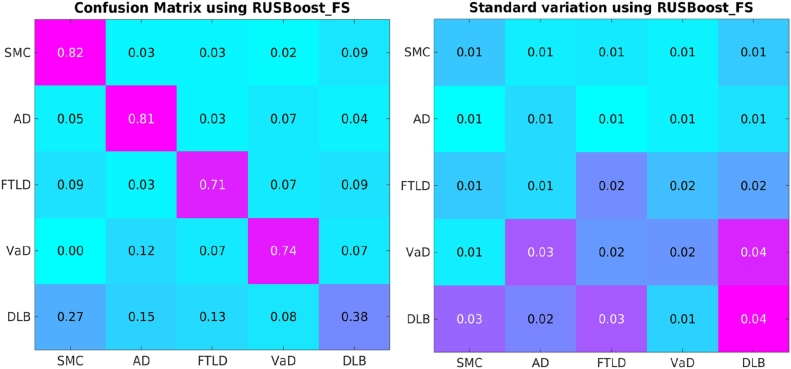
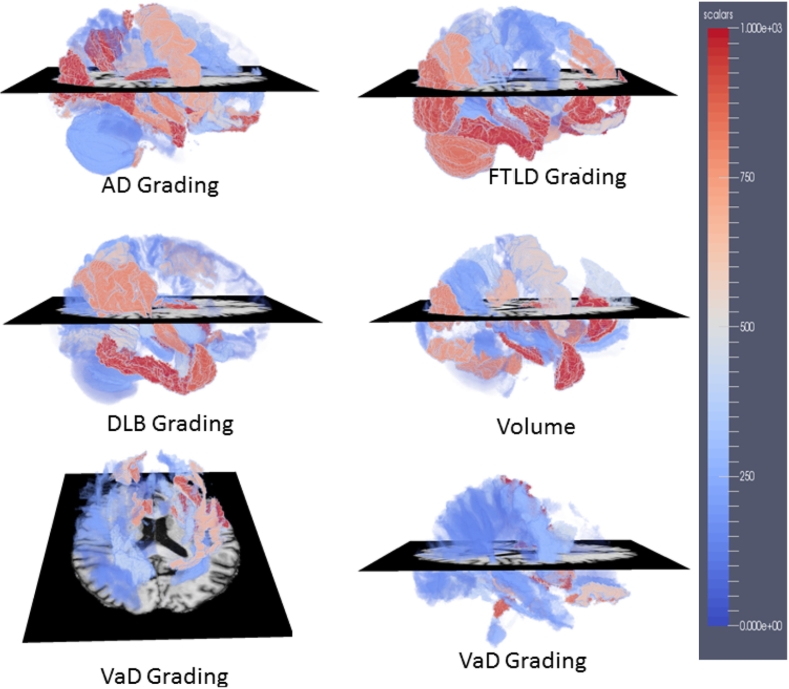
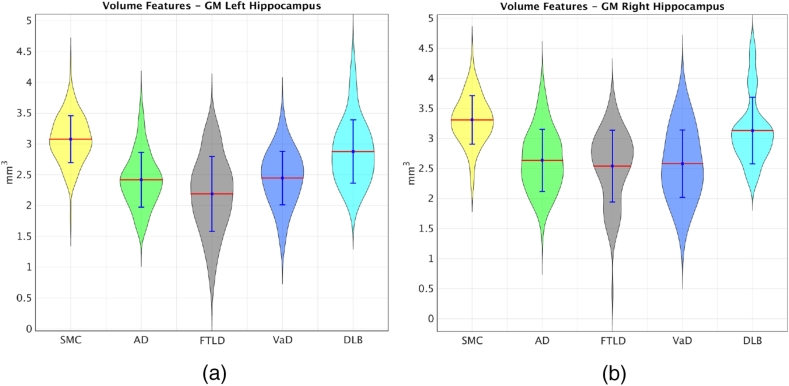
Differentiating between different types of neurodegenerative diseases is not only crucial in clinical practice when treatment decisions have to be made, but also has a significant potential for the enrichment of clinical trials. The purpose of this study is to develop a classification framework for distinguishing the four most common neurodegenerative diseases, including Alzheimer's disease, frontotemporal lobe degeneration, Dementia with Lewy bodies and vascular dementia, as well as patients with subjective memory complaints. Different biomarkers including features from images (volume features, region-wise grading features) and non-imaging features (CSF measures) were extracted for each subject. In clinical practice, the prevalence of different dementia types is imbalanced, posing challenges for learning an effective classification model. Therefore, we propose the use of the RUSBoost algorithm in order to train classifiers and to handle the class imbalance training problem. Furthermore, a multi-class feature selection method based on sparsity is integrated into the proposed framework to improve the classification performance. It also provides a way for investigating the importance of different features and regions. Using a dataset of 500 subjects, the proposed framework achieved a high accuracy of 75.2% with a balanced accuracy of 69.3% for the five-class classification using ten-fold cross validation, which is significantly better than the results using support vector machine or random forest, demonstrating the feasibility of the proposed framework to support clinical decision making.
Keywords: Dementia; Differential diagnosis; Imbalance learning; MRI; Multi-class feature selection; Neurodegenerative diseases.
Figures
References
-
- Alzheimer's Association et al. 2015 Alzheimer's disease facts and figures. Alzheimers Dement. 2015;11(3) (332–332) - PubMed
-
- Argyriou A., Evgeniou T., Pontil M. Convex multi-task feature learning. Mach. Learn. 2008;73(3):243–272.
-
- Bahnsen A.C., Aouada D., Ottersten B. 2015. Ensemble of Example-dependent Cost-sensitive Decision Trees. (arXiv preprint arXiv:1505.04637)
-
- Barber R., Ballard C., McKeith I., Gholkar A., O’brien J. MRI volumetric study of dementia with Lewy bodies: a comparison with AD and vascular dementia. Neurology. 2000;54(6):1304–1309. - PubMed
-
- Barber R., Gholkar A., Scheltens P., Ballard C., McKeith I., O’Brien J. Medial temporal lobe atrophy on MRI in dementia with Lewy bodies. Neurology. 1999;52(6) (1153–1153) - PubMed
Publication types
MeSH terms
LinkOut - more resources
Full Text Sources
Other Literature Sources
Medical
