. 2016 Nov;1(5):eaai7793.
doi: 10.1126/sciimmunol.aai7793. Epub 2016 Nov 18.

Partial exhaustion of CD8 T cells and clinical response to teplizumab in new-onset type 1 diabetes

Affiliations

Partial exhaustion of CD8 T cells and clinical response to teplizumab in new-onset type 1 diabetes

S Alice Long et al. Sci Immunol. 2016 Nov.

Abstract

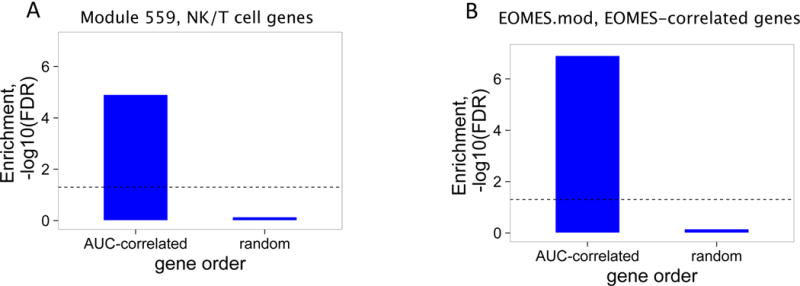
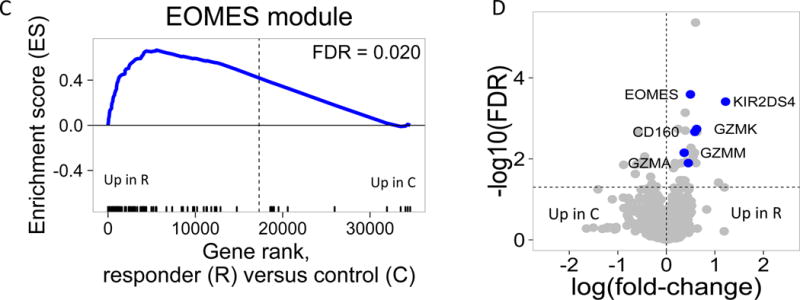
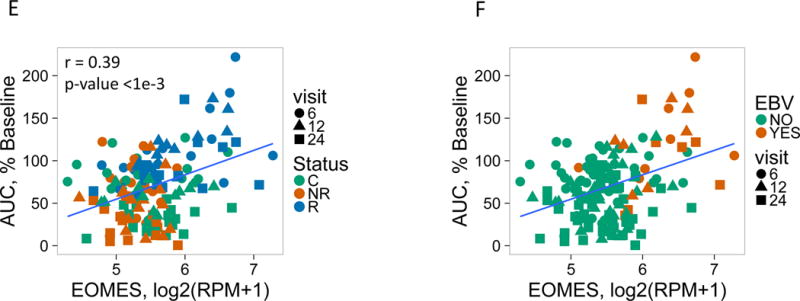
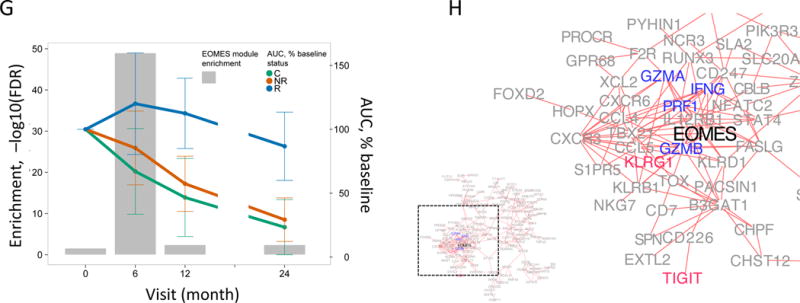
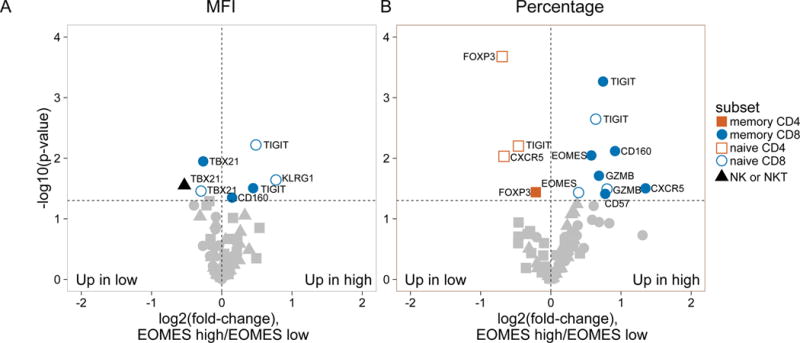
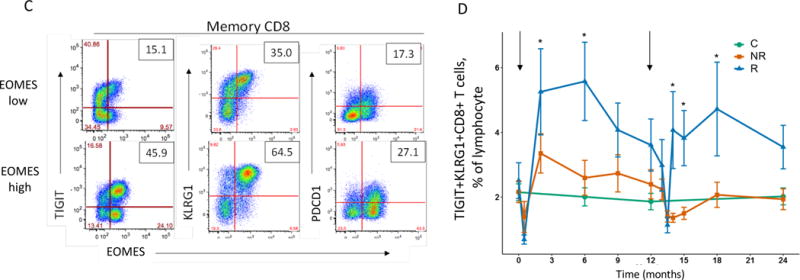
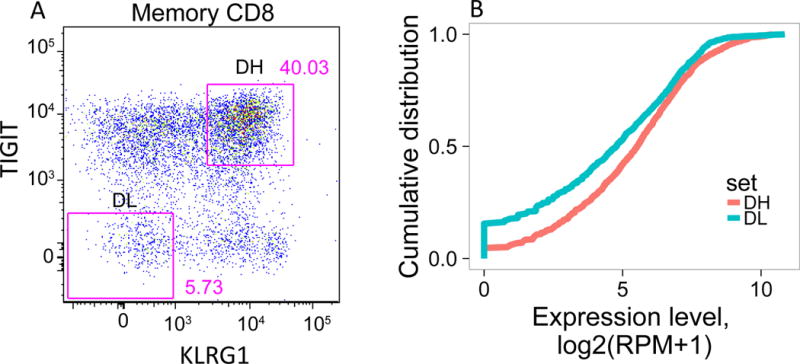
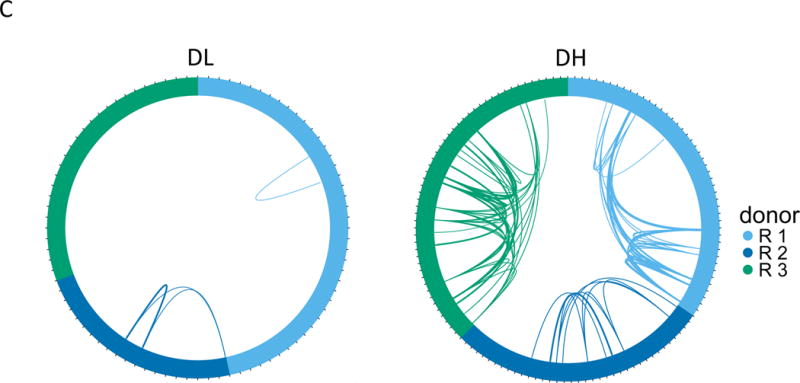
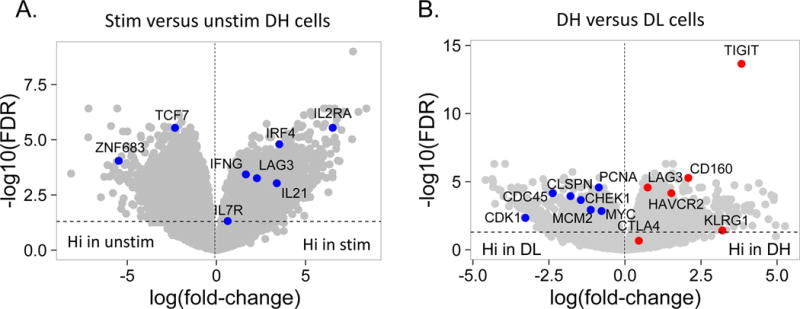
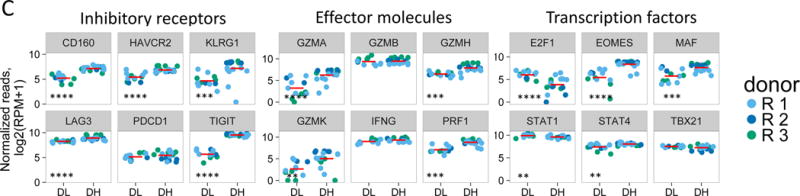
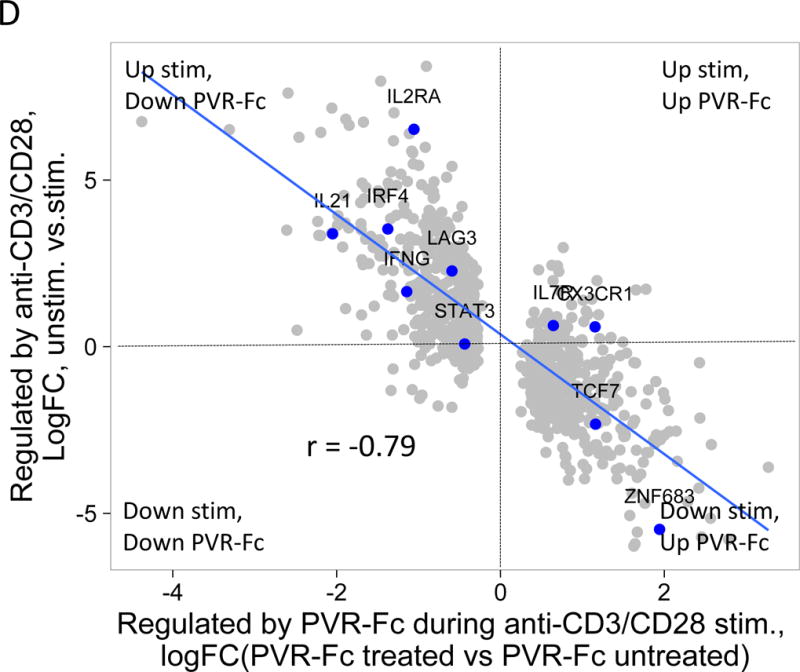
Biologic treatment of T1D typically results in transient stabilization of C-peptide levels (a surrogate for endogenous insulin secretion) in some patients, followed by progression at the same rate as in untreated control groups. Here, we used integrated systems biology and flow cytometry approaches with clinical trial blood samples to elucidate pathways associated with C-peptide stabilization in T1D subjects treated with the anti-CD3 monoclonal antibody teplizumab. We identified a population of CD8 T cells that accumulated in subjects with the best response to treatment (responders) and showed that these cells phenotypically resembled exhausted T cells by expressing high levels of the transcription factor EOMES, effector molecules, and multiple inhibitory receptors (IRs), including TIGIT and KLRG1. These cells expanded after treatment, with levels peaking after 3-6 months. To functionally characterize these exhausted-like T cells, we isolated memory CD8 TIGIT+KLRG1+ T cells from responders and showed that they exhibited expanded TCR clonotypes, indicative of prior in vivo expansion; recognized a broad-based spectrum expressed of environmental and auto-antigens; and were hypo-proliferative during polyclonal stimulation, increasing expression of IR genes and decreasing cell cycle genes. Triggering these cells with a recombinant ligand for TIGIT during polyclonal stimulation further downregulated their activation, demonstrating their exhausted phenotype was not terminal. These findings identify and functionally characterize a partially exhausted cell type associated with response to teplizumab therapy and suggest that pathways regulating T cell exhaustion may play a role in successful immune interventions for T1D.


Conflict of interest statement

Competing interests: The authors declare no competing interests.

Figures

Figure 1
Figure 1. An NK/T cell, EOMES-associated gene signature was detected in whole blood of teplizumab R subjects
(A) and (B) Bar plots of the overlap between module 559 (A) or EOMES.mod (B) and the 400 top C-peptide-correlated or randomly ordered genes. Dashed line, FDR = 0.05. (C) Blue line, enrichment score for overrepresentation of EOMES.mod genes in a list of all genes ranked by expression in R versus C samples. Solid vertical black lines, positions of EOMES.mod genes in the ranked list. Dashed vertical line, median number of genes. (D) Differential gene expression for R versus C subjects. Blue dots, selected NK/CD8 T cell genes; grey dots, all other genes. Horizontal dashed line, FDR = 0.05; vertical dashed line, log2(fold-change) = 0. (E) EOMES gene expression versus AUC. The p-value was calculated using independent permutation analysis of samples from each visit. (F) EOMES expression versus AUC, colored by EBV reactivation. (G) Overlap of AUC correlated genes (N = 300, Table S2) with the top 300 EOMES-associated genes. The right Y axis shows C-peptide AUC levels (mean + SD). (H) Left, a protein-protein interaction network of the 300 genes most highly correlated with EOMES expression. Right, expanded view of the boxed area.
Figure 2
Figure 2. Accumulation in R subjects of a CD8 cell subset marked by EOMES, KLRG1, and TIGIT protein expression
(A) and (B) Differential surface expression of mean fluorescence intensity (MFI) (A) and percentages of marker positive cells (B) in the parent lymphocyte populations. Y axis, −log10(uncorrected p-value), of difference between EOMES high versus EOMES low groups; X axis, log2 fold-change of differences. Dashed horizontal line, p-value = 0.05; dashed vertical line, log(fold-change) = 0. (C) Co-expression of EOMES with TIGIT, KLRG1, or PDCD1 in memory CD8 T cells from EOMES high (bottom row) and EOMES low individuals (top). The frequencies of double high cell populations are shown in the top right quadrant. (D) Longitudinal TIGIT and KLRG1 co-expression in total CD8 T cells from R, NR, and C subjects. Mean ± SEM are shown. Asterisks denote significant differences between R and NR subjects for each visit. Arrows indicate times of initiation of treatment courses. (E) Pie charts of the mean fractions of TIGIT+KLRG1+ cells in each subset at indicated time points.
Figure 3
Figure 3. TIGIT+KLRG1+ CD8 memory T cells from R subjects expressed expanded TCRs
(A) Gating scheme for isolation of TIGIT+KLRG1+ (Double high, DH) and TIGIT-KLRG1- (Double low, DL) populations from CD8 memory (CD8+CD45RO+ of CD3+CD56-) T cells. (B) Cumulative distribution plots for the fraction of EOMES network genes detected (Y axis) versus expression levels (X axis). This plot is representative of the three R subjects tested; the plot comprises 5 replicates for DH cells, and 4 replicates for DL cells from a single individual. (C) Each segment in the plot represents a library (or cell) yielding a TCR junction from DH cells isolated from three R subjects (Table S1, Table S4). Arcs connect cells sharing junctions, with line thickness proportional to the number of junctions shared between cells. Responders 1–3 yielded 56, 44 and 67 unique junctions, respectively, and 4, 5, and 9 expanded junctions (i.e., expressed > 1 cell) for DH cells; and 70, 30, and 49 unique junctions, and 1, 2, and 0 expanded junctions for DL cells.
Figure 4
Figure 4. DH cells upregulate multiple inhibitory receptors and down-regulate cell cycle genes during anti-CD3/anti-CD28 stimulation
(A) Differential gene expression in anti-CD3/anti-CD28 mAb stimulated versus unstimulated DH cells. Blue dots, selected CD8 T cell genes that correlate with T cell expansion in acute EBV infection (28); grey dots, all other genes Horizontal dashed line, FDR = 0.05; vertical, dashed line, log(fold-change) = 0. (B) Differential gene expression in CD3/anti-CD28 mAb stimulated DH versus DL cells. Red dots, selected inhibitory receptor genes; blue dots, selected cell cycle genes; grey dots, all other genes. (C) Gene expression of selected inhibitory receptors (left panel), effector molecules (center panel) and transcription factors (right panel) in anti-CD3/anti-CD28 stimulated DH and DL cells from three R subjects. Horizontal bars, mean values. Asterisks indicate genes that were detected as differentially expressed by Wilcoxon test (*, p-value <0.05 and ≥0.01; **, p-value <0.01 and ≥0.001; ***, p-value <0.001 and ≥0.0001; ****, p-value <0.0001). (D) Y axis, gene regulation (log(fold-change)) triggered by stimulation of DH cells (Figure 4A); X axis, gene regulation triggered by anti-CD3/anti-CD28 mAbs −/+ soluble PvR-Fc. This projection is restricted to genes regulated significantly under both conditions (FDR<0.05).

References

    1. Rigby MR, Ehlers MR. Targeted immune interventions for type 1 diabetes: not as easy as it looks! Curr Opin Endocrinol Diabetes Obes. 2014;21:271–278. - PMC - PubMed
    1. Greenbaum CJ, Schatz DA, Haller MJ, Sanda S. Through the fog: recent clinical trials to preserve β-cell function in type 1 diabetes. Diabetes. 2012;61:1323–1330. - PMC - PubMed
    1. Wållberg M, Cooke A. Immune mechanisms in type 1 diabetes. Trends Immunol. 2013;34:583–591. - PubMed
    1. Crespo J, Sun H, Welling TH, Tian Z, Zou W. T cell anergy, exhaustion, senescence, and stemness in the tumor microenvironment. Curr Opin Immunol. 2013;25:214–221. - PMC - PubMed
    1. Schietinger A, Greenberg PD. Tolerance and exhaustion: defining mechanisms of T cell dysfunction. Trends Immunol. 2014;35:51–60. - PMC - PubMed