

Codon usage analysis of photolyase encoding genes of cyanobacteria inhabiting diverse habitats
- PMID: 28664377
- PMCID: PMC5491442
- DOI: 10.1007/s13205-017-0826-2
Codon usage analysis of photolyase encoding genes of cyanobacteria inhabiting diverse habitats
Abstract
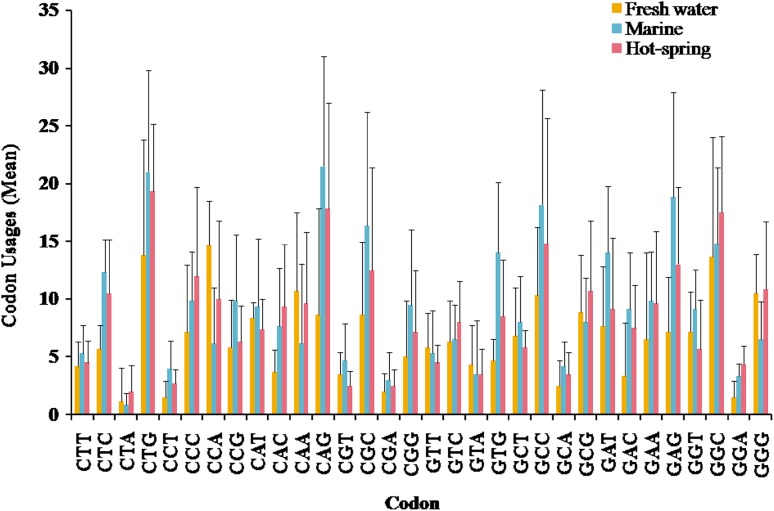
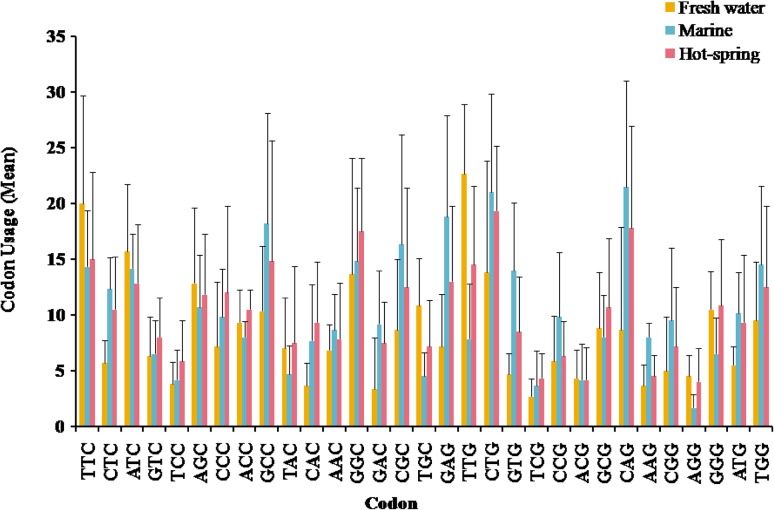
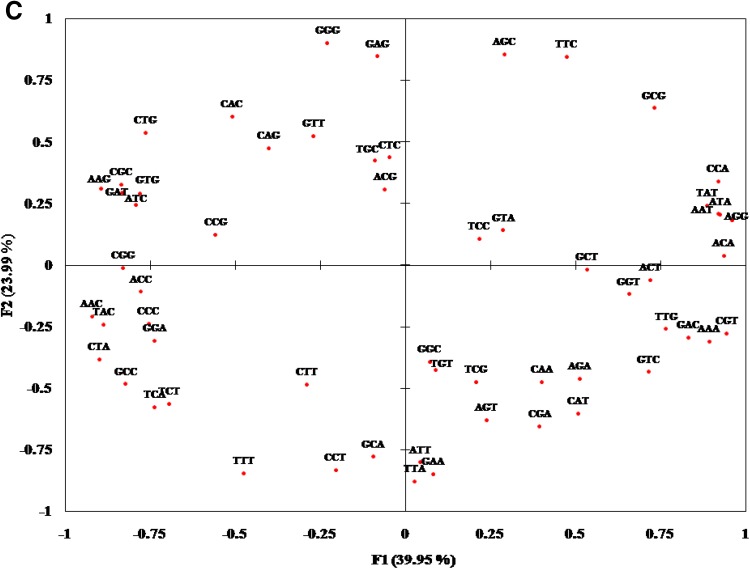
Nucleotide and amino acid compositions were studied to determine the genomic and structural relationship of photolyase gene in freshwater, marine and hot spring cyanobacteria. Among three habitats, photolyase encoding genes from hot spring cyanobacteria were found to have highest GC content. The genomic GC content was found to influence the codon usage and amino acid variability in photolyases. The third position of codon was found to have more effect on amino acid variability in photolyases than the first and second positions of codon. The variation of amino acids Ala, Asp, Glu, Gly, His, Leu, Pro, Gln, Arg and Val in photolyases of three different habitats was found to be controlled by first position of codon (G1C1). However, second position (G2C2) of codon regulates variation of Ala, Cys, Gly, Pro, Arg, Ser, Thr and Tyr contents in photolyases. Third position (G3C3) of codon controls incorporation of amino acids such as Ala, Phe, Gly, Leu, Gln, Pro, Arg, Ser, Thr and Tyr in photolyases from three habitats. Photolyase encoding genes of hot spring cyanobacteria have 85% codons with G or C at third position, whereas marine and freshwater cyanobacteria showed 82 and 60% codons, respectively, with G or C at third position. Principal component analysis (PCA) showed that GC content has a profound effect in separating the genes along the first major axis according to their RSCU (relative synonymous codon usage) values, and neutrality analysis indicated that mutational pressure has resulted in codon bias in photolyase genes of cyanobacteria.
Keywords: Codon usage bias; Cyanobacteria; Mutational pressure; Photolyase; Photoreactivation.
Conflict of interest statement
The authors declare no conflict of interest.
Figures


Similar articles
-
GC constituents and relative codon expressed amino acid composition in cyanobacterial phycobiliproteins.Gene. 2014 Aug 10;546(2):162-71. doi: 10.1016/j.gene.2014.06.024. Epub 2014 Jun 14. Gene. 2014. PMID: 24933001
-
Primary structure of murine major histocompatibility complex alloantigens: amino acid sequence of the amino-terminal one hundred and seventy-three residues of the H-2Kb glycoprotein.Biochemistry. 1980 Jan 22;19(2):306-15. doi: 10.1021/bi00543a009. Biochemistry. 1980. PMID: 6986168
-
Comparative genome analysis of six malarial parasites using codon usage bias based tools.Bioinformation. 2012;8(24):1230-9. doi: 10.6026/97320630081230. Epub 2012 Dec 8. Bioinformation. 2012. PMID: 23275725 Free PMC article.
-
Primary and tertiary structure of the principal human adenylate kinase.Eur J Biochem. 1976 Sep;68(1):281-90. doi: 10.1111/j.1432-1033.1976.tb10787.x. Eur J Biochem. 1976. PMID: 183954
-
Amino acid sequence of a ferredoxin from Bumilleriopsis filiformis, a yellow-green alga: relationship with red algae, protoflorideophyceae, and filamentous blue-green algae.J Biochem. 1983 Nov;94(5):1451-5. J Biochem. 1983. PMID: 6418731
Cited by
-
Analysis of Codon Usage Bias of 30 Chloroplast Genomes in Ulva (Ulvophyceae, Chlorophyta).Genes (Basel). 2025 May 21;16(5):608. doi: 10.3390/genes16050608. Genes (Basel). 2025. PMID: 40428430 Free PMC article.
-
Comparative genomics of thermosynechococcaceae and thermostichaceae: insights into codon usage bias.Acta Biochim Pol. 2025 Jan 8;71:13825. doi: 10.3389/abp.2024.13825. eCollection 2024. Acta Biochim Pol. 2025. PMID: 39845100 Free PMC article.
References
-
- An M, Mou S, Zhang X, Ye N, Zheng Z, Cao S, Xu D, Fan X, Wang Y, Miao J. Temperature regulates fatty acid desaturases at a transcriptional level and modulates the fatty acid profile in the Antarctic microalga Chlamydomonas sp. ICE-L. Bioresour Technol. 2013;134:151–157. doi: 10.1016/j.biortech.2013.01.142. - DOI - PubMed
LinkOut - more resources
Full Text Sources
Other Literature Sources
Miscellaneous
