

Hepatitis B virus evades innate immunity of hepatocytes but activates cytokine production by macrophages
- PMID: 28665004
- PMCID: PMC5706781
- DOI: 10.1002/hep.29348
Hepatitis B virus evades innate immunity of hepatocytes but activates cytokine production by macrophages
Abstract
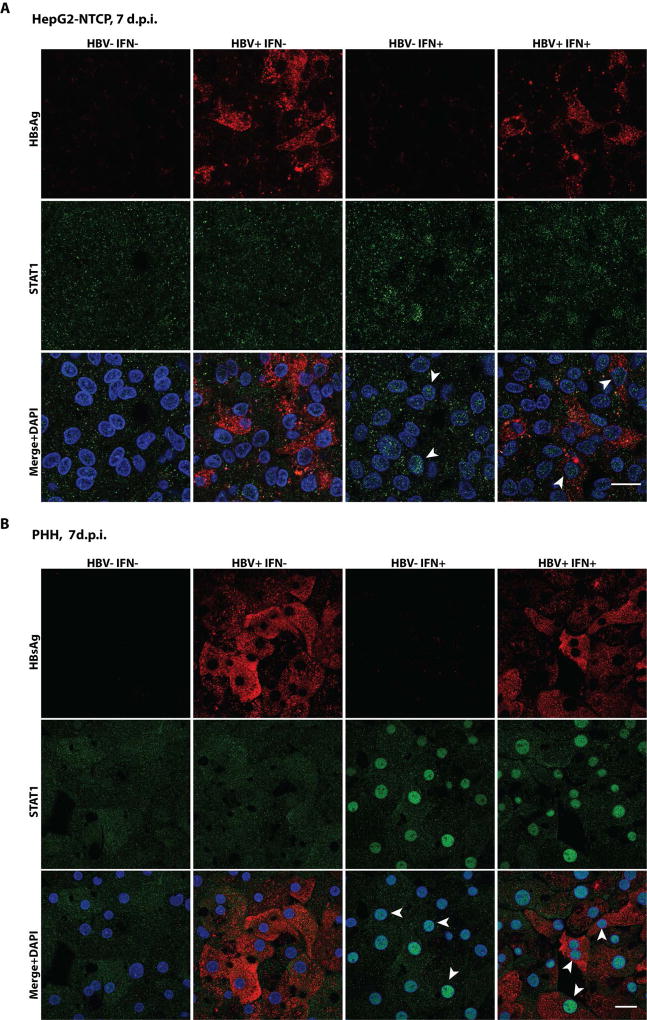
Hepatitis B virus (HBV) infects hepatocytes specifically and causes immune-mediated liver damage. How HBV interacts with the innate immunity at the early phase of infection, either with hepatocytes or other cells in the liver, remains controversial. To address this question, we utilized various human cell-culture models and humanized Alb-uPA/SCID mice. All these models were unable to mount an interferon (IFN) response despite robust HBV replication. To elucidate the mechanisms involved in the lack of IFN response, we examined whether HBV actively inhibits innate immune functions of hepatocytes. By treating HBV-infected cells with known inducers of the IFN signaling pathway, we observed no alteration of either sensing or downstream IFN response by HBV. We showed that the DNA innate sensing pathways are poorly active in hepatocytes, consistent with muted innate immune recognition of HBV. Upon exposure to high-level HBV, human macrophages could be activated with increased inflammatory cytokine expressions.
Conclusion: HBV behaves like a "stealth" virus and is not sensed by, nor actively interferes with, the intrinsic innate immunity of infected hepatocytes. Macrophages are capable of sensing HBV, but require exposure to high HBV titers, potentially explaining the long "window period" during acute infection and HBV's propensity to chronic infection. (Hepatology 2017;66:1779-1793).
© 2017 by the American Association for the Study of Liver Diseases. This article has been contributed to by U.S. Government employees and their work is in the public domain in the USA.
Figures


Similar articles
-
Hepatitis B virus polymerase disrupts K63-linked ubiquitination of STING to block innate cytosolic DNA-sensing pathways.J Virol. 2015 Feb;89(4):2287-300. doi: 10.1128/JVI.02760-14. Epub 2014 Dec 10. J Virol. 2015. PMID: 25505063 Free PMC article.
-
Hepatitis B Virus Does Not Interfere With Innate Immune Responses in the Human Liver.Gastroenterology. 2018 May;154(6):1778-1790. doi: 10.1053/j.gastro.2018.01.034. Epub 2018 Mar 19. Gastroenterology. 2018. PMID: 29408639
-
HBV Bypasses the Innate Immune Response and Does Not Protect HCV From Antiviral Activity of Interferon.Gastroenterology. 2018 May;154(6):1791-1804.e22. doi: 10.1053/j.gastro.2018.01.044. Epub 2018 Feb 1. Gastroenterology. 2018. PMID: 29410097
-
The Interactions between HBV and the Innate Immunity of Hepatocytes.Viruses. 2020 Mar 5;12(3):285. doi: 10.3390/v12030285. Viruses. 2020. PMID: 32151000 Free PMC article. Review.
-
Regulation of microRNA by hepatitis B virus infection and their possible association with control of innate immunity.World J Gastroenterol. 2014 Jun 21;20(23):7197-206. doi: 10.3748/wjg.v20.i23.7197. World J Gastroenterol. 2014. PMID: 24966589 Free PMC article. Review.
Cited by
-
Epigenetic addition of m5C to HBV transcripts promotes viral replication and evasion of innate antiviral responses.Cell Death Dis. 2024 Jan 12;15(1):39. doi: 10.1038/s41419-023-06412-9. Cell Death Dis. 2024. PMID: 38216565 Free PMC article.
-
Bioengineered Liver Cell Models of Hepatotropic Infections.Viruses. 2021 Apr 27;13(5):773. doi: 10.3390/v13050773. Viruses. 2021. PMID: 33925701 Free PMC article. Review.
-
Killing Two Birds With No Stone.Clin Liver Dis (Hoboken). 2021 Jun 4;17(5):371-374. doi: 10.1002/cld.1064. eCollection 2021 May. Clin Liver Dis (Hoboken). 2021. PMID: 34136144 Free PMC article. Review. No abstract available.
-
Innate and adaptive immunity associated with resolution of acute woodchuck hepatitis virus infection in adult woodchucks.PLoS Pathog. 2019 Dec 23;15(12):e1008248. doi: 10.1371/journal.ppat.1008248. eCollection 2019 Dec. PLoS Pathog. 2019. PMID: 31869393 Free PMC article.
-
Agonistic Activation of Cytosolic DNA Sensing Receptors in Woodchuck Hepatocyte Cultures and Liver for Inducing Antiviral Effects.Front Immunol. 2021 Oct 4;12:745802. doi: 10.3389/fimmu.2021.745802. eCollection 2021. Front Immunol. 2021. PMID: 34671360 Free PMC article.
References
-
- Schweitzer A, Horn J, Mikolajczyk RT, Krause G, Ott JJ. Estimations of worldwide prevalence of chronic hepatitis B virus infection: a systematic review of data published between 1965 and 2013. Lancet. 2015;386:1546–1555. - PubMed
-
- Stacey AR, Norris PJ, Qin L, Haygreen EA, Taylor E, Heitman J, Lebedeva M, et al. Induction of a striking systemic cytokine cascade prior to peak viremia in acute human immunodeficiency virus type 1 infection, in contrast to more modest and delayed responses in acute hepatitis B and C virus infections. J Virol. 2009;83:3719–3733. - PMC - PubMed
-
- Dunn C, Peppa D, Khanna P, Nebbia G, Jones M, Brendish N, Lascar RM, et al. Temporal analysis of early immune responses in patients with acute hepatitis B virus infection. Gastroenterology. 2009;137:1289–1300. - PubMed
Publication types
MeSH terms
Substances
Grants and funding
LinkOut - more resources
Full Text Sources
Other Literature Sources
Miscellaneous
