. 2017 Oct;24(10):1694-1704.
doi: 10.1038/cdd.2017.95. Epub 2017 Jun 30.

Germline BAP1 mutations induce a Warburg effect

Affiliations

Germline BAP1 mutations induce a Warburg effect

Angela Bononi et al. Cell Death Differ. 2017 Oct.

Abstract

Carriers of heterozygous germline BAP1 mutations (BAP1+/-) develop cancer. We studied plasma from 16 BAP1+/- individuals from 2 families carrying different germline BAP1 mutations and 30 BAP1 wild-type (BAP1WT) controls from these same families. Plasma samples were analyzed by liquid chromatography time-of-flight mass spectrometry (LC-TOF-MS), ultra-performance liquid chromatography triple quadrupole mass spectrometry (UPLC-TQ-MS), and gas chromatography time-of-flight mass spectrometry (GC-TOF-MS). We found a clear separation in the metabolic profile between BAP1WT and BAP1+/- individuals. We confirmed the specificity of the data in vitro using 12 cell cultures of primary fibroblasts we derived from skin punch biopsies from 12/46 of these same individuals, 6 BAP1+/- carriers and 6 controls from both families. BAP1+/- fibroblasts displayed increased aerobic glycolysis and lactate secretion, and reduced mitochondrial respiration and ATP production compared with BAP1WT. siRNA-mediated downregulation of BAP1 in primary BAP1WT fibroblasts and in primary human mesothelial cells, led to the same reduced mitochondrial respiration and increased aerobic glycolysis as we detected in primary fibroblasts from carriers of BAP1+/- mutations. The plasma and cell culture results were highly reproducible and were specifically and only linked to BAP1 status and not to gender, age or family, or cell type, and required an intact BAP1 catalytic activity. Accordingly, we were able to build a metabolomic model capable of predicting BAP1 status with 100% accuracy using data from human plasma. Our data provide the first experimental evidence supporting the hypothesis that aerobic glycolysis, also known as the 'Warburg effect', does not necessarily occur as an adaptive process that is consequence of carcinogenesis, but rather that it may also predate malignancy by many years and facilitate carcinogenesis.


Conflict of interest statement

MC has a pending patent applications on BAP1. MC provides consultation for mesothelioma diagnosis at no cost to patients and colleagues and for a fee to lawyers. The authors have no other relevant affiliations or financial involvement with any organization or entity with a financial interest in or financial conflict with the subject matter or materials discussed in the manuscript apart from those disclosed.

Figures

Figure 1
Figure 1
OPLS-DA analysis of metabolite profiles showed a global metabolic difference between BAP1WT and BAP1+/− individuals. (a) OPLS-DA score plot derived from, UPLC-TQ-MS and GC-TOF-MS spectral data of N=61 plasma samples (37 BAP1WT (blue dots) and 24 BAP1+/− (red dots)), K=412 variables, including identified metabolites (246) and unknowns. (b) OPLS-DA score plot of UPLC-TQ-MS and GC-TOF-MS spectral data of whole-cell extract samples from BAP1WT (N=6) and BAP1+/− (N=6) fibroblast cell cultures, K=495 variables, including identified metabolites (226) and unknowns
Figure 2
Figure 2
Genotype of BAP1WT and BAP1+/− individuals can be predicted from plasma samples using an OPLS-DA analysis of their metabolite profile independently of year of collection, age, gender, or family of origin. (ac) OPLS-DA analysis of metabolite profiles is not influenced by (a) the year of collection (2012 and 2014, displayed in the panel), (b) the age of the individuals, and (c) gender (M=male, F=female). (d) OPLS-DA analysis differentiates BAP1+/− carriers independently of family of origin. LC-TOF-MS and GC-TOF-MS were used for the metabolomic profiles of plasma samples from 22 BAP1WT subjects (blue dots), 12 BAP1+/− (red diamonds), 41 healthy controls unrelated to the W and L families (black triangles), and 1 individual of the W family with unknown BAP1 status at the time the analysis was performed – later confirmed to be BAP1WT – (purple star)
Figure 3
Figure 3
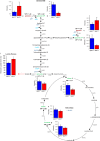
Altered metabolic pathways for the most relevant distinguishing metabolites between BAP1WT and BAP1+/− cells. Glycolysis converts glucose into pyruvate. In the presence of oxygen, in the mitochondria, pyruvate is completely oxidized and the energy is stored as ATP (aerobic metabolism). In the absence of sufficient oxygen or in tumor cells because of the Warburg effect, the pyruvate is reduced to lactate (anaerobic metabolism). (ah) Levels of glucose (a), glucose 6-P (b), glycerol (c), glycerol 3-P (d), pyruvate (e), citrate (f), fumarate (g), and malate (h) were measured in whole-cell extract samples from BAP1WT and BAP1+/− fibroblast cell cultures. Bar plots show the mean±S.E.M. of the average metabolite intensity. Our analysis (see also Supplementary Table S3) revealed decreased levels of glucose 6-P (VIP=2.42), glycerol 3-P (VIP=1.59), pyruvate (VIP=1.16), and citrate (VIP=1.71) in BAP1+/− fibroblasts. A slight reduction in the levels of other TCA cycle intermediates – fumarate and malate – was also found. Glucose (VIP=1.44) and glycerol (VIP=1.09) levels were increased in BAP1+/− fibroblasts compared with BAP1WT. *P<0.05. (i) Basal lactate secretion is increased in BAP1+/− fibroblasts compared with BAP1WT. The amount of lactate released (dotted red arrow) in the cell culture media was determined using a colorimetric assay; data shown as mean±S.E.M. of three independent experiments; *P<0.05. ACO, aconitase; ADP, Adenosine diphosphate; ALDO, aldolase; ATP, adenosine triphosphate; CS, citrate synthase; ENO, enolase; FH, fumarate hydratase; GPD, glycerol-3-phosphate dehydrogenase; GAPDH, glyceraldehyde-3-phosphate dehydrogenase; GPI, glucose-6-phosphate isomerase; IDH, isocitrate dehydrogenase; LDH, lactate dehydrogenase; MDH, malate dehydrogenase; PDK, pyruvate dehydrogenase kinase; PFK, phosphofructokinase; PGAM, phosphoglycerate mutase; PGK, phosphoglycerate kinase; PKM, pyruvate kinase; OGDH, oxoglutarate (alpha-ketoglutarate) dehydrogenase; SUCL, succinate-CoA ligase; SDH, succinate dehydrogenase; TPI, triosephosphate isomerase
Figure 4
Figure 4
Levels of 13C-metabolites in culture medium and cells after culturing BAP1WT and BAP1+/− cells with 13C-glucose for 24 h. BAP1WT and BAP1+/− fibroblasts were incubated in 13C-glucose medium. (a) 13C-glucose consumption rate measured in tissue culture medium from BAP1WT and BAP1+/− cells. (bd) 13C incorporation into 13C-glucose (b), 13C-glucose 6-P (c), and 13C-citrate (d) measured in cell extracts from BAP1WT and BAP1+/− cells. (e) Extracellular concentration of 13C-lactate produced by BAP1WT and BAP1+/− fibroblasts after 24 h of cell culture using 13C-glucose medium. Bar plots show the mean±S.E.M.; *P<0.05
Figure 5
Figure 5
BAP1+/− fibroblasts have increased glycolytic activity and decreased intracellular ATP. (a) ECAR was recorded over time in BAP1WT and BAP1+/− fibroblasts with the Seahorse XF96 extracellular flux analyzer. ECAR can be further dissected into different modules as depicted in the upper left scheme. The initial administration of a saturating concentration of glucose activates the glycolytic pathway producing NADH, protons, H2O, and ATP. Protons induce a rapid increase in ECAR. The following inhibition of mitochondrial ATP synthesis with Oligomycin A shifts the energy production to glycolysis and induces an additional increase in ECAR. Finally, inhibition of glycolysis with 2-deoxyglucose (2-DG) causes a strong decrease in ECAR levels, confirming that the ECAR observed was generated by the glycolytic activity of the cells. Representative experiments performed in BAP1WT and BAP1+/− fibroblasts are displayed on the right panel. (b) Levels of glycolysis and maximal glycolytic capacity in BAP1WT and BAP1+/− fibroblasts. The western blotting (WB) shows the amounts of WT BAP1 in total cell lysates of BAP1WT and BAP1+/− fibroblasts. (c and d) Rate of glycolysis and maximal glycolytic capacity in (c) BAP1WT fibroblasts transfected with a pool of siRNAs targeting BAP1, and (d) BAP1+/− fibroblasts transduced with adenoviruses for BAP1 (AdBAP1), its catalytic inactive mutant BAP1(C91S) (AdBAP1(C91S)), or GFP as control (AdGFP). In panel (b), the WB shows BAP1 protein levels in BAP1WT fibroblasts silenced for BAP1. Fibroblasts were transfected with control scrambled siRNA or siBAP1 (a pool of four different siRNAs targeting BAP1: siBAP1#1, siBAP1#2, siBAP1#3, and siBAP1#5). In panel (c), the WB shows BAP1 protein levels in BAP1+/− fibroblasts transduced with AdBAP1, catalytically inactive AdBAP1(C91S), or control (AdGFP). (e) Total levels of intracellular ATP are reduced in BAP1+/− fibroblasts compared with BAP1WT. Bar plots show the mean±S.E.M. of three independent experiments; **P<0.01, *P<0.05
Figure 6
Figure 6
Mitochondrial respiratory function is impaired in BAP1+/− cells. (a) OCR was analyzed in real time using the Seahorse XF96 extracellular flux analyzer. When Oligomycin A is added, the ATP synthase complex is inhibited, therefore the respiratory chain-associated oxygen consumption is inhibited. Addition of the ATP synthesis uncoupler FCCP induces the maximal oxygen consumption by the respiratory chain. Addition of rotenone and antimycinA (Rot/AntA, complex I and III inhibitors, respectively) blocks the electron transfer as well as oxygen consumption by the respiratory chain. Displayed on the left is a representative experiment showing the different parameters that can be measured and used to determine mitochondrial respiratory function: basal respiration (OCR-BASAL), ATP production (OCR-ATP), maximal respiration (OCR-MMR), and spare respiratory capacity (OCR-SRC). Representative experiments performed in BAP1WT and BAP1+/− fibroblasts are shown on the right. (b) Reduced OCR-BASAL, OCR-ATP, OCR-MMR, and OCR-SRC in BAP1+/− fibroblasts compared with BAP1WT, indicating an overall impaired mitochondria-linked aerobic respiration and ATP production in germline mutated BAP1+/− cells. (c and d) Levels of OCR-BASAL, OCR-ATP, OCR-MMR, and OCR-SRC in (c) BAP1WT fibroblasts transfected with a pool of siRNAs targeting BAP1 and (d) BAP1+/− fibroblasts transduced with adenoviruses (Ad) for BAP1 (AdBAP1), its catalytic inactive mutant AdBAP1(C91S), or GFP as control (AdGFP). Bar plots show the mean±S.E.M. of three independent experiments. **P<0.01, *P<0.05

References

    1. Testa JR, Cheung M, Pei J, Below JE, Tan Y, Sementino E et al. Germline BAP1 mutations predispose to malignant mesothelioma. Nat Genet 2011; 43: 1022–1025. - PMC - PubMed
    1. Carbone M, Ferris LK, Baumann F, Napolitano A, Lum CA, Flores EG et al. BAP1 cancer syndrome: malignant mesothelioma, uveal and cutaneous melanoma, and MBAITs. J Transl Med 2012; 10: 179. - PMC - PubMed
    1. Wiesner T, Obenauf AC, Murali R, Fried I, Griewank KG, Ulz P et al. Germline mutations in BAP1 predispose to melanocytic tumors. Nat Genet 2011; 43: 1018–1021. - PMC - PubMed
    1. Popova T, Hebert L, Jacquemin V, Gad S, Caux-Moncoutier V, Dubois-d'Enghien C et al. Germline BAP1 mutations predispose to renal cell carcinomas. Am J Hum Genet 2013; 92: 974–980. - PMC - PubMed
    1. Farley MN, Schmidt LS, Mester JL, Pena-Llopis S, Pavia-Jimenez A, Christie A et al. A novel germline mutation in BAP1 predisposes to familial clear-cell renal cell carcinoma. Mol Cancer Res 2013; 11: 1061–1071. - PMC - PubMed

LinkOut - more resources