. 2017 Jun 30:8:16099.
doi: 10.1038/ncomms16099.

Cryo-EM structure of haemoglobin at 3.2 Å determined with the Volta phase plate

Affiliations

Cryo-EM structure of haemoglobin at 3.2 Å determined with the Volta phase plate

Maryam Khoshouei et al. Nat Commun. .

Abstract

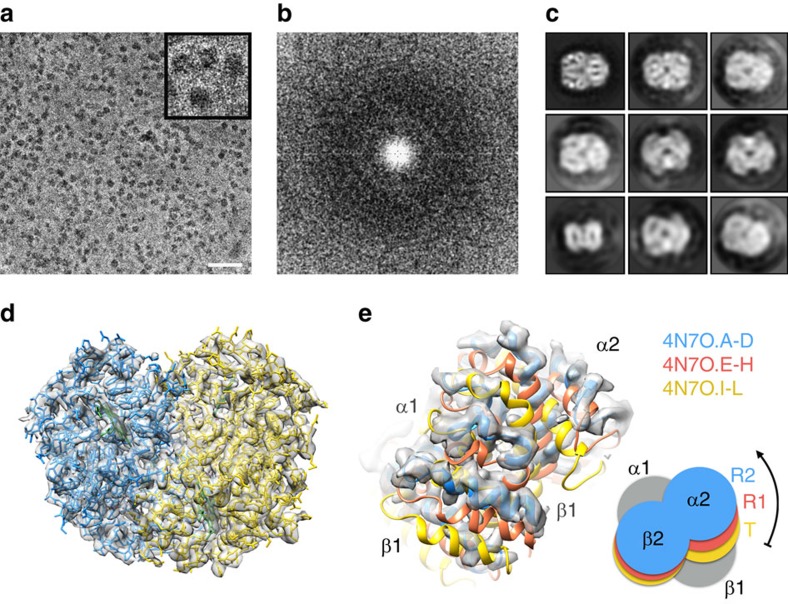
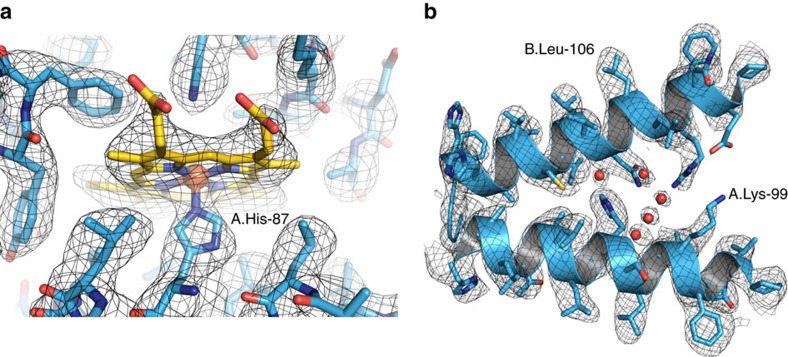
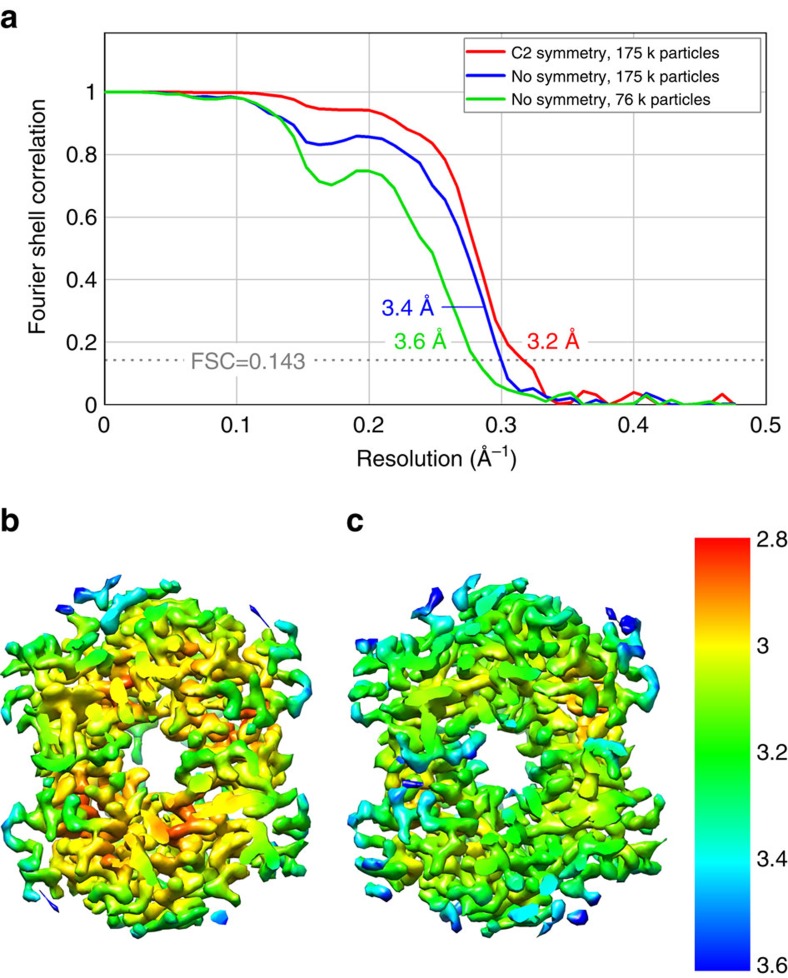
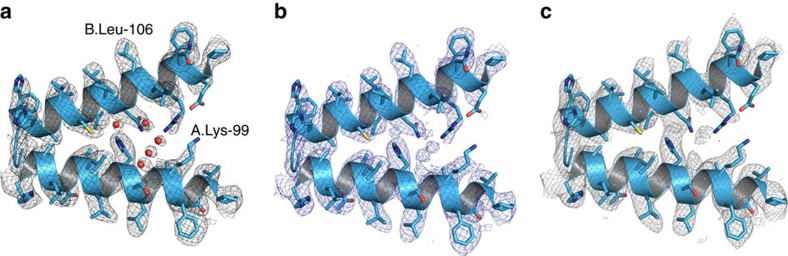
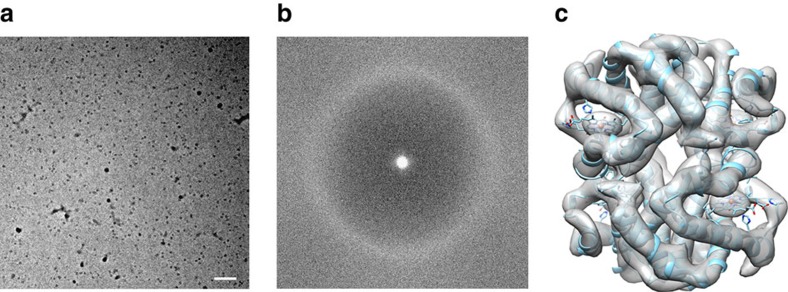
With the advent of direct electron detectors, the perspectives of cryo-electron microscopy (cryo-EM) have changed in a profound way. These cameras are superior to previous detectors in coping with the intrinsically low contrast and beam-induced motion of radiation-sensitive organic materials embedded in amorphous ice, and hence they have enabled the structure determination of many macromolecular assemblies to atomic or near-atomic resolution. Nevertheless, there are still limitations and one of them is the size of the target structure. Here, we report the use of a Volta phase plate in determining the structure of human haemoglobin (64 kDa) at 3.2 Å. Our results demonstrate that this method can be applied to complexes that are significantly smaller than those previously studied by conventional defocus-based approaches. Cryo-EM is now close to becoming a fast and cost-effective alternative to crystallography for high-resolution protein structure determination.


Conflict of interest statement

R.D. is a co-inventor with no financial benefits in US patent US9129774 B2 ‘Method of using a phase plate in a transmission electron microscope’. W.B. is on the Scientific Advisory Board and M.R. an employee of the FEI Company. The remaining author declares no competing financial interests.

Figures

Figure 1
Figure 1. Phase plate imaging of 64 kDa Hgb.
(a) Electron micrograph of metHgb recorded at ∼500 nm underfocus with the Volta phase plate (VPP) (scale bar, 30 nm). (b) Power spectrum of the image in a, featuring contrast transfer function (CTF) Thon rings permitting defocus and phase shift estimation. (c) The 2D class averages of Hgb showing secondary structure elements in projection. (d) Reconstructed 3D electron scattering potential map and model of Hgb. (e) VPP reconstruction fitted with three conformers of Hgb present in crystal structure PDB 4N7O. The reconstructed 3D map agrees best with chains A–D of PDB 4N7O representing the R2 state of Hgb.
Figure 2
Figure 2. Hgb at 3.2 Å resolution.
(a) The iron atom of the prosthetic haem group is coordinated by the proximal histidine residue, as evidenced by a strong density connecting them. (b) Side-chain details and putative water molecules in the 3D electron scattering potential map (red spheres).
Figure 3
Figure 3. Resolution estimation.
(a) Fourier shell correlation (FSC) plots indicating resolutions of 3.2 Å for the C2 symmetry (red line), 3.4 Å for the asymmetric (blue line) and 3.6 Å for the subset asymmetric (green line) reconstructions according to the FSC=0.143 criterion. (b) Local resolution estimation of the C2 symmetry map. (c) Local resolution estimation of the asymmetric map.
Figure 4
Figure 4. Comparison of 3D density maps.
Representative side-chain densities in reconstructions with (a) imposed C2 symmetry, (b) no imposed symmetry and (c) no imposed symmetry using a subset of 76,150 particles.
Figure 5
Figure 5. Validation of water molecules.
(a) C2 symmetry reconstruction showing a water molecule density in the same location as observed in a crystal structure (b) (PDB-2DN1). (c,d) Same as (a) overlaid with two conjugate locations in the asymmetric reconstruction.
Figure 6
Figure 6. In-focus phase plate imaging of 64 kDa Hgb.
(a) Electron micrograph of metHgb recorded at ∼20 nm underfocus with the Volta phase plate (VPP) (scale bar, 50 nm). (b) Power spectrum of the image in a, featuring continuous signal without CTF oscillations across the frequency spectrum and visibility of the amorphous ice ring at 3.7 Å. (c) Reconstructed 3D electron scattering potential map and fitted model of Hgb from crystal structure PDB-1A9W.

Similar articles

Cited by

References

    1. Nogales E. & Scheres S. H. Cryo-EM: a unique tool for the visualization of macromolecular complexity. Mol. Cell 58, 677–689 (2015). - PMC - PubMed
    1. Merk A. et al.. Breaking cryo-EM resolution barriers to facilitate drug discovery. Cell 165, 1698–1707 (2016). - PMC - PubMed
    1. Sigworth F. J. Principles of cryo-EM single-particle image processing. Microscopy (Oxf) 65, 57–67 (2016). - PMC - PubMed
    1. Henderson R. The potential and limitations of neutrons, electrons and X-rays for atomic resolution microscopy of unstained biological molecules. Q. Rev. Biophys. 28, 171–193 (1995). - PubMed
    1. Glaeser R. M. Review: electron crystallography: present excitement, a nod to the past, anticipating the future. J. Struct. Biol. 128, 3–14 (1999). - PubMed

Publication types