Industry-Wide Surveillance of Marek's Disease Virus on Commercial Poultry Farms
- PMID: 28665725
- PMCID: PMC6329004
- DOI: 10.1637/11525-110216-Reg.1
Industry-Wide Surveillance of Marek's Disease Virus on Commercial Poultry Farms
Abstract
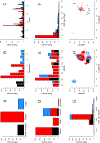
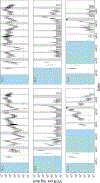
Marek's disease virus is a herpesvirus of chickens that costs the worldwide poultry industry more than US$1 billion annually. Two generations of Marek's disease vaccines have shown reduced efficacy over the last half century due to evolution of the virus. Understanding where the virus is present may give insight into whether continued reductions in efficacy are likely. We conducted a 3-yr surveillance study to assess the prevalence of Marek's disease virus on commercial poultry farms, determine the effect of various factors on virus prevalence, and document virus dynamics in broiler chicken houses over short (weeks) and long (years) timescales. We extracted DNA from dust samples collected from commercial chicken and egg production facilities in Pennsylvania, USA. Quantitative PCR was used to assess wild-type virus detectability and concentration. Using data from 1018 dust samples with Bayesian generalized linear mixed effects models, we determined the factors that correlated with virus prevalence across farms. Maximum likelihood and autocorrelation function estimation on 3727 additional dust samples were used to document and characterize virus concentrations within houses over time. Overall, wild-type virus was detectable at least once on 36 of 104 farms at rates that varied substantially between farms. Virus was detected in one of three broiler-breeder operations (companies), four of five broiler operations, and three of five egg layer operations. Marek's disease virus detectability differed by production type, bird age, day of the year, operation (company), farm, house, flock, and sample. Operation (company) was the most important factor, accounting for between 12% and 63.4% of the variation in virus detectability. Within individual houses, virus concentration often dropped below detectable levels and reemerged later. These data characterize Marek's disease virus dynamics, which are potentially important to the evolution of the virus.
Keywords: Marek's disease virus; epidemiology; surveillance; vaccine escape; virulence evolution.
Figures


Similar articles
-
First report on the molecular characterization and phylogenetic analysis of meq oncogene from virulent serotype-1 Marek's disease virus in laying hen flocks and broiler breeders in Algeria.Comp Immunol Microbiol Infect Dis. 2025 Jun;120:102358. doi: 10.1016/j.cimid.2025.102358. Epub 2025 May 11. Comp Immunol Microbiol Infect Dis. 2025. PMID: 40367867
-
Development, application, and results of routine monitoring of Marek's disease virus in broiler house dust using real-time quantitative PCR.Avian Dis. 2013 Jun;57(2 Suppl):544-54. doi: 10.1637/10380-92112-REG.1. Avian Dis. 2013. PMID: 23901774
-
Marek's Disease Virus in Commercial Turkey Flocks, Iran.Avian Dis. 2023 Sep;67(3):269-272. doi: 10.1637/aviandiseases-D-23-00028. Avian Dis. 2023. PMID: 39126414
-
Marek's disease vaccines: a solution for today but a worry for tomorrow?Vaccine. 2008 Jul 18;26 Suppl 3:C31-41. doi: 10.1016/j.vaccine.2008.04.009. Vaccine. 2008. PMID: 18773529 Review.
-
The Leeuwenhoek Lecture, 1997. Marek's disease herpesvirus: oncogenesis and prevention.Philos Trans R Soc Lond B Biol Sci. 1997 Dec 29;352(1364):1951-62. doi: 10.1098/rstb.1997.0181. Philos Trans R Soc Lond B Biol Sci. 1997. PMID: 9451743 Free PMC article. Review.
Cited by
-
Occurrence of Marek's Disease in Poland on the Basis of Diagnostic Examination in 2015-2018.J Vet Res. 2020 Dec 1;64(4):503-507. doi: 10.2478/jvetres-2020-0079. eCollection 2020 Dec. J Vet Res. 2020. PMID: 33367138 Free PMC article.
-
Development of a one-run real-time PCR detection system for pathogens associated with poultry infectious diseases.J Vet Med Sci. 2023 Mar 30;85(4):407-411. doi: 10.1292/jvms.22-0482. Epub 2023 Mar 16. J Vet Med Sci. 2023. PMID: 36792182 Free PMC article.
-
DNA from Dust: Comparative Genomics of Large DNA Viruses in Field Surveillance Samples.mSphere. 2016 Oct 5;1(5):e00132-16. doi: 10.1128/mSphere.00132-16. eCollection 2016 Sep-Oct. mSphere. 2016. PMID: 27747299 Free PMC article.
-
A Novel Time-resolved Fluorescence Immunochromatographic Strip for the Diagnosis of Avian Infectious Bronchitis Virus.J Fluoresc. 2025 Aug 22. doi: 10.1007/s10895-025-04483-9. Online ahead of print. J Fluoresc. 2025. PMID: 40844580
-
Critical roles of non-coding RNAs in lifecycle and biology of Marek's disease herpesvirus.Sci China Life Sci. 2023 Feb;66(2):251-268. doi: 10.1007/s11427-022-2258-4. Epub 2023 Jan 5. Sci China Life Sci. 2023. PMID: 36617590 Free PMC article. Review.
References
-
- Atkins KE, Read AF, Savill NJ, Renz KG, Islam AFM, Walkden-Brown SW, and Woolhouse MEJ Vaccination and reduced cohort duration can drive virulence evolution: Marek’s disease virus and industrialized agriculture. Evolution 67:851–860. 2013. - PubMed
-
- Baigent SJ, Smith LP, Currie RJW, and Nair VK Replication kinetics of Marek’s disease vaccine virus in feathers and lymphoid tissues using PCR and virus isolation. J. Gen. Virol 86:2989–2998. 2005. - PubMed
-
- Biggs PM, Powell DG, Churchill AE, and Chubb RC The epizootiology of Marek’s disease: I. Incidence of antibody, viraemia and Marek’s disease in six flocks. Avian Pathol 1:5–25. 1972. - PubMed
MeSH terms
Grants and funding
LinkOut - more resources
Full Text Sources
Other Literature Sources

