. 2017 Jun 29;170(1):127-141.e15.
doi: 10.1016/j.cell.2017.06.016.

IFNγ-Dependent Tissue-Immune Homeostasis Is Co-opted in the Tumor Microenvironment

Affiliations

IFNγ-Dependent Tissue-Immune Homeostasis Is Co-opted in the Tumor Microenvironment

Christopher J Nirschl et al. Cell. .

Abstract

Homeostatic programs balance immune protection and self-tolerance. Such mechanisms likely impact autoimmunity and tumor formation, respectively. How homeostasis is maintained and impacts tumor surveillance is unknown. Here, we find that different immune mononuclear phagocytes share a conserved steady-state program during differentiation and entry into healthy tissue. IFNγ is necessary and sufficient to induce this program, revealing a key instructive role. Remarkably, homeostatic and IFNγ-dependent programs enrich across primary human tumors, including melanoma, and stratify survival. Single-cell RNA sequencing (RNA-seq) reveals enrichment of homeostatic modules in monocytes and DCs from human metastatic melanoma. Suppressor-of-cytokine-2 (SOCS2) protein, a conserved program transcript, is expressed by mononuclear phagocytes infiltrating primary melanoma and is induced by IFNγ. SOCS2 limits adaptive anti-tumoral immunity and DC-based priming of T cells in vivo, indicating a critical regulatory role. These findings link immune homeostasis to key determinants of anti-tumoral immunity and escape, revealing co-opting of tissue-specific immune development in the tumor microenvironment.

Keywords: IFNγ; dendritic cells; differentiation; homeostasis; immunotherapy; melanoma; suppressor-of-cytokine-signaling 2 (SOCS2); tissue mononuclear phagocytes; tolerance; tumor microenvironment.


Figures

Figure 1
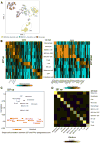
Figure 1. Enriched Expression of a Species-Conserved 227 Homeostatic Signature at Tissue Entry across Mononuclear Phagocyte Lineages and at Multiple Stages of Differentiation and Development
(A–E) 227-gene signatures were derived from classical DCs in datasets GEO: GSE35459 and GEO: GSE53588. Gene expression analysis was mapped across individual samples of mononuclear phagocytes in the following datasets: (A) GEO: GSE35459, comparing human blood DCs and monocytes to skin DCs and monocyte-derived macrophages; (B) GEO: GSE49358, comparing murine dermal DCs and monocytes to those that have migrated to the LN, with and without DNFB—a contact sensitizing agent; (C) GEO: GSE53588, comparing murine skin derived migDCs in LN to LN-resident cDCs from Flt3L treated mice; (D) GEO: GSE60782, comparing murine cDC progenitors (pre-DC subtypes) in bone marrow to differentiated spleen-resident cDCs; and (E) GEO: GSE66970, comparing embryonic liver and adult bone marrow mononuclear phagocyte progenitors to differentiated embryonic skin monocytes and macrophages. (F) Schematic mapping of each analyzed set to the selected developmental transition or tissue-based comparison. Triangles indicate a defined transition in either progenitor differentiation or tissue entry as detailed in Table S1A. See also Figure S1.
Figure 2
Figure 2. IFNγ Is Sufficient and Necessary to Induce 227-Gene Transcripts in Human Mononuclear Phagocytes and Human Skin
(A) 227-signature expression analysis of transcripts derived from paired PBMC specimens from six individuals. Human PBMCs were selected for monocytes by adherence, cultured for 7 days with M-CSF, and treated for 24 hr with (A) IFNγ, IL-17, IL-4, LPS, LPS + IFNγ, or TNFα (paired conditions per patient, GEO: GSE18686). (B) 227-signature expression analysis in paired skin biopsy specimens obtained from 3 different sites of the same individual: normal healthy skin and skin taken 24 hr after either injection of IFNγ or injection of placebo (vehicle control) from 10 healthy individuals or psoriasis patients (GEO: GSE32407). (C) Unsupervised hierarchical clustering based on the Pearson correlation of log2(FCH) for each defined comparison within each of the 7 datasets, testing genes within the 227 signatures (left) or all possible overlapping transcripts (right). Values in each cell represent the Pearson correlation and significance levels are represented as *p < 0.05, **p < 0.01, ***p < 0.001. Comparison sets are listed as follows: A. Blood versus skin (human), GEO: GSE35459. B. Dermal versus migrated, GEO: GSE49358. C. Draining LN skin migratory DC (migDC) versus LN resident CD8α cDC, GEO: GSE53588. D. Pre-DC from bone marrow versus cDC from spleen, GEO: GSE60782. E. Adult bone marrow and fetal liver embryonic progenitors versus macrophages and monocytes in fetal skin, GEO: GSE66970 F. IFNγ and IFNγ + LPS versus all other treatments from human monocyte-derived macrophages in vitro, GEO: GSE18686. G. IFNγ injected skin versus placebo/ control from healthy human volunteers and psoriasis patients ex vivo, GEO: GSE32407. (D) Distribution of the Z scores for GEO: GSE35459 samples comparing human blood DC and monocyte subsets to human skin DC or monocyte-derived macrophage subsets for 227 signature up (red) or down (blue) genes or an equivalent number of random probes (gray). Parallel comparison of human blood versus skin (left) of 1,217 IFNγ upregulated (orange) and 1210 IFNγ downregulated (purple) signature correlations (right) or an equivalent number of random probes (gray) (GEO: GSE18686, IFNγ and IFNγ + LPS specimens versus all other conditions). (E) Gene expression of the 227 upregulated signature module in migDC isolated from IFNγR1−/−, WT, and IL27Rα−/− mice. Each column represents migDC sorted from one mouse and processed as three distinct technical replicates. (F) GSVA. Association between Z score of IFNγ and 227 upregulated signatures (r = 0.9, CI =0.63-0.98) in individual IFNγR1−/− (blue), WT (black), and IL27Rα−/− (red) mice. Oval grouping of samples of migDC by condition, depicting n = 3 individual mice. Significance in loss of the 227 upregulated signature as compare to WT mice is noted **p < .01. See also Figure S2.
Figure 3
Figure 3. IFNγ-Directed Transcripts Co-enriched and Correlate with 227 Signature Genes across Multiple Human Cancers and Stratify Human Melanoma Survival
(A) SEEK analysis was performed comparing average 25th and 75th quartile random queries to 227-signature genes across the Gene Expression Omnibus and Cancer Genome Atlas datasets. Per dataset co-expression p values are plotted for 227 signatures demonstrating high levels of significance across thousands of datasets in the SEEK compendia. Among top 200 datasets prioritized, a significant portion of sets are associated with cancer, auto inflammatory disease (e.g., ulcerative colitis), and DCs. (B) Top 150 transcripts taken from IFNγ signatures (irrespective of direction of change), 200 of 227 homeostatic signature genes, or 200 random probes were compared across primary human cancers (TCGA). Correlation scores between individual tumor specimens expressing the IFNγ signature and homeostatic 227 signature are color coded and depicted below the plots (0.5–1) per cancer subtype. Kaplan-Meier Survival analysis of TCGA level 4 skin cutaneous melanoma (SKCM) from 280 metastatic melanoma patients. (C–E) High, medium, and low expression of either the (C) 227 signature, (D) IFNγ-dependent top 150 transcripts, or (E) non-silent somatic mutations were used to stratify patient survival. (F) Comparison of patient samples classified by high, medium, or low average expression for the IFNγ signature, 227 signature, or non-silent somatic mutations. See also Figure S3.
Figure 4
Figure 4. Single-Cell RNA-Seq Reveals 227 Programming in Mononuclear Phagocytes and Close Per-Cell and Population-Based Correlation between 227 Homeostatic Programming and IFNγ
(A) Transcriptomes of 333 BDCA1+ DC, BDCA3+DC, and monocytes from a patient with melanoma visualized by tSNE. Differential gene expression between two annotated BDCA3+ dendritic cell clusters (Table S7A) shows that they are PDC-like and cDCs. (B) Heatmaps representing relative single-cell expression of the up (left) and downregulated (right) genes that comprise the 227 signature annotated by single-cell populations previously assayed (Tirosh et al., 2016), along with additional populations of monocytes and DC examined here. Genes with expression fold change greater than 1.5 in at least two of four populations are annotated below the heatmaps: monocyte, BDCA1+ DC, BDCA3+ PDC, and BDCA3+ cDC. (C) Correlation of the upregulated gene score in the 227-signature of a single cell and the IFNγ gene signature of the same cell (matched) or the average of the other single cells from within the same population (unmatched). The matched correlation is higher than the unmatched correlation for every population (p value < 0.001, paired t test). (D) Correlation of the upregulated gene score in the 227-gene signature and IFNγ gene signatures between in silico “bulk” averages of each population. The upregulated gene score of the 227-gene signature and IFNγ signature of each population is most correlated with its own IFNγ signature and 227-gene signature, respectively (p value < 0.003; Welch's t test). See also Figure S4.
Figure 5
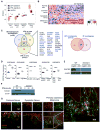
Figure 5. 227-Gene Signatures, IFNγ-Specific Signatures, and SOCS2 Are Closely Associated with Early Human Primary Cutaneous Melanoma
(A) Z score comparing overall expression levels for IFNγ- and 227-gene signatures in skin biopsies taken from normal skin (n = 6 patients), common nevi (n = 5 patients), dysplastic nevi (n = 7 patients), or primary cutaneous melanoma (n = 6 patients). (B) Corresponding 227-signature heatmap analysis. (C) Venn diagram overlapping 227 signature genes with a statistically significant intersection (n = 37) across all 5 mononuclear phagocyte transitions (n= 97), with IFNγ in vitro (n = 154) and in vivo (n = 131) treatments (left). Venn diagram of 227 genes in melanoma (n = 113) overlapping the 37 genes intersecting all developmental transitions and those induced by IFNγ in vitro and in vivo (right). The list of 37 genes includes those overlapping the 113 of 227 signatures induced in melanoma (blue). (D) Log2 expression of SOCS2 transcripts in human (GEO: GSE35459) and murine (GEO: GSE49358, GEO: GSE53588, GEO: GSE60782, GEO: GSE66970) DC ormonocyte/macrophage subsets defined by groups. (E) Expression of SOCS2 protein in migDCs and cDCs isolated from skin draining LNs from Flt3L treated mice (n = one of two representative experiments). (F) SOCS2 and β–actin expression in cellular lysates of Flt3L-cultured murine BMDCs derived from WT or SOCS2−/− mice prepared prior to or 24 or 48 hr after IFNγ treatment. Data are representative of three technical replicates. (G) Staining of CD11c (Alexa488, green) and SOCS2 (rhodamine, red) in patient specimens (n = 5-7 patients assayed per group with representative immunofluorescence depicted). See also Figure S5 and Data S1.
Figure 6
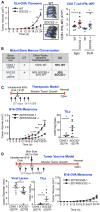
Figure 6. Global and DC-Specific SOCS2 Expression Inhibits Antitumor Immunity
(A) Intradermal growth of EL4-OVA thymoma (left). OVA-peptide-specific CD8+ T cell recall assay. Intracellular cytokine staining of IFNγ in T cells isolated from the spleen and tumor draining LNs of SOCS2−/− and WT mice. (B) Table depicting the breakdown of the immune cells present during use of ZBTB46 (ZDTR) mixed bone marrow chimeras for uncompensated DC-specific loss. (C) Therapeutic model of acute restriction to SOCS2−/− DCs using DT administration surrounding tumor implantation, and concurrent B16-OVA growth with the intratumoral CD8/Treg ratio. (D) Schema for therapeutic tumor vaccine model. VACV-OVA was administered 3 days after B16-OVA implantation in bone marrow chimera mice and given DT to generate a DC-specific loss of SOCS2 surrounding implantation. Vaccinia tail lesion diameter (left), frequency of OVA-specific IFNγ + CD8+ TILs assayed by peptide recall and intracellular cytokine staining (middle), and intradermal B16-OVA tumor growth (right). Tumor growth curves were pooled from three independent experiments of four to five mice per group. For antigen recall and TILS analysis, open and closed shapes represent each pooled independent experiment, with individual animals from replicate experiments depicted. Error bars show mean ± SEM. *p ≤ 0.05; **p ≤ 0.01; ***p ≤ 0.001. See also Figure S6.
Figure 7
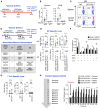
Figure 7. SOCS2 Inhibits Adaptive Immune Priming by DC
(A) Schematic for aCD205-gagp24 protein immunization. (B and C) (B) Intracellular cytokine staining. HIV gag p24 antigen-specific or control p17 recall IFNγ production by CD4+T cells in WT and SOCS2−/− mice1 week after αCD205-gagp24 prime-boost immunization, with (C) representative flow. (D) Schematic of αCD205-gagp24 protein immunization with diphtheria toxin (DT) administered 1 and 3 days prior to prime and boost. Table depicting the breakdown of the immune cells present during use of ZBTB46 (ZDTR) mixed bone marrow chimeras, +/− diphtheria toxin administration for acute DC-specific loss. (E and F) (E) Individual or (F) combinatorial expression of IFNγ, TNFα, and IL-2 in HIV gag-p24 specific splenic CD4+ T cells. (G) SOCS2−/− T cells or WT T cells were adoptively transferred into Rag2−/− recipients. One week following boost, intracellular cytokine staining of T cells was performed with HIV gagp24 peptide re-challenge. (H) Contact sensitivity schema (left) and murine ear thickness (right) following induction of contact hypersensitivity in mice with loss of SOCS2 restricted to CCR7-dependent cells. Open and closed shapes represent individual animals pooled from each of two independent experiments. All experiments were performed at least twice, with three to six mice per group. Error bars show mean ± SEM. *p ≤ 0.05, **p ≤ 0.01, ***p ≤ 0.001. See also Figure S7.

Comment in

References

    1. Anandasabapathy N, Victora GD, Meredith M, Feder R, Dong B, Kluger C, Yao K, Dustin ML, Nussenzweig MC, Steinman RM, Liu K. Flt3L controls the development of radiosensitive dendritic cells in the meninges and choroid plexus of the steady-state mouse brain. J Exp Med. 2011;208:1695–1705. - PMC - PubMed
    1. Anandasabapathy N, Feder R, Mollah S, Tse SW, Longhi MP, Mehandru S, Matos I, Cheong C, Ruane D, Brane L, et al. Classical Flt3L-dependent dendritic cells control immunity to protein vaccine. J Exp Med. 2014;211:1875–1891. - PMC - PubMed
    1. Askenase MH, Han SJ, Byrd AL, Morais da Fonseca D, Bouladoux N, Wilhelm C, Konkel JE, Hand TW, Lacerda-Queiroz N, Su XZ, et al. Bone-Marrow-Resident NK Cells Prime Monocytes for Regulatory Function during Infection. Immunity. 2015;42:1130–1142. - PMC - PubMed
    1. Baratin M, Foray C, Demaria O, Habbeddine M, Pollet E, Maurizio J, Verthuy C, Davanture S, Azukizawa H, Flores-Langarica A, et al. Homeostatic NF-κB Signaling in Steady-State Migratory Dendritic Cells Regulates Immune Homeostasis and Tolerance. Immunity. 2015;42:627–639. - PubMed
    1. Bonifaz LC, Bonnyay DP, Charalambous A, Darguste DI, Fujii S, Soares H, Brimnes MK, Moltedo B, Moran TM, Steinman RM. In vivo targeting of antigens to maturing dendritic cells via the DEC-205 receptor improves T cell vaccination. J Exp Med. 2004;199:815–824. - PMC - PubMed

MeSH terms

Substances