. 2017 Jun 29;170(1):199-212.e20.
doi: 10.1016/j.cell.2017.06.011.

Type 2 Diabetes Variants Disrupt Function of SLC16A11 through Two Distinct Mechanisms

Collaborators, Affiliations

Type 2 Diabetes Variants Disrupt Function of SLC16A11 through Two Distinct Mechanisms

Victor Rusu et al. Cell. .

Abstract

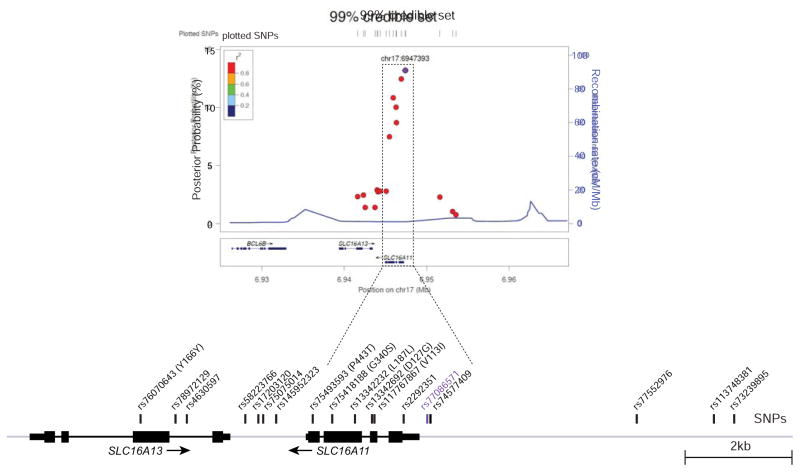
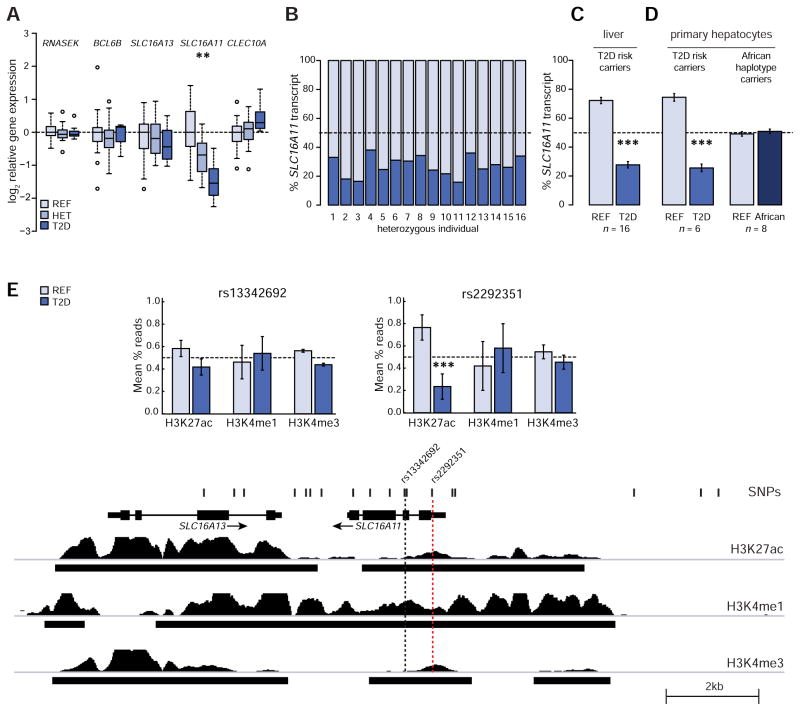
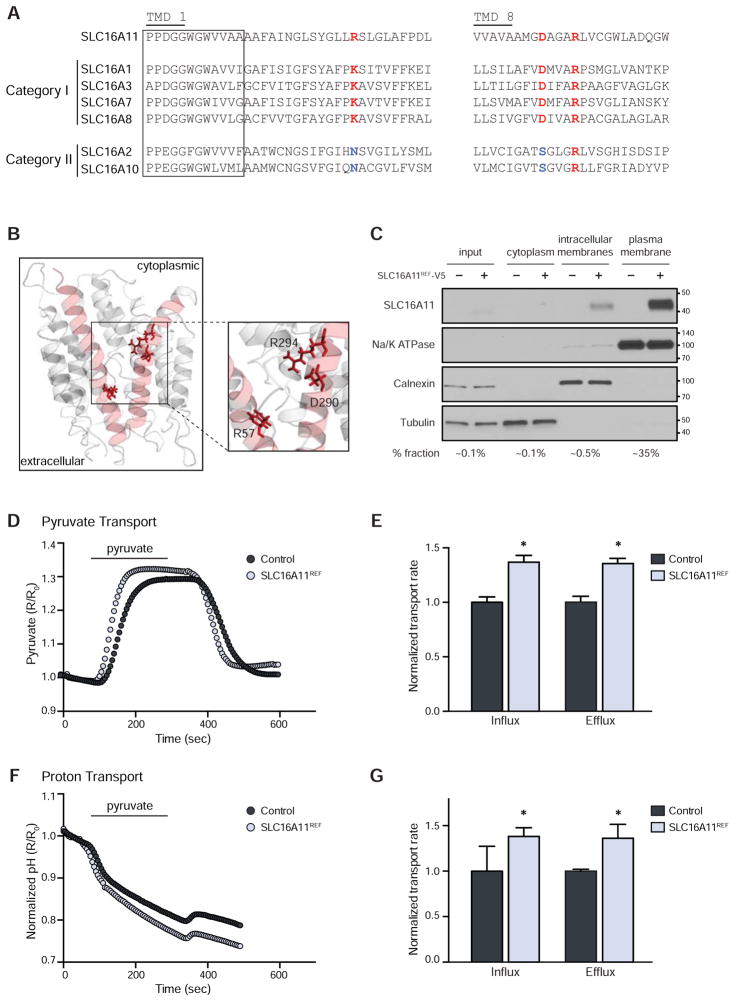
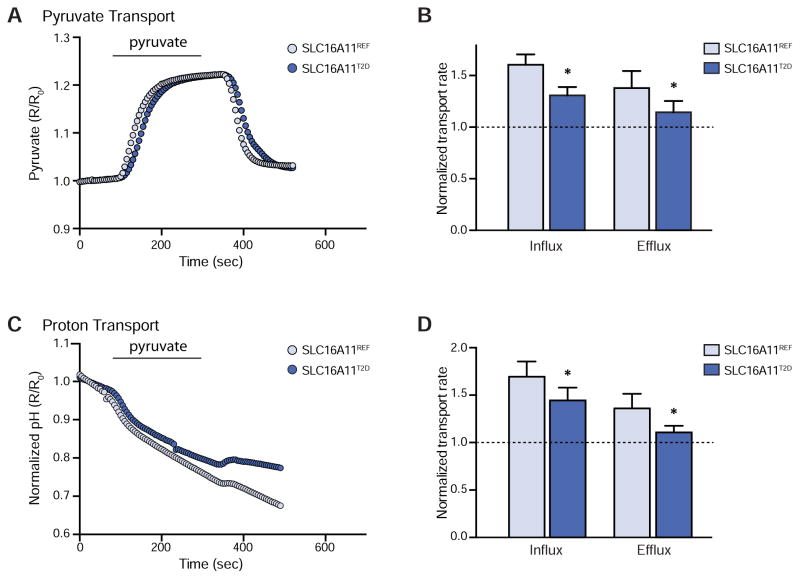
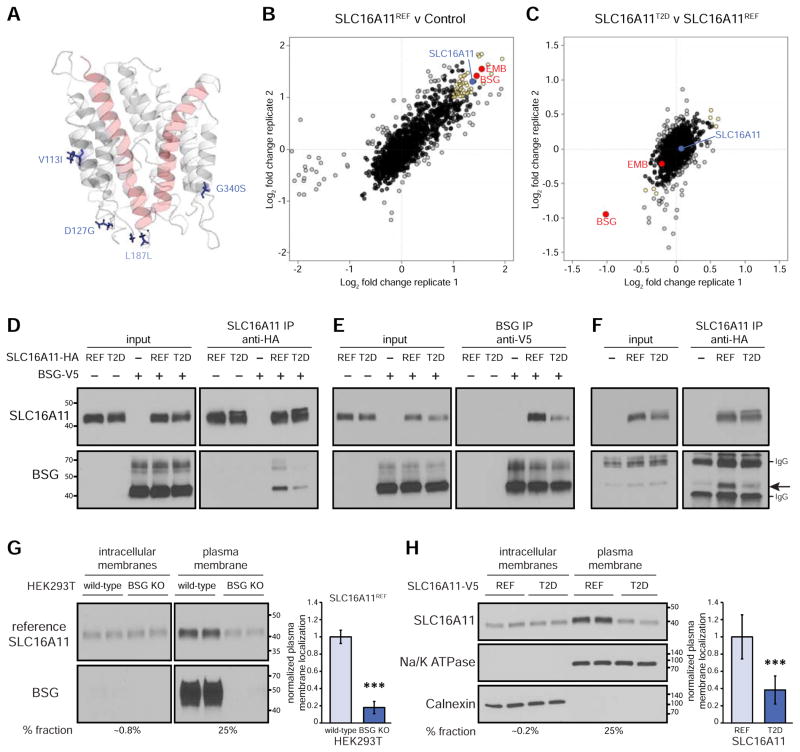
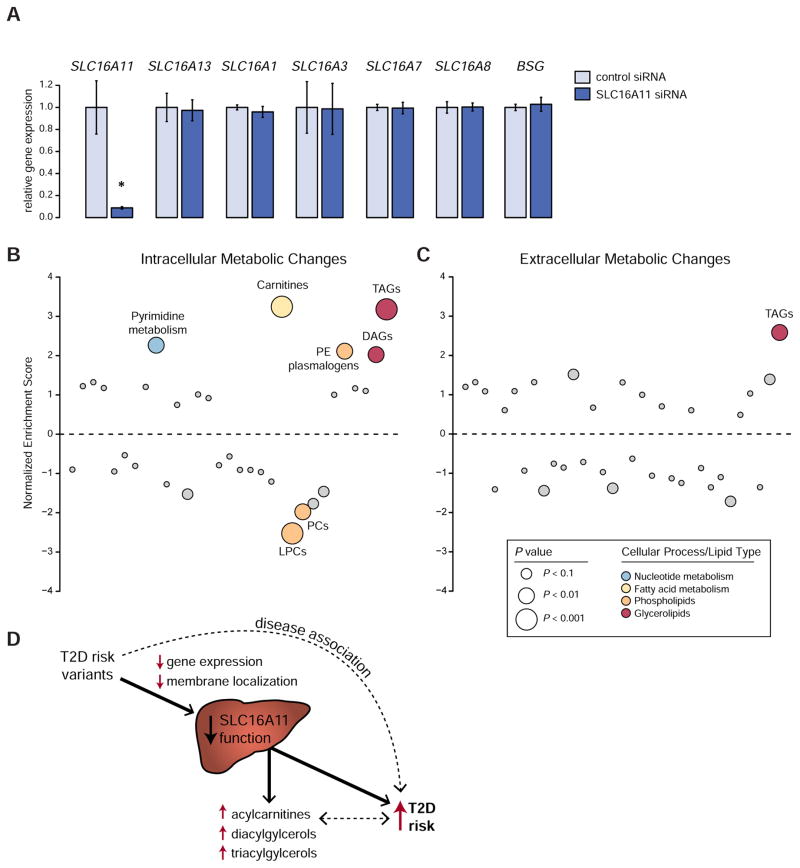
Type 2 diabetes (T2D) affects Latinos at twice the rate seen in populations of European descent. We recently identified a risk haplotype spanning SLC16A11 that explains ∼20% of the increased T2D prevalence in Mexico. Here, through genetic fine-mapping, we define a set of tightly linked variants likely to contain the causal allele(s). We show that variants on the T2D-associated haplotype have two distinct effects: (1) decreasing SLC16A11 expression in liver and (2) disrupting a key interaction with basigin, thereby reducing cell-surface localization. Both independent mechanisms reduce SLC16A11 function and suggest SLC16A11 is the causal gene at this locus. To gain insight into how SLC16A11 disruption impacts T2D risk, we demonstrate that SLC16A11 is a proton-coupled monocarboxylate transporter and that genetic perturbation of SLC16A11 induces changes in fatty acid and lipid metabolism that are associated with increased T2D risk. Our findings suggest that increasing SLC16A11 function could be therapeutically beneficial for T2D. VIDEO ABSTRACT.

Keywords: MCT11; SLC16A11; disease mechanism; fatty acid metabolism; genetics; lipid metabolism; monocarboxylates; precision medicine; solute carrier (SLC); type 2 diabetes (T2D).


Figures

Figure 1
Figure 1. T2D risk credible set at 17p13
Regional signal plot representing variants in the 99% credible set for the T2D signal at 17p13. The T2D risk credible set variants are depicted as points and the colors indicate the R-squared with the top SNP (rs77086571), marked in purple. Depiction of the locus with credible SNPs indicated is shown below.
Figure 2
Figure 2. The T2D risk haplotype contains a cis-eQTL for SLC16A11 in liver
(A) Expression-QTL (eQTL) analyses in liver. Box plots depict the log2 of the relative expression level for RNASEK, BCL6B, SLC16A11, SLC16A13, and CLEC10A according to genotype at rs13342692. n = 21 homozygous reference (REF), 16 heterozygous (HET), and 10 homozygous T2D risk (T2D). See also Figure S1. (B–D) Allele-specific expression analyses in (B and C) HET livers (n = 16) and (D) primary human hepatocytes heterozygous for either the T2D risk (n = 6) or African (n = 8) haplotypes. Bar plots depict the estimated allelic proportion and 95% confidence interval of SLC16A11 transcript originating from each allele. See also Figure S2. (E) ChIP-sequencing for H3K27ac, H3K4me1, and H3K4me3 histone modifications in human hepatocytes from three individuals heterozygous for the T2D risk haplotype. Tracks overlapping variants in the T2D risk credible set are shown. Bar plots depict allelic proportions ± SEM at rs13342692 and rs2292351. See also Figure S2. Asterisks indicate significance after Bonferroni correction for multiple hypothesis testing: ** P < 1×10⁻³, *** P < 1×10⁻⁵.
Figure 3
Figure 3. SLC16A11 is a proton-coupled monocarboxylate transporter
(A) Sequence alignment of transmembrane domains (TMDs) 1 and 8 from SLC16A11 and SLC16 category I and II family members. Box indicates the SLC16 consensus sequence. Residues conserved in SLC16 category I members are indicated in red. Residues conserved in SLC16 category II members are indicated in blue. (B) Three-dimensional homology modeling of SLC16A11. (C) Membrane fractionation of HEK293T cells expressing SLC16A11REF-V5. Equal quantities of protein from each fraction were loaded; the percentage of each fraction loaded is indicated below. Note the higher proportion of plasma membrane fraction loaded. Fraction markers include Na/K ATPase (plasma membrane), calnexin (endoplasmic reticulum), and tubulin (cytoplasm). Molecular weight markers (kDa) are indicated. (D–G) Assessment of pyruvate (pyronic) and proton (BCECF-AM) flux in HEK293T cells expressing either SLC16A11REF (light blue) or empty vector control (gray). Pyruvate (0.4 mM) was added and removed, as indicated. (D) Representative traces and (E) bar plots depicting normalized rates of pyruvate influx and efflux ± SEM. * P < 0.05, n = 11. (F) Corresponding representative traces and (G) bar plots depicting normalized rates of proton influx and efflux ± SEM. * P < 0.05, n = 11. See also Figure S3.
Figure 4
Figure 4. T2D risk-associated coding variants abrogate SLC16A11 activity
(A–D) Assessment of pyruvate (pyronic) and proton (BCECF-AM) flux in HEK293T cells expressing either SLC16A11REF (light blue) or SLC16A11T2D (dark blue). Pyruvate (0.4 mM) was added and removed, as indicated. (A) Representative traces and (B) bar plots depicting normalized rates of pyruvate influx and efflux ± SEM. The rate of transport is normalized to empty vector control, which is indicated by the dashed line. * P < 0.05, n = 11. (C) Corresponding representative traces and (D) bar plots depicting normalized rates of proton influx and efflux ± SEM. * P < 0.05, n = 11. See also Figure S3.
Figure 5
Figure 5. T2D risk coding variants reduce plasma membrane localization by disrupting an interaction between SLC16A11 and BSG
(A) Homology model of SLC16A11 with T2D risk coding variants indicated. P443T is located on an unstructured cytosolic tail and is not included in our model. (B) Scatterplot showing enrichment of proteins immunoprecipitated from HEK293T cells expressing P2D SLC16A11REF-V5 compared to cells expressing empty vector control. SLC16A11 is shown in blue. BSG and EMB are shown in red along with other highly enriched proteins (top 10% with a Blandt-Altman-adjusted P < 0.05) in yellow. Biological replicates from two independent experiments are plotted on the different axes. See also Table S2. (C) Scatterplot showing relative interaction of proteins with P2D SLC16A11T2D-V5 compared to P2D SLC16A11REF-V5. See also Table S2. (D–F) Co-immunoprecipitation of SLC16A11 (in the absence of P2D) and BSG. (D) Interaction of BSG-V5 with immunoprecipitated SLC16A11-HA. (E) Interaction of SLC16A11-HA with immunoprecipitated BSG-V5. (F) Interaction of endogenous BSG with immunoprecipitated SLC16A11-HA. (G) Representative membrane fractionation in WT and BSG-knockout HEK293T cells. Equal quantities of protein from each fraction were loaded. The percentage of each fraction loaded is indicated below. Bar plots depict the relative fraction of SLC16A11 at plasma membrane ± SD (n = 8, P = 3×10⁻¹²). (H) Representative membrane fractionation in HEK293T cells expressing either SLC16A11REF-V5 or SLC16A11T2D-V5. Equal quantities of protein from each fraction were loaded. The percentage of each fraction loaded is indicated below. Fraction markers include Na/K ATPase (plasma membrane) and calnexin (endoplasmic reticulum). Bar plots depict the relative fraction of SLC16A11 at the plasma membrane ± SD (n = 15, P = 4×10⁻⁸). *** P < 1×10⁻⁵. See also Figures S4 and S5.
Figure 6
Figure 6. Knock down of SLC16A11 in primary human hepatocytes alters metabolites associated with insulin resistance and T2D
(A) Gene expression in primary human hepatocytes treated with siRNAs targeting SLC16A11 or negative control siRNAs. Bar plots depict relative gene expression ± SD using TBP for normalization. * P ≈ 4.8 × 10⁻³ (B and C) Enrichment analysis of (B) intracellular and (C) extracellular metabolic pathway changes following SLC16A11 knockdown in primary human hepatocytes. Each dot represents a different metabolic pathway or metabolite class. P values are indicated by dot size. Significantly altered pathways (false discovery rate [FDR] < 0.05) are labeled, with non-significant pathways shown in gray. LPCs, lysophosphatidylcholines; PCs, phosphatidylcholines; PE, phosphatidylethanolamine; DAGs, diacylglycerols; TAGs, triacylglycerols. See also Figures S6 and S7 and Tables S3 and S4. (D) Depiction summarizing the effects of T2D-associated variants at 17p13 on T2D risk. The T2D disease association at 17p13 is driven by variants that disrupt SLC16A11 function, which itself leads to changes in fatty acid and lipid metabolism that are associated with increased risk of T2D. The causality of the associations between increased acylcarnitines, DAGs and TAGs and disease are uncertain.

Comment in

References

    1. Adams SH, Hoppel CL, Lok KH, Zhao L, Wong SW, Minkler PE, Hwang DH, Newman JW, Garvey WT. Plasma acylcarnitine profiles suggest incomplete long-chain fatty acid beta-oxidation and altered tricarboxylic acid cycle activity in type 2 diabetic African-American women. J Nutr. 2009;139:1073–1081. - PMC - PubMed
    1. Bernstein BE, Kamal M, Lindblad-Toh K, Bekiranov S, Bailey DK, Huebert DJ, McMahon S, Karlsson EK, Kulbokas EJ, 3rd, Gingeras TR, et al. Genomic maps and comparative analysis of histone modifications in human and mouse. Cell. 2005;120:169–181. - PubMed
    1. Cohen JC, Boerwinkle E, Mosley TH, Jr, Hobbs HH. Sequence variations in PCSK9, low LDL, and protection against coronary heart disease. N Engl J Med. 2006;354:1264–1272. - PubMed
    1. Delaneau O, Zagury JF, Marchini J. Improved whole-chromosome phasing for disease and population genetic studies. Nat Methods. 2013;10:5–6. - PubMed
    1. Diamond J. The double puzzle of diabetes. Nature. 2003;423:599–602. - PubMed